
This paper evaluates the feasibility and benefits of a local food distribution system, which connects farmers and restaurant owners from a logistics perspective. This paper considers a platform to improve operations and investigates various schemes for delivering locally produced food to restaurants using a food hub.
To compare distribution scenarios and derive managerial implications, a simulation model has been developed and executed in Matlab 2019a©. The model evaluates various settings of business connections between farmers and restaurateurs.
Results of computational experiments highlight great potentials of such a system, particularly to reduce travel distances. To obtain these positive externalities, the local system requires specific attention during the design of logistical aspects and needs to be planned following a specific structure.
The developed simulation model can be used to improve understanding of related short food supply chains by analyzing specific cases where the main actors involved differ in terms of type, number, and location.
The paper analyzes the feasibility and the effects of a new distribution system that can connect supply chain actors directly. The analyses focus on logistics aspects, a topic that is often neglected in sustainable consumption research. Furthermore, the paper does not focus of a single case study but develops a customizable model to be used in various settings.
1. Introduction and background
Over the last decades, the conventional food system has been characterized by the dominance of large private corporations as well as by a high number of intermediaries, resulting in various environmental, economic, and social externalities. Food industrialization and globalization also lead to a reduction in biodiversity, problems in ecosystems, the increase of obesity, and the impossibility to obtain reliable information on food provenance and quality (Friends of the Earth Europe, 2015; Qaim, 2017; Pulker et al., 2018). This resulted in renewed interest of consumers in local food and alternative agri-food networks (Renting et al., 2003; Spielmann and Bernelin, 2015). At the same time, organizations have begun to restructure their supply chains to make them more sustainable (Wu and Pagell, 2011). These transformations, however, present considerable difficulties as the search for environmental and social sustainability is often opposed to the rationale of economic sustainability (Enjolras and Aubert, 2018). For the scope of this paper, it is important to highlight that SFSCs are not solely directed to the final consumers, but also find various applications in the context of providing local food to schools, hospitals and within the catering and hospitality industry.
The latter is the focus of this work. Various studies show a positive attitude of consumers towards the provision of local food in restaurants (Alfnes and Sharma, 2010; Schubert et al., 2010; Alonso et al., 2013; Campbell and DiPietro, 2014; Lillywhite and Simonsen, 2014; Contini et al., 2017; Filimonau and Krivcova, 2017; Birch et al., 2018; Kim and Huang, 2021). Environmental sustainability connected to short distances (Duram and Cawley, 2012), the support of local farmers (Reynolds-Allie and Fields, 2012; Dougherty et al., 2013), quality, freshness and taste (Inwood et al., 2009; Kang and Rajagopal, 2014) as well as the knowledge of the food source (Strohbehn and Gregoire, 2003) are key benefits that consumers recognize to the restaurateur's choice of using locally grown ingredients.
Nevertheless, despite the recognized benefits of direct farm-restaurant connections and the chefs' and local producers' interest in working together (Roy et al., 2016), significant barriers to an efficient supply system network design remain, particularly concerning communication and logistics issues commonly present in SFSCs (Paciarotti and Torregiani, 2021). Cooperation, coordination and integration between participants in the supply chain are commonly noted as a key strategy for improving performance (Forslund, 2015; Gandhi et al., 2017; Vodenicharova, 2020).
To enable, facilitate, and increase the restaurant's use of local food, this paper analyzes a new and efficient supply chain structure by the introduction of a coordinated logistics system. While many studies focus on assessing the sustainability of local food supply compared to global one, the key challenge is to define under with condition such SFSCs happen (Paciarotti and Torregiani, 2021) and how they develop successfully over time (Kump and Fikar, 2021). This requires detecting and defining parameters values affecting the supply chain environmental impact and system configurations that lead to better performance (Loiseau et al., 2020). For this reason, this paper analyzes different scenarios to detect which structure is feasible from a logistics perspective and under which conditions the implementation of an organized and coordinated supply chain leads to more positive externalities. Since particularly the transportation phase causes significant environmental impact across all categories (Krishnan et al., 2020; Sallnäs and Björklund, 2020), the focus of this paper is to analyze and compare different distribution patterns in terms of two key indicators: travel time and distance. To avoid the low generalizability of the case study approach (Benrqya, 2019), a specific simulation model is developed. This allows one to extend the results of this paper to related settings and further provides a tool that can be used to design coordinated system in practice. Consequently, the contribution of this work is twofold: (1) it provides a decision tool to evaluate the impact of various distribution patterns for SFSCs between local farms and restaurants, and (2) provides various policy and managerial implications on how to facilitate the implementations of such logistics concepts in the future. The remainder of the paper is organized as follows: Section 2 introduces related work. The logistics platform and proposed alternative distribution scenarios are introduced in Section 3, while Section 4 reports the outcomes of the analysis as well as derived implications and Section 5 highlights the conclusions of the study.
2. Literature review
2.1 Short food supply chain
Short Food Supply Chains (SFSCs) play a crucial role in such emerging food interests and represent a sustainable alternative to the dominating agro-industrial model. According to Agrillo et al. (2015), SFSCs emerge if producers and consumers realize that they share a common goal in strengthening local food networks and see possibilities to lower both food miles and the number of intermediaries involved.
Although there is no unique definition of SFSCs (Kneafsey et al., 2013), it is possible to highlight two key features: geographical and social proximity. The geographical proximity is the most common criterion to define local food and it represents the short physical distances between producers and consumers (Ilbery and Maye, 2005; Kebir and Torre, 2012). Social proximity involves direct contact between farmers and consumers as well as a relationship based on trust and honesty. Table 1 reports the main definitions proposed for SFSCs and highlights the kind of proximity emphasized by the authors (social, geographical, or both).
SFSC definitions
| Sources | Definition | Proximity criteria |
|---|---|---|
| Marsden et al. (2000) | “a common characteristic, however, is the emphasis upon the type of relationship between the producer and the consumer in these supply chains, and the role of this relationship in constructing value and meaning, rather than solely the type of product itself” (p. 425) | Social Proximity |
| Parker (2005) | “(1) localised and using less food miles, or (2) more direct exchange using fewer intermediaries” (p. 2) | Social and Geographical Proximity |
| Ilbery and Maye (2005) | “the crucial characteristic of SFSCs is that foods which reach the final consumer have been transmitted through an Supply Chain that is ‘embedded' with value-laden information concerning the mode of production, provenance, and distinctive quality assets of the product” (pp. 825-826) | Social Proximity |
| Kneafsey et al. (2013) | “The foods involved are identified by, and traceable to a farmer. The number of intermediaries between farmer and consumer should be ‘minimal' or ideally nil” (p. 13) | Social Proximity |
| European Union, Reg.1305/13 | “a supply chain involving a limited number of economic operators, committed to cooperation, local economic development, and close geographical and social relations between producers, processors and consumers” (art.2) | Social and Geographical Proximity |
Various types of SFSCs (e.g. farm shops, pick-your-own, farmers' markets, box schemes, collective farmer shops, civic agriculture models, food cooperatives) and different categorization (Gilg and Battershill, 2000; Marsden et al., 2000; Renting et al., 2003; Bertazzoli et al., 2010; Kneafsey et al., 2013; Casolani, 2015; Chiffoleau et al., 2016) exists in practice and literature. Specifically, this paper focuses on the use of local food in restaurant.
2.2 Providing local food to restaurants
The topic of providing local food in restaurants is commonly investigated from a business perspective. For farmers, sourcing directly to restaurants can result in increased sales in terms of both quantity and price (Alonso, 2010; Sharma et al., 2012). It further represents an opportunity to sell perishable food that would otherwise be wasted during high-production seasons (Thilmany, 2004). For restaurateurs, the attempt to source only locally grown food is considered an operating principle that operationalizes the organizations' environmental values and goals (Wu and Pagell, 2011). Furthermore, restaurateurs recognize that food quality and taste, which are two of the most decisive purchasing criteria, are superior when food is grown locally (Starr et al., 2003; Inwood et al., 2009). Additionally, the use of locally grown food in restaurants can be a promotional vehicle (Inwood et al., 2009; Blichfeldt and Halkier, 2014) and can also offer social benefits for the local community through the preservation of traditions and culture as well as a deeper involvement in the development process (Starr et al., 2003).
Nevertheless, managing such SFSCs between local farmers and restaurants is challenging. Several studies highlight communications issues between farmers and restaurants and identify that there is a lack of knowledge regarding local product availability (Sharma et al., 2014; Alonso, 2010; Alonso and O'Neill, 2010; Curtis and Cowee, 2009; Brain et al., 2015). This is further complicated by the limited availability of local food products in terms of quantity and variety throughout the year (Kang and Rajagopal, 2014). Additionally, logistics issues hinder the development of SFSCs (Kump and Fikar, 2021). This is mainly due to the following characteristics: the distribution involves small order quantities and high-frequency deliveries (Starr et al., 2003); there is a large number of receivers (Morganti and Gonzalez-Feliu, 2015); the logistics capacity is irregular in term of transportation and delivery services (Green and Dougherty, 2008; Peterson et al., 2010; Dougherty et al., 2013); and low vehicle load factors result in high unit transport cost, substantially increasing delivery costs (Sharma et al., 2012). Additionally, the perception of inadequate distribution infrastructure is widespread (Inwood et al., 2009) and participating in SFSCs may leads to additional managerial efforts as restaurateurs have to interact with a large number of local farmers instead of a small group of distributors (Schmit and Hadcock, 2012; Sharma et al., 2014).
All these aspects show the great importance of considering operational factors in network design decisions of SFSCs. Related literature, however, rarely focuses on SFSCs and mainly studies strategic decisions, highlighting the need to integrate tactical and operational factors such as delivery frequencies in related models (Eskandarpour et al., 2015). For the food industry in general, Jouzdani and Govindan (2021) develop a multi-objective optimization model and show that it enables decision-makers to improve both environmental and social sustainability without substantially hurting economic goals. A simulation model is developed in Motevalli-Taher et al. (2020) to study supply, water consumption and job opportunities within an Iranian wheat supply chain. This allows one to further include uncertainties in the model to generate various managerial insights through sensitivity analyses. Within the context of SFSCs, little work is found in literature. Dragicevic (2021) uses stochastic matching and spatial randomness within a simulation model to investigate the spread of short agri-food sale circuits. The author argues that farms should specialize on few products for SFSCs while trading all other products through conventional channels. Various distribution settings for food cooperatives sourcing fresh produces from local farmers are investigated in Fikar and Leithner (2021). Simulation results highlight that cooperation is a critical success factors for such implementations and that one needs to closely consider impacts of shared distribution on daily operations. The focus in both papers is set on consumer demand, while interactions between farmers and restaurateurs are, in contrast to our work, not considered.
Consequently, relevant success factors and barriers for SFSCs between farmers and restaurateurs can be investigated by supply chain network design studies with the help of simulation and/or optimization methods to generate managerial insights. Based on this finding, this work facilitates ideas from supply chain network design concepts by introducing a local food hub. Simulation is used to generate business connections between farmers and restaurateurs, while an optimization procedure derives promising delivery tours.
3. Material and methods
The subsequent parts introduce the local food hub, the investigated scenarios, and the simulation plan to evaluate impacts of various distribution patterns between farms and restaurants.
3.1 The local food hub
This paper analyzes a coordinated local food hub system, expanding on the work presented in Paciarotti and Torregiani (2018), that enables farmers to directly insert on an online platform available products and quantities, together with the price, which is independently defined by the producers. Restaurateurs choose the products they need and the farmers from which to buy from. Logistics activities are organized by the local food hub staff on the basis of orders placed on the online platform and pre-ordered products. Payments and related billing are managed with the support of the online platform, but involve only farmers and restaurateurs. The economic sustainability of the local food service is achieved by charging a percentage of this economic transaction: farmers and restaurateurs pay for the provided services depending on the use of the services. The food hub can also be defined as a transshipment platform where food products from various suppliers are received and consolidated and subsequently delivered to the final destinations, i.e. the restaurants (Kinnear, 1997). This physical food hub can further be used as a warehousing point, however, only for short periods and for pre-purchased products.
This distribution system reduces the time goods spent in storage, preserve food freshness, and lessen the economic risks associated with unsold products. Furthermore, the local food hub system matches the principles of SFSCs: actors are located in the same geographic area (geographical proximity) and are enabled to directly interact within the system without intermediaries (social proximity).
3.2 The local food hub scenarios
To evaluate the logistics effects of the introduction of such a local food hub, different SFSC models are compared to identify an optimal one, if it exists, or highlight the advantages and disadvantages of each of the considered settings.
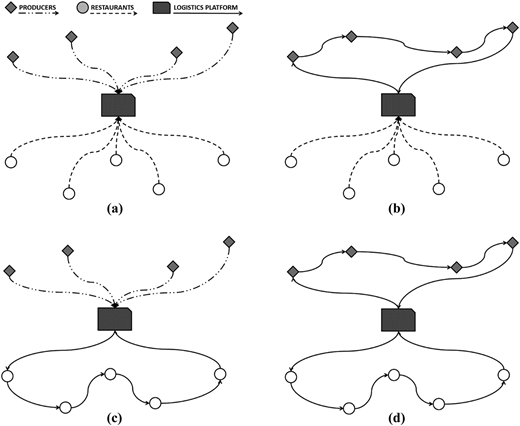
The base setting where no food hub exists is described by Scenario 1 and shown by Figure 1. In this setting, either restaurateurs can collect food directly from the producers or producers can deliver directly to the restaurateurs (Paciarotti and Torregiani, 2018). It only considers the introduction of an online platform that better connects restaurateurs and farmers but does not provide any logistics services. Thus, Scenario 1A and 1B can be modeled and described as follows:
Scenario 1A - The transport of the goods depends entirely on the producers who deliver to the restaurateurs from whom they have received orders (Figure 1b);
Scenario 1B - The transport of the goods depends entirely on the restaurateurs who collect food from the producers from whom they have ordered (Figure 1c).

The remaining scenarios consider the introduction of a food hub, which provides logistics services to all participating farmers and restaurateurs. As shown in Figure 2, four additional scenarios are identified considering varying degrees of the services provided:
Scenario 2 (Figure 2a) - all farmers transport their products to the hub and all restaurateurs pick up the products ordered at the hub. The logistics platform works only as a consolidation point;
Scenario 3 (Figure 2b) - the food collection from farms is coordinated and managed by food hub, while the restaurateurs pick up the ordered food at the hub autonomously;
Scenario 4 (Figure 2c) - the food delivery to restaurants is coordinated and managed by the food hub, while the farmers deliver the ordered food autonomously to the hub;
Scenario 5 (Figure 2d) - the food hub manages both the product collection at the farmer level and the product delivery to the restaurants. Therefore, two main routes, provided by the logistics service, can be identified: the first corresponds to the pick-up round at producers and the second to the delivery round to restaurants.
All vehicle routes are optimized by solving a traveling salesman problem (TSP) using an ant colony optimization algorithm with the aim to reduce total travel distances by finding the best possible collection or delivery routes.
3.3 The simulation plan
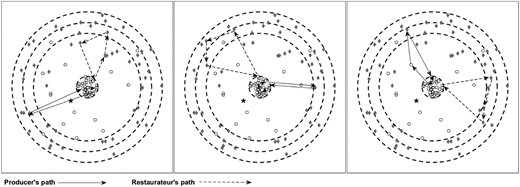
To compare the different distribution settings and derive managerial implications, a simulation model has been developed and executed in Matlab 2019a©. It generates various settings of business connections between producers, e.g. farmers, and restaurateurs. The total number of actors, i.e. producers and restaurants, in each simulation experiment is fixed to 100. How many of these actors represent restaurants is varied throughout the experiments with five different configurations considered: from [80% producers, 20% restaurants] to [20% producers, 80% restaurants]. The location of actors is set randomly with restaurants mainly being in the center of the study area. In contrast, farmers are located within a radius of 30 km (±5 km) from the city center (as from Kneafsey et al. (2013), concerning the geographical proximity, the distance between producers and consumers can assume a wide range of values depending on geographical location, types of products, different national or internal/private regulations). Based on these rules, one hundred geographic actor distributions within the respective areas are simulated to obtain statistically valid results for each setting. The hub is located outside the city center, within an area represented by an annulus centered in the system center (internal and external radius of 5 and 10 km, respectively). The food hub position in this region has further been varied within the computational experiments for statistical validity. Figure 3 provides examples for three possible distributions (producers are represented as gray diamonds, restaurants as circles and the hub is represented as a star).

Figure 4 summarizes how the computational experiments are run. It starts with the definition of all relevant input parameters such as the proportion of producers and restaurants in the study setting. The subsequent 100 iterations each first randomly sets the locations based on the prior defined rule set and afterward generates 100 random business connection settings between producers and restaurateurs for each geographic distribution. Last, 100 different food hub locations are generated for each setting. Once all the input is generated, the scenario is evaluated and results are generated.

4. Results and discussion
Table 2 summarizes the results of the initial computational experiments. For Scenario 1, 1A, and 1B the following mean values (µ) with the relative standard deviation (σ*) are presented:
Covered distance by a single producer (DistP);
Covered distance by a single restaurateur (DistR);
Total distance covered by all producers (TotP);
Total distance covered by all restaurateurs (TotR) and
Total scenario distance all actors (Tot Dist).
Simulation results for Scenarios 1, 1A, and 1B
| % Rest | % Prod | DistP | DistR | TotP | TotR | Tot Dist |
|---|---|---|---|---|---|---|
| µ (σ*) | µ (σ*) | µ (σ*) | µ (σ*) | µ (σ*) | ||
| Scenario 1 | ||||||
| (a) | ||||||
| 20 | 80 | 38.26 (90.75%) | 124.39 (27.8%) | 3060.74 (8.61%) | 2487.77 (6.4%) | 5548.5 (5.55%) |
| 40 | 60 | 67.73 (43.32%) | 122.11 (29.41%) | 4063.98 (5.58%) | 4884.52 (4.87%) | 8948.5 (3.67%) |
| 50 | 50 | 75.11 (35.28%) | 109.84 (37.46%) | 3755.54 (5.18%) | 5491.79 (5.46%) | 9247.33 (3.86%) |
| 60 | 40 | 78.35 (33.4%) | 88.5 (52.26%) | 3133.9 (5.62%) | 5310.19 (6.75%) | 8444.08 (4.73%) |
| 80 | 20 | 78.94 (32.78%) | 41.65 (101.99%) | 1578.87 (7.92%) | 3331.87 (11.01%) | 4910.74 (7.89%) |
| Mean Value | (rel. St. dev.) | 67.68 (47.11%) | 97.30 (49.78%) | 3118.61 (13.16%) | 4301.23 (6.7%) | 7419.83 (5.14%) |
| Scenario 1A | ||||||
| (b) | ||||||
| 20 | 80 | 59.41 (53.07%) | – | 4752.62 (4.66%) | – | 4752.62 (4.66%) |
| 40 | 60 | 89.01 (26.83%) | – | 5340.39 (4.26%) | – | 5340.39 (4.26%) |
| 50 | 50 | 96.33 (25.08%) | – | 4816.37 (4.35%) | – | 4816.37 (4.35%) |
| 60 | 40 | 100.47 (24.83%) | – | 4018.62 (4.72%) | – | 4018.62 (4.72%) |
| 80 | 20 | 100.9 (24.82%) | – | 2018.05 (6.47%) | – | 2018.05 (6.47%) |
| Mean Value | (rel. St. dev.) | 38 (30.93%) | – | 4189.21 (4.89%) | – | 4189.21 (4.89%) |
| Scenario 1B | ||||||
| (c) | ||||||
| 20 | 80 | – | 170.92 (10.31%) | – | 3418.41 (2.68%) | 3418.41 (2.68%) |
| 40 | 60 | – | 168.87 (11.54%) | – | 6754.95 (2.34%) | 6754.95 (2.34%) |
| 50 | 50 | – | 156.64 (17.75%) | – | 7832.01 (2.95%) | 7832.01 (2.95%) |
| 60 | 40 | – | 133.99 (28.06%) | – | 8039.5 (3.88%) | 8039.5 (3.88%) |
| 80 | 20 | – | 73.03 (63.81%) | – | 5842.77 (6.79%) | 5842.77 (6.79%) |
| Mean Value | (rel. St. dev.) | – | 140.69 (26.29%) | – | 6377.53 (3.73%) | 6377.53 (3.73%) |
Except for the system composed of 20% of producers and 80% of restaurants, the mean distance covered by a single restaurateur is always higher than the one covered by a single producer. This is due to the assumption on the actor distribution that concentrates most of the restaurants in the center and locates farmers in the surrounding area, as evident by analyzing Figure 5 in which example routes are reported. The route taken by a producer (black line) is shorter than the one covered by the restaurateur (dashed line).
To better understand and compare the obtained results in terms of system performance, Figure 6 summarizes the mean value of the total distance covered in Scenarios 1, 1A, and 1B. Scenario 1, which represent the least coordinated one where the food transport is randomly in charge of both actors, is the worst in term of total travel distance. When the actors' number remain balanced (from [40% producers, 60% restaurants] to [60% producers, 40% restaurants]), the best performance is observed if only the producers manage the food distribution (1A); while in the extreme cases [20% producers, 80% restaurants] and [80% producers, 20% restaurants], a lower total distance is observed if the less represented actor manages the food transport (1A and 1B, respectively). This highlights that system performance and, consequently, the preference of each scenario highly depends on the ratio between farmers and restaurateurs within the study area.
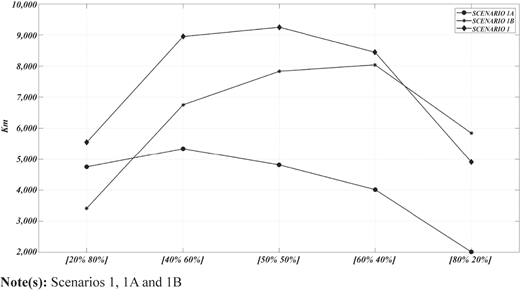
Table 3 shows the results following the food hub introduction as a possible improvement of the system performance in terms of the covered distance.
Simulation results for Scenarios 2, 3, 4 and 5
| % Rest | % Prod | DistP | DistR | TotP | TotR | Tot Dist |
|---|---|---|---|---|---|---|
| µ (σ*) | µ (σ*) | µ (σ*) | µ (σ*) | µ (σ*) | ||
| Scenario 2 | ||||||
| 20 | 80 | 57.4 (13.1%) | 23.96 (32.3%) | 4592.04 (2.1%) | 479.25 (11.07%) | 5071.29 (2.79%) |
| 40 | 60 | 57.45 (13.11%) | 24.23 (31.91%) | 3446.87 (2.43%) | 969.05 (9.51%) | 4415.92 (3.6%) |
| 50 | 50 | 57.46 (13.1%) | 23.98 (32.23%) | 2873.1 (2.7%) | 1199.02 (9.65%) | 4072.13 (4.14%) |
| 60 | 40 | 57.43 (13.09%) | 24.3 (31.86%) | 2297.2 (2.94%) | 1457.77 (9.24%) | 3754.97 (4.8%) |
| 80 | 20 | 57.45 (13.04%) | 24.17 (31.98%) | 1148.96 (4.53%) | 1933.48 (9.17%) | 3082.44 (6.8%) |
| Mean Value | (rel. St. dev.) | 57.44 (13.09%) | 24.13 (32.06%) | 2302.76 (2.94%) | 1207.71 (9.73%) | 3469.03 (4.43%) |
| Scenario 3 | ||||||
| 20 | 80 | – | 23.96 (32.3%) | 809.41 (4.17%) | 479.25 (11.07%) | 1288.66 (5.93%) |
| 40 | 60 | – | 24.23 (31.91%) | 647.39 (4.64%) | 969.05 (9.51%) | 1616.44 (6.76%) |
| 50 | 50 | – | 23.98 (32.23%) | 564.11 (5.12%) | 1199.02 (9.65%) | 1763.13 (7.31%) |
| 60 | 40 | – | 24.3 (31.86%) | 473.42 (5.22%) | 1457.77 (9.24%) | 1931.19 (7.54%) |
| 80 | 20 | – | 24.17 (31.98%) | 293.34 (5.23%) | 1933.48 (9.17%) | 2226.81 (8.72%) |
| Mean Value | (rel. St. dev.) | – | 24.13 (32.06%) | 557.53 (4.88%) | 1207.71 (9.73%) | 1765.25 (7.25%) |
| Scenario 4 | ||||||
| 20 | 80 | 57.4 (13.1%) | – | 4592.04 (2.1%) | 155.89 (3.18%) | 4747.93 (2.55%) |
| 40 | 60 | 57.45 (13.11%) | – | 3446.87 (2.43%) | 252.85 (4.29%) | 3699.72 (2.91%) |
| 50 | 50 | 57.46 (13.1%) | – | 2873.1 (2.7%) | 297.12 (4.33%) | 3170.23 (3.09%) |
| 60 | 40 | 57.43 (13.09%) | – | 2297.2 (2.94%) | 344.3 (4.48%) | 2641.5 (3.36%) |
| 80 | 20 | 57.45 (13.04%) | – | 1148.96 (4.53%) | 427.59 (4.36%) | 1576.56 (4.47%) |
| Mean Value | (rel. St. dev.) | 57.44 (13.09%) | – | 2302.76 (2.94%) | 295.55 (4.13%) | 3167.19 (3.28%) |
| Scenario 5 | ||||||
| 20 | 80 | – | – | 809.41 (4.17%) | 155.89 (3.18%) | 965.3 (5.16%) |
| 40 | 60 | – | – | 647.39 (4.64%) | 252.85 (4.29%) | 900.25 (5.14%) |
| 50 | 50 | – | – | 564.11 (5.12%) | 297.12 (4.33%) | 861.23 (4.98%) |
| 60 | 40 | – | – | 473.42 (5.22%) | 344.3 (4.48%) | 817.72 (4.95%) |
| 80 | 20 | – | – | 293.34 (5.23%) | 427.59 (4.36%) | 720.93 (5.87%) |
| Mean Value | (rel. St. dev.) | – | – | 557.53 (4.88%) | 295.55 (4.13%) | 853.09 (5.22%) |
With the introduction of a local food hub, the distance covered by each actor is reduced notably. In Table 2, producers cover distances ranging between 38 km and 100 km and restaurateurs between 42 km and 170 km. In Tables 3a, 3b, and 3c, where actors use the local food hub, the distance covered by producers is around 58 km (Scenario 2 and Scenario 4) and that covered by restaurateurs around 24 km (Scenario 2 and Scenario 3), highlighting the benefits of such an introduction of a food hub. Table 4 summarizes the comparison, in terms of percentage improvement (−)/worsening (+), among the Scenarios 1, 1A and 1B and Scenarios 2–5 (Tables 4a, 4b, and 4c, respectively).
Comparison between scenarios
| % Rest | % Prod | Scenario 2 | Scenario 3 | Scenario 4 | Scenario 5 |
|---|---|---|---|---|---|
| (a) | |||||
| 20 | 80 | −8.60% | −76.77% | −14.43% | −82.60% |
| 40 | 60 | −50.65% | −81.94% | −58.66% | −89.94% |
| 50 | 50 | −55.96% | −80.93% | −65.72% | −90.69% |
| 60 | 40 | −55.53% | −77.13% | −68.72% | −90.32% |
| 80 | 20 | −37.23% | −54.65% | −67.90% | −85.32% |
| Mean Value | (rel. St. dev.) | −42% (47%) | −74 (15%) | −55% (42%) | −88% (4%) |
| (b) | |||||
| 20 | 80 | 6.71% | −72.89% | −0.10% | −79.69% |
| 40 | 60 | −17.31% | −69.73% | −30.72% | −83.14% |
| 50 | 50 | −15.45% | −63.39% | −34.18% | −82.12% |
| 60 | 40 | −6.56% | −51.94% | −34.27% | −79.65% |
| 80 | 20 | 52.74% | 10.34% | −21.88% | −64.28% |
| Mean Value | (rel. St. dev.) | 4% (721%) | −50% (69%) | −24% (60%) | −78% (10%) |
| (c) | |||||
| 20 | 80 | 48.35% | −62.30% | 38.89% | −71.76% |
| 40 | 60 | −34.63% | −76.07% | −45.23% | −86.67% |
| 50 | 50 | −48.01% | −77.49% | −59.52% | −89.00% |
| 60 | 40 | −53.29% | −75.98% | −67.14% | −89.83% |
| 80 | 20 | −47.24% | −61.89% | −73.02% | −87.66% |
| Mean Value | (rel. St. dev.) | −27% (158%) | −71% (11%) | −41% (112%) | −85% (9%) |
Scenario 2 is always the worst among the proposed ones and shows a high variability in its results. Its relative standard deviation ranges between 158 and 721% implying a high dependence on the actor's proportion. This means that any possible variation in actors' involvement can have either significant positive or negative consequences. Scenarios 3 and 4 provide considerable improvements in mean values, [−50% −74%] and [−24% −55%], respectively, but this improvement is highly variable as shown by the relative standard deviations.
In contrast, the joint management of both collections and deliveries by the food hub (Scenario 5) shows an increasing improvement independently to the proportion between the actors' typologies. Indeed, the improvement mean values remain quite constant since it ranges between 78 and 88% and the relative standard deviations between 4 and 10%. Thus, by varying the actors' number, the whole system does not change its performance demonstrating the scenario's robustness, flexibility and adaptability to different conditions.
Nevertheless, even if Scenario 5 could be identified as the optimal one at first sight, solely considering distance is not enough to confirm this assertion. One has to further consider another important factor for the evaluation of SFSCs: the time constraint. This is particularly of importance in SFSCs, where combining multiple trips within a single tour can negatively impact food quality (Fikar and Leithner, 2021). Additionally, restaurateurs often prefer receiving goods before the restaurant opens for customers, indicating that there are specific delivery time windows which need to be considered. For example, assuming an average vehicle speed equal to 50 km/h and a mean duration of 10 minutes for loading/unloading operations, Table 5 shows that Scenario 5 takes considerably longer to complete.
Example of gathering, delivery and total times
| % Rest | % Prod | TotP µ | TotR µ | Tot Dist µ | Gathering time Scenario 5 | Delivery time R Scenario 5 | Total time Scenario 5 |
|---|---|---|---|---|---|---|---|
| [km] | [km] | [km] | [h] | [h] | [h] | ||
| 20 | 80 | 809.41 | 155.89 | 965.3 | 29.5 | 6.5 | 36.0 |
| 40 | 60 | 647.39 | 252.85 | 900.25 | 22.9 | 11.7 | 34.7 |
| 50 | 50 | 564.11 | 297.12 | 861.23 | 19.6 | 14.3 | 33.9 |
| 60 | 40 | 473.42 | 344.3 | 817.72 | 16.1 | 16.9 | 33.0 |
| 80 | 20 | 293.34 | 427.59 | 720.93 | 9.2 | 21.9 | 31.1 |
To counteract this potential weakness of Scenario 5, the food hub can employ additional vehicles, e.g. it is possible to evaluate an additional scenario where producers and restaurateurs are grouped into clusters to lower trip lengths. While Scenario 5 establishes only a single trip for the food collection at the producers and another one to deliver food to restaurateurs, this new scenario, named Clustered Scenario 5, performs more than one trip for each of these operations. This further allows the food hubs to consider multiple time slots throughout the day.
The optimal number of clusters depends, besides the requirements of producers and restaurants, on the financial resources of the local food hub: e.g. three clusters in the same time slot require three vehicles and, consequently, higher investments and additional operational expenses. Clustered Scenario 5 defines 2,500 possible cluster combinations. From analyzing the results, it is interesting to highlight how Scenarios 2–5 are included in the possible clusters combinations of Clustered Scenario 5. Taking as an example the distribution with 50% restaurateurs and 50% producers, Figure 7 reports the total distance and the total time for each configuration identified by combining a certain number of producers' Cluster and restaurateurs' Clusters. It includes the following scenarios:
Scenario 2 (black square) - absence of coordinated logistics service, maximum number of clusters of six, one for both producers and restaurateurs;
Scenario 3 (black circle) - food collection coordinated and managed by the food hub, one cluster for all producers and maximum number of restaurateur clusters;
Scenario 4 (black diamond) - food delivery coordinated and managed by the food hub, maximum number of producer clusters and a single cluster for all restaurateurs;
Scenario 5 (star) - food gathering and delivery coordinated and managed by the food hub, one cluster for all producers and one cluster for all restaurateurs.

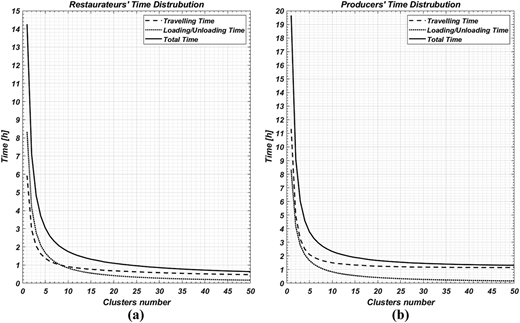
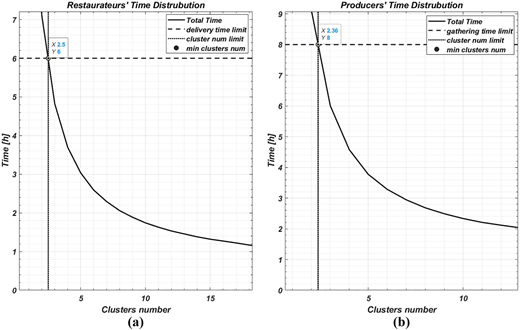
By analyzing the scenario combinations, it is possible to see that Scenario 5 (the star point) is the optimal one in terms of covered distance, but also the worst in terms of total time. This highlights a clear trade-off between travel distance and total time, i.e. more clusters result in a higher distance traveled, while fewer require more time. Figure 8 shows the total time related to the specific actors' class, highlighting the weight of traveling and loading time on it (a. restaurateurs, b. producers). It allows deriving how many clusters are required to meet specific time constraints if each actors' class can be analyzed separately. Then, the obtained value can be compared with the specific economic restrictions.
For this example, it is assumed that the food hub offers each service three times a week: Monday, Wednesday, and Friday are dedicated to the food collection from producers (with a time window of 8 h), while Tuesday, Thursday, and Saturday are dedicated to the food delivery to restaurants (with a delivery time window of 6 h).
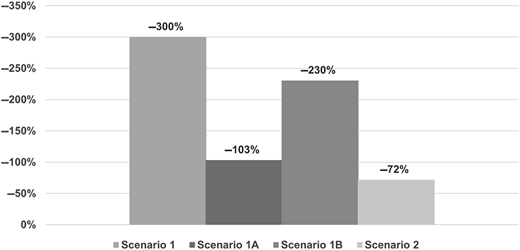
As results in Figure 9 highlight, it is possible to state that three clusters (Figure 9b) are required for food collection (484 km covered by a single cluster and 6h spent) and three clusters (Figure 9a) for delivery operations (306 km covered by each cluster and about 5h spent). In total, 2,370 km are covered for collection and delivering activities to meet the required time constraints. Figure 10 evaluates the improvement of this setting compared to Scenario 1&2. This shows that the introduction of a food hub positively impacts travel distances, highlighting the benefits of such joint collection and distribution strategies for SFSCs connecting producers and restaurants.
4.1 Policy and managerial implications
There are three categories of stakeholders that could benefit from the finding of this paper and its application: private managers focused on the sustainable economy, producers, and local politicians (Paciarotti and Torregiani, 2018). Private managers could have an interest in the implementation of the local food hub serving restaurants as well as producers that can self-organize and directly manage the food logistics hub in order to improve and expand their market. Finally, for the local politicians, the logistics system proposed is a mean to sustain the local economy and increase the touristic attractiveness of the territory. It is essential to emphasize that successful implementation of the system, however, requires careful and detailed planning that includes specific logistical considerations. In the light of that, the theoretical analysis framework proposed in this paper provides various practical implications for the stakeholders. It can be used to analyze specific use cases where the context is well defined and the farms and restaurants adhering to the system, with specific relative distance, are known. At first, an estimate of the number and type of actors involved their food demand and availability as well as the requirement in terms of collection and delivery time windows needs to be collected. With this input, various configurations can be simulated and different scenarios compared. In the final step, additional economic issues need to carefully be assessed to verify the specific possibility/feasibility to implement the solutions proposed by the model. Consequently, the model can be helpful to define the best distribution scheme from a logistics perspective to provide the basis for a complete analysis of a specific network design case where additional competitive and political parameters are further considered. This enables a holistic overview on SFSCs in the context of producer and restaurant relationships to facilitate real-world implementation and promote local food.
The presented results, which highlight the benefits of coordinated logistics activities, are in line with various related studies on horizontal cooperation in logistics which show similar benefits of combined collection or delivery tours (Cruijssen et al., 2007). Within SFSCs, however, such coordinated activities are often challenging to achieve due to limited logistics knowledge and lack of resources of the involved actors (Paciarotti and Torregiani, 2021), showing the need for additional policy support to establish local food hubs and promote the consumption of regional food at restaurants. If successful, this further allows one to follow environmental sustainability goals by reducing travel distances, lower food losses, support the use of vehicles with low environmental impact as well as the adoption of eco-friendly packaging systems and the use of ecological reusable containers for goods transportation. Therefore, policymakers can use the results of the paper to promote the creation of the food hubs as it highlights the benefits of such joint collection and distribution strategies for SFSCs connecting producers and restaurants. From a managerial perspective, results highlight the importance of closely monitoring the ratio of producers to restaurateurs in the system as well as of the specific hub location and number of available vehicles. Particularly, the shown trade-off between time and distance is crucial to both reduce travel distances and provide high service quality. Therefore, communication is a key success factor. Farmers need to increase the information flow and interactions with restaurants, which requires significant effort in terms of time and communication skills (Roy et al., 2019). Additionally, a focus needs to be put on building trust among the actors in the system to enable a long-term success of the coordinated logistics activities (Serrano-Hernandez et al., 2018).
Nevertheless, various limitations need to be considered when analyzing the results in detail. For generality, the experiments focused on computer-generated randomized spatial networks rather than real-world ones. Specific regional implementations of food hubs highly depend on both the legal and competitive environment the SFSCs operate in. Similarly, the real-world road network can be of high importance. For instance, bottlenecks such as bridges or mountain ranges can result in long detours, greatly impacting travel distance in either of the scenarios. Additionally, real-world SFSCs are highly dynamic environments subject to a wide range of cause-effect relationships and changes over time, complicated the maintenance of related systems (Kump and Fikar, 2021). This further indicates that how beneficial each scenario is may change frequently in real-world systems based on the market entry/exist of producers and restaurants as well as on the available logistics infrastructure.
5. Conclusions
This paper is part of the research strand on SFSCs and, in particular, it explores the implementation of hybrid food hubs, also known as local food hubs, from a logistics perspective. Hybrid food hubs embed physical and operational elements of conventional food systems as logistical expertise, IT management system, and vehicle fleet management. The structure allows them to incorporate many of the advantages of both alternative and conventional systems (Manikas et al., 2019).
The use of local food hubs to connect producers and restaurateurs has not only the potential benefit of increasing local food consumption, but it also further allows one to provide a coordinated and optimized food distribution system. By using the simulation framework developed in this work, such impacts can be quantified. Furthermore, the identification of key logistics success factors for SFSCs connecting producers and restaurants is supported. As results of computational experiments show, this can contribute to substantially reducing delivery distances, which directly decreases costs and related negative externalities of road transportation such as air pollution and accidents. Findings further support the implementations of future SFSCs as they can be used to build trust as well as to explain and demonstrate to policy-makers the importance and the positive impact of supporting SFSCs. The analysis further demonstrates advantages of having a simulation tool available to study different configurations and varying distribution strategies. This enables food hub operators to evaluate different settings in a flexible and risk-free manner and derive promising configurations.
Future work focuses on expanding the analysis by considering additional influencing factors and special characteristics of SFSCs. This includes the investigation of real-world cases to compare different settings based on regional requirements and specific local regulations. From a logistics perspective, the consideration of different food types with their specific storage and handling requirements, e.g. frozen, cooled and fresh products, is of interest. Similarly, expanding the time-horizon of the study is a promising research direction to integrate additional features of SFSCs such as seasonality in the decision support model.
