
This study investigated sickness absence trends and economic outcomes of a multiyear comprehensive workplace health promotion (WHP) program.
The nine-year WHP program was implemented emphasizing lifestyle behaviours as key targets in 2010–2013, whereas the latter half focused on stress management and mental health resources in 2014–2018. Sickness absence data was collected from the employer’s HR system from 2009 to 2019. The investment and employer costs data were collected from the service provider's and employer's data basis. Economic impact was estimated for the actual nine-year program period by comparing implementation costs to estimated savings from sickness absences only.
Sickness absence rate reduced by 38 percent from 2009 to 2019. The average investment was 331 EUR in the program per employee per year. Altogether, the employer invested 1.65 MEUR in the intervention and gained sickness absence savings of approximately 0.78 MEUR.
This study found a moderate decrease in sickness absence data and a positive curve of financial outcomes in a long-term analysis. Estimated program savings, limited to sickness absence benefits only, were not sufficient to cover the employer's costs of the program. Future research should explore other potential long-term savings beyond sickness absence.
Background
Sick leaves, sickness absences and absenteeism all describe the same phenomena – the employee's time away from work because of illness, injury or insufficient work ability, which are accepted by the employer and legislation as realities of employment (Whitaker, 2001; Higgins et al., 2012).
According to Organisation for Economic Co-operation and Development (OECD)'s statistics, the prevalence of the average absence rates due to illness were 3.8 days per year in the USA, 4.7 in the UK, 6.7 in Sweden, 9.1 in Finland and 15.9 in Germany in 2010 (OECD, 2024). All these countries have different kinds of policies for controlling, reporting and compensating absenteeism. Furthermore, the reasons behind absenteeism are multidimensional. Health status of the individual, the quality of work tasks, salary level, the health care policies, delays in accessing medical treatment and work ability management models of an organization affect both the prevalence and costs of absenteeism (Higgins et al., 2012; Aldana and Pronk, 2001).
Sickness absences tend to vary between occupational classes and sexes. According to a Finnish panel data study 2005–2013, absenteeism rates were highest in the health and social work sector and in the manufacturing sector (Leinonen et al., 2018). Lowest rates were found among white-collar workers in all disease groups such as musculoskeletal, mental, circulatory and respiratory diseases (Leinonen et al., 2018). In Finland, men tend to have more absences than women, and the most common reasons for sick leaves have been musculoskeletal diseases and mental disorders (OECD, 2024; Kuoppala et al., 2008; Blomgren and Jäppinen, 2021).
Sickness absence rate is a common human resource parameter for employers, and it has been widely used for evaluating the effectiveness of worksite health promotion (WHP) interventions, because it has a direct connection to a corporation's expenses and productivity (Baicker et al., 2010; Chapman, 2012; Strömberg et al., 2017).
A strategic decision to invest in corporate well-being often involves the issue of resources and expectations of positive return on investment (ROI) (Goetzel et al., 2014). And there is an evidence base for ROI expectations. From earlier reviews, meta-analyses and observational studies, we know that interventions can produce positive financial outcomes via reducing sick leaves and health care costs and managing health risks and disability (Baicker et al., 2010; Chapman, 2012; Proper and van Mechelen, 2008; Santos and Miragaia, 2022), but not all WHP interventions are successful in producing positive financial outcomes (Pelletier, 2011; Song and Baicker, 2019; Mattke et al., 2013; Osilla et al., 2012; Lutz et al., 2019).
The previous WHP literature has provided ROI results mostly from 1–4 years of follow-up. Longer-term observations are rare. This study investigates sickness absence trends and estimates the associated financial outcomes of a multiyear tailored WHP program executed in Finland from 2010 to 2018. This study builds on three previously published articles that have extensively described the planning (Äikäs et al., 2017) and implementation phases (Äikäs et al., 2019) and analyzed employee-level health risk changes (Äikäs et al., 2020). The planning phase of the intervention was largely in line with recommendations from the literature (Pronk, 2014), with the exception of engagement of middle management, collaboration with occupational health care providers and anticipation of a multi-year implementation already at the planning stage (Äikäs et al., 2017). The implementation phase analysis revealed that approximately 80% of the 161 planned services were executed as intended, 67% of the personnel made a lifestyle change and the overall health impact of the full program was considered to be moderate based on the PIPE (Penetration, Implementation, Participation, Effectiveness) Impact Metric Model (Pronk, 2003) calculations (Äikäs et al., 2019). The evaluation of health risk showed that the program was effective in maintaining low and moderate risk levels but fell short of reducing the total number of health risks (Äikäs et al., 2020). Additionally, the prevalence of measured health risks was lower than in an average working-age population (Äikäs et al., 2020; Loeppke et al., 2010). The present study complements previous studies in order to evaluate employer-level effectiveness with longer-term observations on absenteeism trends and financial outcomes.
Methods
Study design
This case study focuses on sickness absence trends and associated financial outcomes of a comprehensive WHP program executed in a single company using a prospective longitudinal quasi-experimental cohort study design without a control group (Creswell and Plano Clark, 2011; Ovretveit, 2014; de Vocht et al., 2021). Interrupted time-series analysis was used to assess changes in trends and outcomes, following best practices outlined by James Lopez Bernal et al. (2017). Similar financial outcomes analysis has been used in a multi-year effectiveness study of a utility company from 1999 to 2007 (Yen et al., 2006, 2010). To ensure accurate and transparent reporting of financial impacts, the Consolidated Health Economic Evaluation Reporting Standards (CHEERS) were applied (Husereau et al., 2022), see Appendix.
Intervention
A comprehensive WHP program was delivered over a nine-year period from 2010 to 2018 in a Finnish wood supply company. The organization's focus was to buy, harvest and transport wood for the company's mills throughout the nation. The employer had altogether over 100 business units nationwide and over six hundred employees, which were the participants of the program. The program was a tailored version of a comprehensive WHP concept designed and produced by the provider of the program, 4event Ltd, nowadays Freia Ltd. The content, design and implementation process of the total program can be found in earlier studies (Äikäs et al., 2017, 2019) and a summary of the program is presented in Table 1.
Intervention characteristics
| N | 523–651 |
|---|---|
| Length | 9 years, from 2010 to 2018 |
| Main focus of program | 2010–2013 Supporting lifestyle change |
| 2014–2018 Reducing stress, enhancing workplace climate | |
| Total No Services | 85 different services from 2010 to 2018 |
| Classification | Comprehensive WHP Program |
| Main components |
|
Participants
All personnel of the wood supply company were the target group of the intervention. Most employees were white-collar workers, i.e. executives, local forest officers, organization officials and a smaller proportion were blue-collar workers, i.e. lumberjacks and terminal workers.
Data collection
The sickness absence data were collected from the employer's records by the corporate human resources department. The time period was from 2009 to 2019, which included the nine-year intervention time and a one-year follow-up period. The data consisted of sick leaves, which were accepted by the employer and related salary costs for the employer. The data was limited to full-time workers, as the organization's use of part-time labour was minimal and seasonal in nature, which did not allow for regular participation in the WHP program.
The investments of the program included the service providers' design and implementation costs from 2010 to 2018. The direct and indirect costs of the program were collected from the service provider's financial management system. The direct costs included the following items: health risks assessments tours in 2010–2011, 2013–2014 and 2016–2017, targeted wellness and coaching services, workability days for the whole staff, education sessions for playmakers, communication, planning and management costs. The indirect costs include travel expenses, premises and catering. Data for each year was collected separately and summarized as a total annual cost of the program in euros and without Value Added Tax (VAT). The investment data excluded the employer's own wellness events such as golf or skiing competitions, subcontractor events and safe driving courses, etc.
The sickness absence data was used to estimate financial savings for the sick leaves paid by the employer. However, because this research did not have permission to use the actual salaries of employees, financial estimates of sickness absence savings were based on benchmark data of the private sector of working-age people in Finland from 2009 to 2018 (Statistics Finland, 2024).
Ethical issues
This study followed the ethical principles of the University of Jyväskylä and the research guidelines provided by the National Advisory Board on Research Ethics in Finland (University of Jyväskylä, 2016). The service provider and the employer were provided informed consent for this research. Participation in this research, as well as giving authorization to use the databases, were entirely voluntary. Neither the employer nor the service provider had any role in the design, conduct, or reporting of the study.
Data analysis
The human resource department of the employer provided a total sum of absence hours for the full-time workers from 2009 to 2019. The annual total absence hours were divided by average working hours per day and yearly reported head count of the organization to get annual average sickness day rate per employee. Notably, we used 7.75 h as a divisor since half of the personnel had 8 h and the other half had a 7.5 h workday. The calculated rate was comparable with OECD absence from work due to illness statistics and was contrasted against the rates of Finland from 2009 to 2019 in the trend analysis (OECD, 2024; Statistics Finland, 2024). In addition, a linear regression model in Statistical Package for the Social Sciences (SPSS), was conducted to evaluate the sensitivity of the observed sickness absence trends (James Lopez Bernal et al., 2017).
For the economic outcomes analysis, the costs and savings were calculated separately. As stated earlier, the costs associated with the program include two different categories, direct costs and indirect costs, which form the total investment of the program. These sums were reported on an annual basis. In addition, we calculated total costs per person by dividing the annual sum of money spent with the number of employees for that year. This gave a descriptive and comparable average to analyze annual spending of the intervention. For the total continuum, we calculated cumulative program cost starting from 2010 and ending in the last reported year 2018. Similar methods have been used in a similar long-term financial analysis (Yen et al., 2010).
The annual savings were defined as estimated employer's cost reductions in sickness absences from 2010 to 2018. Notably, we used 2009 as a baseline for the analyses. If the costs due to sickness absences were lower than in 2009, it was marked as a savings for the employer. Since exact salary information was not available from the employer, we used average salaries provided by Statistics in Finland. For example, the average monthly salary was 3.108 EUR and the hourly salary 18,28 EUR in the private sector in 2010. Corresponding values were 3.553 EUR/month and 20,4 EUR/hour in 2018 (Statistics Finland, 2024). The costs or savings due to absences were calculated by multiplying the annual total sum of absence hours by the average hourly salary in Finland. Similar simple multiplying analysis has been suggested by Krol and Brouwer (2014) for estimating productivity lost in economic evaluations. For the total continuum, we calculated cumulative program savings starting from year 2010 and ending to year 2018.
The financial outcomes were estimated based on the annual costs and savings starting from 2010 and ending to 2018. In this study the ROI for each year was calculated by the amount of euros of financial outcome divided by the amount of euros spent for that year. Furthermore, the ratio of cumulative ROI was calculated by dividing cumulative financial outcomes by cumulative program costs. We applied a 0% discount rate to both costs and health benefits calculated from sickness absence, due to the exceptionally long follow-up period of our intervention (Husereau et al., 2022). Finally, we calculated ROI ratios for the first four-year period, the last five years period and the whole continuum. All statistical analyses were carried out with the SPSS 28.0 program.
Results
The descriptive statistics of participants of the multiyear WHP program are presented in Table 2. The total number of participants decreased from 675 employees in 2009 to 499 in 2019. The largest drop occurred in 2014, when a statutory labour negotiation took place. The average annual employee turnover was 8.6%. As an overview, most of the descriptive characteristics of the personnel remained relatively similar between the time points. The population was male-dominated, with a mean age of 44–45 years and slightly overweight (based on an average body mass index of 26.7 kg/m2). Notable observed changes over the course of the program included: 1) The proportion of executives increased from 14% to 26%; 2) the number of lumberjacks decreased early on and after the year 2014 they were no longer a part of the organization. In addition, according to the health risk assessment results, the proportion of employees with measured good health status slightly increased from 40% to 51%, while poor health ratings decreased from 31% to 24%.
Participants of the multiyear WHP program and descriptive statistics at three different time points
| year | 2009 | 2010 | 2011 | 2012 | 2013 | 2014 | 2015 | 2016 | 2017 | 2018 | 2019 |
|---|---|---|---|---|---|---|---|---|---|---|---|
| Number of employees | 675 | 651 | 634 | 630 | 625 | 530 | 526 | 523 | 523 | 480 | 499 |
| Annual turnover (%) | NA | 11.0 | 8.2 | 4.1 | 17.0 | 5.1 | 3.6 | 5.5 | 16.6 | 6.3 | NA |
| Descriptives | mean (SD) | mean (SD) | mean (SD) | ||||||||
| Age | 43.8 (11.0) | 45.0 (10.7) | 44.8 (11.1) | ||||||||
| Bmi | 26.9 (4.0) | 26.6 (4.0) | 26.8 (4.1) | ||||||||
| Personnel | % | % | % | ||||||||
| Males | 83 | 82 | 79 | ||||||||
| Executives | 14 | 23 | 26 | ||||||||
| Local forest officers | 47 | 49 | 49 | ||||||||
| Organization officers | 19 | 14 | 13 | ||||||||
| Terminal workers | 12 | 10 | 12 | ||||||||
| Lumberjacks | 6 | 4 | 0 | ||||||||
| NA | 2 | 0 | 0 | ||||||||
| Health status in HRA | % | % | % | ||||||||
| Good | 40 | 47 | 51 | ||||||||
| Moderate | 29 | 29 | 25 | ||||||||
| Poor | 31 | 24 | 24 |
Sick leave trend analysis is presented in Figure 1, together with OECD statistics from Finland as a benchmark. A linear regression analysis of annual absence rates during the WHP indicated a decreasing trend (R2 = 0.618, F = 14.547, p = 0.004). The absence rates of the study's employee subject pool varied from highest 7.3 to lowest 3.5 days per employee from 2009 to 2019. The mean for ten-year follow-up was 5.1 days per employee per year. Employee annual turnover did not affect the sickness absence trends (R2 = 0.18, F = 0.125, p = 0.734). Sickness absence rate jumped in the second year of the WHP program but returned to baseline level, where it remained until after 2014, when the trend started to decrease steadily. When compared to the baseline level in 2009, the sickness absence rate was 38% lower than in 2019.
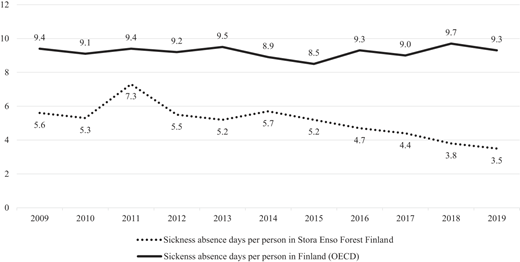
Sickness absence trend analysis among participants and working-age people in Finland from 2009 to 2019
Sickness absence trend analysis among participants and working-age people in Finland from 2009 to 2019
According to the OECD statistics, the average absence days of the Finnish workforce varied between 8,5–9,7 days/per employee per year (mean 9.2 days), from 2009 to 2019 (OECD, 2024). The trend line of Finnish average working-age people is rather stable and clearly higher than the level found in this study.
Direct and indirect costs of the comprehensive WHP program are presented in Figure 2. The total cost of the program was 1.654.425 EUR, including direct and indirect costs. On average, the employer invested 331 EUR in the program per employee per year. However, in this per capita analysis, a wider range of variation was observed due to changes in total money invested and changes in the number of employees. Descriptively, the EUR per person investment from 2010 to 2018 varied as follows: 130, 303, 241, 320, 319, 425, 430, 430 and 383 euros per employee per year, respectively.
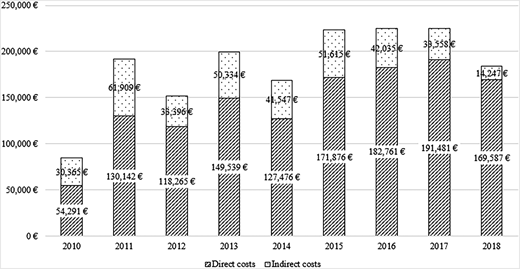
The starting year 2010 had the lowest budget (84.656 EUR) and the highest (225.039 EUR) amount of money was reported in the latter half of the program in 2017. During the nine-year continuum, the employer's average annual investment in the program was 183.825 euros. The mean of direct costs such as health risk assessment and targeted services for employees, was 143.935 EUR, which makes up approximately 78% of total costs. Similarly, the average of indirect costs such as travel expenses and catering, was 39.890 EUR and 22% of the total costs of the program.
Financial investments, including direct and indirect costs and estimated financial returns based on sickness absence savings are presented in Figure 3. In addition, calculations of employers' financial outcomes and annual ROI ratios are presented starting from 2009 and ending in 2018.
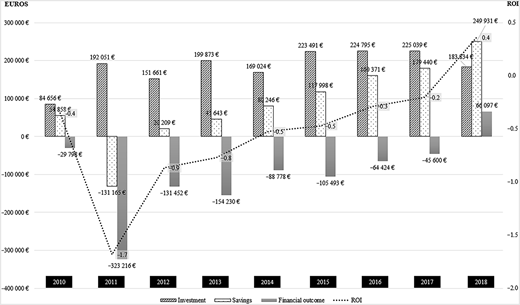
A financial sickness absence return from a nine-year comprehensive WHP program investment
A financial sickness absence return from a nine-year comprehensive WHP program investment
In 2009, the investments and savings were marked as zero. In 2010, the very first year of the WHP program, the costs were 84.656 EUR and savings 54.858 EUR, which led to a −29.798 EUR financial outcome for the employer. In the second year of the program, sickness absence rates were higher than baseline, resulting in 131.165 EUR higher expenses and a net −323.216 EUR financial outcome for the employer. From the year 2012 on, the reported savings tend to increase, even though annual financial outcomes stay negative.
Altogether, the trend of sickness absences is mostly lower than baseline and accumulated annual savings from 20.209 EUR up to 249.931 EUR. However, the savings were not high enough to cover the program costs until the very last year of the program. Likewise, the ratio of financial outcomes remained negative until the year 2018, when the financial benefit was 66.097 EUR positive.
The ROI ratio of the comprehensive multiyear program stayed negative almost all the way, ranging from −1.7 to −0.2. However, it is noteworthy that the savings covered more programs' costs during the last five years, and in the very last year of reporting, the ratio was slightly positive 0.4. The ROI ratio for the first four years was −0.9 and for the last five years −0.2. Altogether, the total investment in the program was 1.654.425 EUR and the total sickness absence savings were 777.529 EUR. As a summation, the final financial outcome for the employer was −876.896 EUR during the nine years. This accumulates a total −0.5 ROI ratio for the invested resources.
Discussion
This case study investigated sickness absence trends and financial outcomes of a comprehensive WHP program in a real-world setting without a control group.
The eleven-year sickness absence analysis showed a trend curve that first increased and then steadily decreased. The average time away from work was 5.1 days per employee. This rate was much lower than the average in Finland at 9.2 days, but a bit higher if compared to OECD statistics in the UK 4.4 or in the US 4.0 days (OECD, 2024). Notably, the trend curves in Finland, the UK and the USA have been stable from 2009 to 2019, whereas our study found statistically significant fluctuations at the organizational level.
The overall sickness absence rate was 38% lower at the endline than at baseline. Earlier studies have indicated health promotion programs to have a weak or modest impact on absences (Kuoppala et al., 2008; Baicker et al., 2010; Conn et al., 2009). The effects observed in this study are modest, since the baseline level was already ‘good’ and below the national average. Several explanations may explain the observed improvement. Firstly, based on our earlier study findings (Äikäs et al., 2019, 2020), the health status of the male-dominated population improved and health risk levels stayed low. Secondly, the program provided health-promoting support over multiple years, although the level of investment varied from year to year. Similar positive, moderately declining trends have been observed in a previous multi-year trend study. Byrne et al. (2011) reported a decrease in the proportion of employees absent for more than five days, from 12.6% to 10.5% over a seven-year follow-up period.
An interesting change was that the employees' sick leaves increased in 2011, just after the launch of the preventive intervention. There are no similar study findings to compare, but Nyman et al. (2012) also found lifestyle intervention ineffective to reduce absences at the beginning of the intervention at the University of Minnesota (Nyman et al., 2012). No clear explanatory factor for the increase in a single year was found in the data of this study. However, based on our previous research, the degree of engagement among employees was still weak in the beginning, as in 2011, only 14% of the staff were committed participants, whereas in the following year the figure rose to 38% (Äikäs et al., 2019). It is therefore possible that the spikes in individual years are more likely explained by seasonal or internal organizational factors rather than by elements of the external intervention (Higgins et al., 2012; Aldana and Pronk, 2001; James Lopez Bernal et al., 2017)
The overall economic outcome for the employer was negative despite the fact that the accumulated savings from sickness absence improved the cost-effectiveness of the program. The employer gained net savings mostly from the last five years, but not the first four. Earlier literature has reported both positive return-on-investment ratios (Baicker et al., 2010; Chapman, 2012; Santos and Miragaia, 2022; Yen et al., 2006; Henke et al., 2011) and negative ROI ratios (Song and Baicker, 2019; Caloyeras et al., 2014). This study's ROI ratios stayed mostly negative, varying from −1.7 to +0.4 and the average ROI ratio for the nine-year continuum was −0.5.
The reasons behind the negative ROI of this research were multidimensional. Firstly, this study calculated the economic impact only based on absenteeism. This is a traditional and widely used human resource and employer metric, but gathers data only from one possible saving perspective (Strömberg et al., 2017). Based on previous review studies, it appears that comprehensive WHP interventions tend to report moderately positive financial outcomes in terms of healthcare cost savings (Osilla et al., 2012; Mattke et al., 2013) and absenteeism (Baicker et al., 2010). In addition, the associations with productivity and human capital indicators tend to show small positive effects (Vargas-Martínez et al., 2021; Basińska-Żych and Springer, 2021; Virtanen et al., 2025). In this light and considering the previously published positive results from the same intervention, such as the long-term moderate health impact (Äikäs et al., 2019) and the ability to maintain low and moderate health risk levels (Äikäs et al., 2020), it could be assumed that, additional financial benefits could have been gained from occupational health care costs, productivity, human capital metrics and presenteeism, which might be even more significant than financial effects of absenteeism (Strömberg et al., 2017; Krol and Brouwer, 2014). Unfortunately, these additional perspectives were not available within the protocol of this study due to the employer's challenges in sharing confidential data for open comparison in the highly competitive forestry sector.
Second, the baseline level of sickness absences was already low when launching the intervention. This finding is supported by a previous finding from the same intervention, which showed that the number of health risks in the organization was lower than in the general working-age population (Äikäs et al., 2020). The low amount of health risks has been shown to have an association with low sickness absence rates (O'Donnell, 2017; Loeppke et al., 2010; Edington, 2001). Understandably, this might have contributed to a floor effect when considering aiming to reduce absences and gain financial benefit below the baseline.
Third, and mathematically put, the total program cost of 1.654.425 EUR was too high to be covered with sickness absence savings alone. On average, the investment was 331 euros per employee per year. This is clearly higher than the average annual cost of $144 per lifestyle management program participant reported by a review of Baicker and colleagues in 2010. Relatively high cost per employee might be due to the fact that the study's forest company was very dispersed nationwide (over 100 locations in a geographically large area) and indirect costs such as travel and accommodation expenses could not be avoided during the implementation. Another explanation might be that the organization's population was quite small (N = 650) compared to other studies, companies +1,000 employees (Baicker et al., 2010; Goetzel et al., 2014). For a smaller population, the administrative costs are higher per employee. However, sufficient annual resources should be allocated to sustain the multi-year implementation (Pronk, 2014; Äikäs et al., 2017).
Fourth, the savings calculated from sickness absence are dependent on national and organizational guidelines (Higgins et al., 2012; Aldana and Pronk, 2001). Interestingly, Lutz et al. (2019) found in their review that health promotion programs implemented in Europe showed only small or even negative economic benefits. The formula used in this study to calculate financial savings was simple and straightforward (Krol and Brouwer, 2014), and the results are in line with the findings of Lutz and colleagues (2019) in the European context. Future research should explore whether, for example, achieving cost savings is more feasible on other continents due to local policy frameworks compared to those in Europe.
This study contained the following limitations. The current study lacked a control group, and the results and findings should be considered in a quasi-experimental context (de Vocht et al., 2021; James Lopez Bernal et al., 2017). The financial outcome data consisted of only sickness absence, whereas some benchmark studies have also had other financial metrics to estimate ROI. Another limitation affecting the evaluation of economic impact was the absence of annual salary data. We based our calculations on average hourly wages in the Finnish private sector from 2010 to 2018. In addition, the employer's sickness absence did not contain data at the individual level nor classifications about reasons behind sick leaves. Subgroup analysis would have allowed comparisons between different age groups, genders and staff categories for characterizing heterogeneity according to the CHEERS model (Husereau et al., 2022). The study population consisted of full-time employees, predominantly male and working in white-collar roles. Similar outcomes may not be observed in more gender-diverse, part-time, or lower-wage workforces.
Balanced against the limitations, this study included several major strengths. Notably, its eleven-year sickness absence trend analysis and nine-year financial observation period are unique. Also, this study investigated the sickness absence trends and changes in a real-world context with a long-term research cohort (de Vocht et al., 2021; James Lopez Bernal et al., 2017). Furthermore, the exact investment calculations, direct and indirect costs, were market-based and no financial incentives were used in this intervention to enhance participation or implementation. This makes the whole intervention, health risk assessments and services replicable.
The current study is a unique multiyear observation, providing insights that can deliver valuable information for researchers, health promotion professionals, human resource managers and corporate leaders. Based on the findings of our study, we offer the following recommendations to support the successful design and cost-effective implementation of WHP programs. First, the starting point of the organization largely determines the potential financial benefits that can be expected from a long-term health promotion program. Second, it is unlikely that the development of sickness absences will be consistent year by year. It is advisable to anticipate annual variation already at the planning stage, even if the overall trend could be predicted to go downward. Third, although the intervention studied was sufficiently well-designed and implemented, it would have benefited from a stronger utilization of data-driven dashboards. Predictive analyses regarding how much the program should invest and what kinds of economic benefits could be observed during its implementation would have more strongly connected it with business analytics and course-correction actions.
The current article builds on three articles published previously that describe the outcomes of the same comprehensive WHP program (Äikäs et al., 2017, 2019, 2020). The economic analysis presented here complements the previously published effectiveness evaluation. In the future, changes in the same organization and the personnel beyond 2019 would be of interest. In addition, a robust summary of the findings from the four sub-studies conducted on this same intervention – and its further utilization in WHP planning, impact evaluation and research – would be highly relevant.
Conclusion
In summary, this study found a moderate 38% decrease in sickness absence and a positive curve of financial outcomes in a long-term analysis, but the comprehensive WHP program fell short of producing a positive ROI for the employer, based on sickness absence improvements only. However, our findings agree with earlier literature that a comprehensive WHP program can affect employees' health and costs related to sickness absences, when compared to a situation where no intervention or a brief program is provided.
Appendix Completed Strengthening the Reporting of Observational Studies in Epidemiology (STROBE) checklist for this observational study
CHEERS 2022 checklist
| Topic | No. | Item | Location where the item is reported |
|---|---|---|---|
| Title | 1 | Identify the study as an economic evaluation and specify the interventions being compared | Title page |
| Abstract | 2 | Provide a structured summary that highlights context, key methods, results, and alternative analyses | Page 1 |
| Introduction | |||
| Background and objectives | 3 | Give the context for the study, the study question, and its practical relevance for decision-making in policy or practice | Introduction, pages 1-2 |
| Methods | |||
| Health economic analysis plan | 4 | Indicate whether a health economic analysis plan was developed and where available | CHEERS, Appendix |
| Study population | 5 | Describe characteristics of the study population (such as age range, demographics, socioeconomic or clinical characteristics) | Methods page 3, Results page 5 |
| Setting and location | 6 | Provide relevant contextual information that may influence findings | Methods page 3 |
| Comparators | 7 | Describe the interventions or strategies being compared and why chosen | Methods page 3, Table 1 |
| Perspective | 8 | State the perspective(s) adopted by the study and why chosen | Introduction page 2, Methods page 3 |
| Time horizon | 9 | State the time horizon for the study and why appropriate | Methods page 3 |
| Discount rate | 10 | Report the discount rate(s) and reason chosen | Methods page 5 |
| Selection of outcomes | 11 | Describe what outcomes were used as the measure(s) of benefit(s) and harm(s) | Methods pages 4-5 |
| Measurement of outcomes | 12 | Describe how outcomes used to capture benefit(s) and harm(s) were measured | Methods pages 4-5 |
| Valuation of outcomes | 13 | Describe the population and methods used to measure and value outcomes | Methods pages 3-5 |
| Measurement and valuation of resources and costs | 14 | Describe how costs were valued | Methods pages 4-5 |
| Currency, price date, and conversion | 15 | Report the dates of the estimated resource quantities and unit costs, plus the currency and year of conversion | Methods pages 4-5 |
| Rationale and description of model | 16 | If modelling is used, describe in detail and why used. Report if the model is publicly available and where it can be accessed | Not applicable |
| Analytics and assumptions | 17 | Describe any methods for analyzing or statistically transforming data, any extrapolation methods, and approaches for validating any model used | Methods page 5 |
| Characterizing heterogeneity | 18 | Describe any methods used for estimating how the results of the study vary for subgroups | Not applicable |
| Characterizing distributional effects | 19 | Describe how impacts are distributed across different individuals or adjustments made to reflect priority populations | Introduction page 1, Methods page 3, Table 1 |
| Characterizing uncertainty | 20 | Describe methods to characterize any sources of uncertainty in the analysis | Methods page 4, discussion page 10 |
| Approach to engagement with patients and others affected by the study | 21 | Describe any approaches to engage patients or service recipients, the general public, communities, or stakeholders (such as clinicians or payers) in the design of the study | Methods pages 3-5 |
| Results | |||
| Study parameters | 22 | Report all analytic inputs (such as values, ranges, references), including uncertainty or distributional assumptions | Results pages 5-8 |
| Summary of main results | 23 | Report the mean values for the main categories of costs and outcomes of interest and summarize them in the most appropriate overall measure | Results pages 5-8, Figures 1–3 |
| Effect of uncertainty | 24 | Describe how uncertainty about analytic judgements, inputs, or projections affect findings. Report the effect of the choice of discount rate and time horizon, if applicable | Results pages 5-8, discussion pages 8-10 |
| Effect of engagement with patients and others affected by the study | 25 | Report on any difference in patient/service recipient, general public, community, or stakeholder involvement made to the approach or findings of the study | Not applicable |
| Discussion | |||
| Study findings, limitations, generalizability, and current knowledge | 26 | Report key findings, limitations, ethical or equity considerations not captured, and how these could affect patients, policy, or practice | Discussion pages 8-10 |
| Other relevant information | |||
| Source of funding | 27 | Describe how the study was funded and any role of the funder in the identification, design, conduct, and reporting of the analysis | Title page 1 |
| Conflicts of interest | 28 | Report authors' conflicts of interest according to journal or International Committee of Medical Journal Editors requirements | Conflicts of interest have been reported according to the guidance of the International Journal of Workplace Health Management |
