This study aims to develop an optimization-based framework that improves fairness and efficiency in assigning academic advisors to students. The purpose is to overcome limitations of manual or ad-hoc allocation by balancing advisor workloads, aligning advisor preferences with student majors and risk levels, and ensuring equitable advising capacity. By introducing a goal-programming formulation validated with real-world university data, the research seeks to enhance academic advising quality, reduce inequities in advisor assignments, and contribute to sustainable and data-driven management practices in higher education.
A Mixed-Integer Linear Programming goal-programming model was formulated to minimize deviations in advisor workloads and class distributions while accounting for advisor preferences and student risk categories. The model was implemented in the Advanced Interactive Multidimensional Modeling System (AIMMS) using the CPLEX solver and applied to a real dataset of 2,476 students from a large Middle Eastern engineering college. Results from the optimized assignments were benchmarked against the institution’s baseline manual process by comparing fairness indices, preference alignment, and workload balance to demonstrate the model’s effectiveness and computational efficiency under realistic operational constraints.
The proposed model achieved substantial improvements over existing assignment methods. Workload fairness increased by 96.97%, class-load fairness by 98.09%, and preference-alignment penalties were reduced by 45.71%. Major-advisor pairing efficiency improved by 41.94%, resulting in an overall performance enhancement of 91.75%. These results confirm that integrating goal-programming with empirical advising data can yield fairer and more balanced advisor assignments. The findings demonstrate that data-driven optimization supports better resource utilization, improved advisor satisfaction, and a stronger institutional capacity to deliver equitable academic guidance.
This research is among the first to operationalize goal-programming for optimizing academic advisor assignments using real-world university data. It integrates fairness, workload balancing, and preference alignment within a unified mathematical framework and validates its effectiveness empirically. The study advances the literature by bridging operations-research modeling with higher-education management, offering quantifiable evidence that optimization can improve institutional advising equity. Its methodological and managerial contributions provide a replicable approach for universities seeking data-driven, transparent, and equitable advising systems.
1. Introduction
Academic advising plays a crucial role in higher education, serving as a cornerstone for student success and retention. The process involves assigning academic advisors to students to provide guidance on academic decisions, career planning, and personal development (Young-Jones et al., 2013). Effective advising ensures that students receive the support they need to navigate their academic journey, make informed decisions, and achieve their educational goals (Hawthorne et al., 2022).
However, the assignment of students to advisors is often a complex and challenging task, involving various factors such as advisor workload, student needs, and advisor preferences. Traditionally, this process has been managed manually, leading to potential inefficiencies and inequities. The imbalance in advisor workloads and the misalignment of advisor expertise with student needs can negatively impact the quality of advising, student satisfaction, and overall academic outcomes (Tiroyabone and Strydom, 2021).
Recognizing these challenges, recent studies have explored innovative tools and methodologies to enhance the academic advisory process. These studies have highlighted the importance of leveraging data-driven approaches and optimization techniques to improve the efficiency and effectiveness of advisor assignments (ECAR, 2015). Despite these advancements, there remains a significant gap in research specifically addressing the optimization of student-advisor assignments, particularly in real-world contexts.
This study aims to address this practical problem by applying and adapting established optimization techniques to student-advisor assignments in a real academic advising context. By integrating multiple criteria such as the number of students, their risk levels, advisor preferences, and the distribution of advisors across majors, the model seeks to achieve fairness and enhance the quality of academic advising. The proposed Mixed-Integer Linear Programming (MILP) model is designed to minimize discrepancies in advisor workloads and align assignments with advisor preferences, ultimately aiming to improve student satisfaction and academic outcomes.
Aligning with global sustainability goals, this research is relevant to Quality Education (Sustainable Development Goal 4) by promoting equitable and effective academic advising. Ensuring fair advisor workloads and aligning student needs with advisor expertise can enhance educational outcomes and student retention, supporting the broader aim of inclusive and equitable quality education (Rieckmann et al., 2017).
The research begins with a thorough literature review to contextualize the current study within existing academic advising research. It then outlines the problem description, detailing the complexities and requirements of the student-advisor assignment process. The experimental study design section explains the methodology used to validate the model, including data collection and analysis procedures.
Following this, the results and discussion section presents a detailed comparison between the baseline assignment approach (i.e. the existing manual assignment used by the institution) and the proposed model, highlighting significant improvements in caseload balance, risk- and class-category balance, and advisor-preference alignment. Managerial insights derived from the findings offer practical recommendations for implementing the model in academic institutions. The study concludes by addressing its limitations and suggesting future research directions to further enhance the robustness and applicability of the proposed model.
By adopting a data-driven, optimization-based approach, this research provides a valuable contribution to the field of academic advising, offering a practical framework to optimize advisor assignments and improve the overall quality of the advising process.
2. Literature review
This literature review section examines various studies related to the academic advisory topic. The literature can broadly be categorized into three main themes: improvements in the advisory process itself, the impact of advisor assignments on student outcomes, and specific methodologies for optimizing these assignments. While the bulk of the research focuses on enhancing the advisory process through predictive tools and advising strategies, fewer studies investigate the direct impacts of these assignments, and even fewer investigate the specific optimization of the assignment process. This section will review these studies, highlight gaps in those addressing the optimization challenge, and illustrate the distinctive contributions of the current study.
2.1 Improvements in the advisory process
A significant body of research has focused on enhancing the academic advisory process through a variety of innovative tools and methodologies, although these are not the central theme of the current study. For instance, efforts to improve minority student attraction, retention, and graduation have been explored through novel advisement tools as discussed in studies like Crown et al. (2009), Thomas (2020). Furthermore, the integration of technology in advisement processes is evident in works such as Gurantz et al. (2020), Graham et al. (2023), which showcase how virtual platforms and AI can enhance the advising experience.
Other notable contributions include the application of data-driven techniques to optimize advisement, as seen in the work of Manohar and Hosein (2023) and Zaied et al. (2022). Furthermore, decision-support systems have been developed to streamline advising processes (Almutawah, 2014; Werghi and Kamoun, 2010). These studies illustrate the breadth of approaches to refining the advisory process, from using advanced analytics to crafting detailed, data-informed models that aid in student-advisor matching and performance follow-up, as provided by Li (2016) and (Sabado, 2023).
These studies, while peripheral to the core objective of optimizing advisor assignments, provide a rich context for understanding the complexity of the advisory landscape and the potential of technological and methodological advancements to significantly enhance the effectiveness of academic advisement systems.
2.2 Impact of advisor assignments on student outcomes
Research exploring the impact of advisor assignments on student outcomes has generally shown that the quality and nature of these assignments can significantly influence various aspects of academic and personal development. For example, Jaffé (1990) demonstrated that the effectiveness of advisors can vary widely, impacting first-year academic performance, progression speed in the initial academic year, and overall graduation timelines. Similarly, Albert (2021) explored how matching students with advisors from specific departments can affect academic performance and satisfaction levels. Other research highlighted the critical role of advisors in shaping the educational experiences and career trajectories of students in specialized fields (Marijanović et al., 2021; Myhre et al., 2014). Lastly, the study by Ismail et al. (2021) underscored the importance of reliability and empathy in advising, showing that these factors significantly impact student satisfaction and retention rates. These studies collectively underscore the significant impact of advisor assignments on student outcomes, emphasizing the critical need for optimizing these assignment strategies to enhance educational effectiveness.
2.3 Optimization of student-advisor assignments
Recognizing the critical need for optimized assignment strategies highlighted by these outcomes, a niche yet crucial area of research focuses specifically on the optimization of student-to-advisor assignments. Few studies have been found in this research segment, highlighting the existing research gap.
For instance, a study by Ying et al. (2023) addressed the problem of grouping students and assigning them to academic advisors based on demographic diversity (nationality, race, and gender). The decision variables involve the allocation of students to advisors. The objective is to create groups that are balanced in terms of nationalities, races, and genders, thus improving the advisory process. Main constraints include maintaining a balanced representation of demographics across advisors and equitable distribution of students among advisors. The model is a combinatorial optimization problem solved using a Genetic Algorithm (GA), which iteratively evolves solutions to find an optimal or near-optimal assignment that satisfies the constraints and objectives. The study also evaluates user acceptance of the system using the Unified Theory of Acceptance and Use of Technology (UTAUT) framework, with positive feedback from users.
Another study by Biró and Gyetvai (2023) addressed the efficient matching of students with suitable mentors in an online voluntary mentoring program. The decision variables include the assignment of mentors to students based on their profiles and preferences. The objective is to maximize overall satisfaction and effectiveness of the mentoring process. Constraints include ensuring each mentor is paired with an appropriate number of students and considering the preferences and compatibility of both mentors and students. The model is a Mixed-Integer Linear Programming (MILP) problem that includes forming pairs and groups of students with mentors, considering various constraints like mentor capacity and student preferences. The solving method involves Gurobi Optimizer and computational simulations to evaluate the performance under different parameter settings.
Overall, these studies demonstrate that established optimization methods have been successfully applied to related educational allocation problems. The present study builds on these ideas, but adapts them to the operational realities of academic advising, where student risk, academic stage, advisor preferences, and major concentration all affect assignment quality.
2.4 Gap and aim of this work
The literature review highlights several gaps in the research on student-advisor assignment. Most studies concentrate on improving the advisory process through tools and methodologies, such as data mining and AI, without optimizing the initial assignment of students to advisors. Furthermore, many studies focus on the impact of advisor assignments on student outcomes, such as satisfaction, GPA, and graduation rates, but do not address the optimization of the assignment process itself. Thesis studies emphasize the importance of effective advisor assignments but lack methods for achieving optimal assignments.
Although related allocation and optimization problems have been studied in education and operations research, fewer studies have examined the student-advisor assignment problem in academic advising contexts while jointly considering advising-relevant criteria such as caseload balance, student characteristics, advisor preferences, and major dispersion. While these studies contribute valuable methodologies within their specific contexts, they fall short of addressing the full complexity of academic advising. Specifically, they overlook crucial aspects related to fairness and efficiency in student-advisor assignment, including caseload balance across advisors, student majors, advisor preferences, and a broader range of student characteristics.
Although much of the advising literature implicitly treats fairness as an equal distribution of advisees across advisors, this interpretation captures only one dimension of equity. Caseload size alone does not reflect the actual workload associated with advising, as students differ substantially in the level of time, expertise, and support they require. Prior work shows that advising students with higher academic risk, greater seniority, or complex degree pathways demands more intensive advising effort than advising lower-risk or early-stage students, even when caseload sizes are identical (Middle Tennessee State University, 2024; NACADA, 2023).
Moreover, advisor workload is influenced by the alignment between assigned students and advisor expertise or program preference. Assigning students outside an advisor’s disciplinary background or preferred advising domain can increase advising effort and reduce efficiency compared to assignments aligned with advisor experience (Catherine Shaw et al., 2023). Consequently, balancing the number of students per advisor, while important for transparency and collegial trust, is insufficient on its own to ensure equitable workload distribution. Equal caseload sizes do not necessarily imply equal workload, particularly when student risk levels, seniority, and program alignment vary across advisors (Seyl, 2025).
Therefore, this study does not define fairness solely by caseload size, but rather as workload balance across advisors based on advisor preferences and student characteristics. To address these gaps, this study proposes a comprehensive optimization model using goal programming. This approach enables the simultaneous optimization of multiple objectives, including caseload balance and workload equity, while incorporating advisor preferences and diverse student characteristics. Importantly, the goal programming framework is flexible, allowing additional fairness dimensions or efficiency-related performance measures to be incorporated as institutional priorities evolve. This approach provides a holistic and adaptable solution that enhances both the effectiveness and equity of the student-advisor assignment process across different educational settings. Methodologically, this study applies established mixed-integer and goal-programming methods to an academic advising setting, with emphasis on practical adaptation.
3. Problem description
In academic institutions, the assignment of students to academic advisors is a critical administrative task that ensures students receive proper guidance and support throughout their academic journey. This process needs to balance the workload among advisors, consider the preferences of both students and advisors, and ensure that students are matched with advisors who can best support their academic and professional development. Effective student-advisor assignment can enhance student satisfaction, improve academic outcomes, and optimize the use of institutional resources.
This paper studies the student-advisor assignment problem, which addresses the need to assign a set of students, , to a set of academic advisors, , in a manner that is fair, balanced, and aligns with advisors’ preferences for certain majors, . Each student is characterized by a set of binary features, , which indicate the student’s risk level. High at-risk students are those on Final Probation, Probation, or AW(0–18) with a Blackboard Test. Medium at-risk students are those classified as AWExceeding or AWFX2R3 without a Blackboard Test. The remaining students are categorized as either low at-risk or no risk.
The goal is to develop a mathematical model that assigns students to advisors while minimizing discrepancies in advisor workloads and considering advisor preferences. This assignment must adhere to several constraints to ensure feasibility and fairness, including unique student-advisor assignments, limiting the number of advisors per major, balancing the advisor loads in terms of student numbers and characteristics, and considering advisor preferences for specific majors.
In addressing this problem, we adopt several key assumptions. First, each student is affiliated with only one major and possesses binary characteristics that signify specific needs or attributes. Second, advisors have ranked preferences for guiding students from particular majors, which we assume will influence the assignment process. Third, each student is uniquely assigned to one advisor only, and no student’s major is represented by more than a specified number of advisors. Fourth, we assume that the advisor’s workload must be balanced, taking into account both the total number of students and the diversity of their characteristics to promote fairness and efficiency.
The problem is formulated as a Mixed-Integer Linear Programming (MILP) model, based on the notations outlined in Table 1. Before presenting the mathematical formulation, it is helpful to summarize the practical meaning of the model. The model decides which advisor should be assigned to each student while balancing several institutional goals at the same time. These goals include keeping advisor caseloads balanced, distributing students with different levels of advising need more equitably, aligning students with advisors who prefer or are better suited to advise their majors, and limiting the number of distinct majors handled by each advisor. In this way, the formulation translates a practical advising decision into a structured optimization problem.
Minimize
Subject to:
The objective function (1) aims to improve both workload fairness and advising efficiency through four components. The first component, (1.1) caseload deviation, minimizes differences in the total number of students assigned to each advisor relative to the average caseload. The second component, (1.2) risk- and class-category load deviation, minimizes differences in the distribution of students across advising-related categories, including both academic stage and risk-related categories. The third component, (1.3) advisor-preference mismatch penalty, penalizes assignments that do not align with advisor preferences for specific majors. The fourth component, (1.4) distinct majors per advisor, reduces the number of different majors handled by each advisor, thereby encouraging more focused advising assignments. Together, these four components operationalize the study’s objectives of fairness and advising effectiveness.
The unique assignment constraint (2) ensures that each student is assigned to exactly one advisor, maintaining the integrity of the assignment process. The connection between and in constraints (3) and (4) establishes the relationship between student-major and major-advisor assignments. They ensure that a major is assigned to an advisor if at least one student of that major is assigned to the advisor and vice versa.
The load balancing constraints (5) and (6) ensure that the total number of students assigned to each advisor and the number of students with specific characteristics are balanced across all advisors. The deviation variables are used to measure and minimize the differences from the average loads. It is important to note that the workload parameters take into account the individual capacity of each advisor, particularly considering the coordinator role. This aligns with real-world practices, where typically one of the advisors also manages administrative duties. After evaluating the workload from these additional commitments, the remaining capacity of the advisor coordinator is dedicated to student advising. Consequently, the fair workload distribution among the other advisors is calculated by subtracting the capacity of the advisor coordinator from the total number of students and then dividing the result by the number of remaining advisors.
In practical terms, workload is not represented by a single variable in the model. Instead, it is approximated through two complementary dimensions: the total number of assigned students and the composition of those students in terms of advising-related categories. This distinction is important because two advisors may have the same number of students but still face different advising demands if the characteristics of those students differ.
4. Experimental study design
The primary objective of this experimental study is to evaluate whether the proposed student-advisor assignment model improves assignment quality relative to the baseline manual assignment approach. More specifically, the study examines whether the model can: (1) distribute students more evenly across advisors in terms of both total caseload and advising-related student categories, (2) better align assignments with advisor preferences for majors, and (3) reduce the number of distinct majors handled by each advisor. These outcomes are expected to improve the practical fairness and focus of the advising process and, indirectly, to support better advising quality.
The subsequent subsections will detail the methodology followed to achieve these objectives, describe the data collection processes, and discuss the evaluation of the results.
4.1 Methodology
The experiments were conducted as a computational experimental study using real-world data from a typical university advisor assignment problem. The proposed model was not deployed in live practice during the study period; rather, its efficacy was evaluated by benchmarking the optimized assignment against a baseline solution that reflected the traditional manual advisor-student pairing approach.
To facilitate interpretation of the results, the components of objective function (1), previously introduced in the problem formulation (Section 3), were also used as evaluation measures for comparing the baseline and optimized assignments. Specifically, the comparison was based on four objective components. (1.1) Caseload deviation measures how far each advisor’s total assigned student load deviates from the average caseload. (1.2) Risk- and class-category load deviation measures how far the distribution of students by risk and academic class categories assigned to each advisor deviates from the average distribution across advisors. (1.3) Advisor-preference mismatch penalty captures the extent to which students are assigned to advisors whose major preferences are less aligned with those students’ majors. (1.4) Distinct majors per advisor measures the number of distinct majors assigned to each advisor. Since this term counts all major-advisor pairings in the solution, lower values indicate less dispersion of majors across advisors and more focused advising assignments. These four components provide a consistent basis for evaluating both the manual baseline assignment and the optimized assignment produced by the proposed model.
Using the same four components in both the optimization model and the evaluation stage allows the study to compare the two assignment approaches on a common basis. However, the purpose differs across stages: in the formulation, the components define what the model seeks to improve, whereas in the experimental comparison, they serve as interpretable performance measures for assessing how much improvement is achieved relative to the baseline assignment.
The model was implemented in Advanced Interactive Multidimensional Modeling System (AIMMS) 24.5.5.4 Academic Version License and executed on an HP Pavilion laptop equipped with an AMD Ryzen 5 5600H processor running at 3.30 GHz, 32.0 GB (31.3 GB usable) RAM, and a 64-bit operating system. It was solved using the CPLEX (IBM ILOG CPLEX Optimizer) 22.1 solver, with a computational solving time limit set to 4 h. The optimality gap (i.e. the difference between the best-found solution and the theoretical optimal solution) was also reported. This time limit was determined in consultation with the partner university and was considered suitable for evaluating different assignment options within a practical decision-support setting. This time limit refers only to the computation time allowed for the optimization solver and does not indicate real-world implementation duration. The objective function was calculated in Excel to validate the correctness of the objective function modeling in AIMMS. The same Excel sheet was used to simulate the values of objective functions using the baseline solution.
4.2 Data collection
Data were collected from the Academic Advising Office of a large College of Engineering in the Middle East. The dataset encompasses all existing students at different levels, totaling 2,476 students, along with their majors, risk classes, and currently assigned advisors. It also includes information on the number of available advisors, along with their preferences for specific majors. Tables 2 and 3 summarize these data.
5. Results and discussion
This section presents and discusses the results of the conducted experimental study. It begins with a basic verification of the model’s correctness, followed by a comparison of the results against baseline assignments. Based on these findings, managerial recommendations are discussed, and strategies for improvement are proposed to enhance the efficiency and effectiveness of the student-advisor assignment process.
5.1 Model verification
To ensure the accurate implementation of the model in AIMMS software, the values of the four objective components and the overall objective function were manually recalculated in Excel based on the solution returned by the CPLEX solver. Thus, Table 4 is intended to verify the correctness of the model implementation rather than to evaluate performance against the baseline. As illustrated in Table 4, the manually calculated values aligned perfectly with those obtained from AIMMS/CPLEX, confirming that the model was coded correctly. In addition, all constraints were verified to be fully satisfied.
5.2 Comparison with the baseline assignment approach
This section compares the proposed model with the baseline assignment approach using the same four objective components introduced earlier: (1.1) caseload deviation, (1.2) risk- and class-category load deviation, (1.3) advisor-preference mismatch penalty, and (1.4) distinct majors per advisor. Unlike Table 4, which focuses on model verification, Table 5 evaluates the comparative performance of the optimized solution in the computational experiment relative to the baseline assignment. The aim is to show whether the proposed model produces more balanced, better aligned, and more focused advisor assignments under the study dataset and experimental conditions.
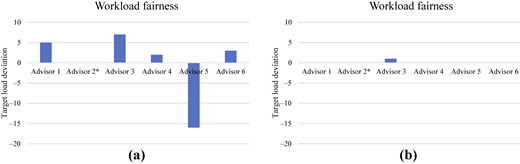
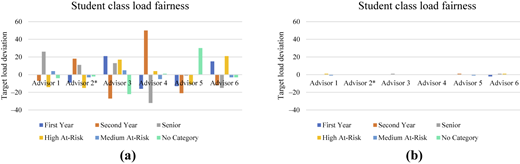
Table 5 quantitatively summarizes the differences between the baseline approach and the proposed model across the four objective components, where lower values indicate better performance. The Gap% column shows the percentage improvement achieved by the proposed model relative to the baseline. For example, (1.1) caseload deviation decreased by 96.97%, indicating a substantially more balanced distribution of students across advisors. Similarly, (1.2) risk- and class-category load deviation decreased by 98.09%, showing that the optimized solution distributes different student categories more evenly across advisors. In addition, (1.3) advisor-preference mismatch penalty and (1.4) distinct majors per advisor also improved substantially, indicating better alignment with advisor preferences and more focused advising assignments. These results represent improvements in assignment decision quality within the experimental setting, rather than directly observed real-time effects on advisor experience or student outcomes.
From a practical perspective, the results in Table 5 suggest that the optimized assignment does not improve only one aspect of the advising system. Instead, it improves multiple dimensions simultaneously: it reduces visible imbalance in advisor caseloads, reduces hidden imbalance in the types of students assigned to each advisor, improves the match between advisor preferences and assigned majors, and limits the number of different majors each advisor must handle. This multi-dimensional improvement is important because fairness and advising quality cannot be captured by student headcount alone. At the same time, these findings should be interpreted within the scope of the study, as they are based on one institutional dataset and one baseline assignment approach.
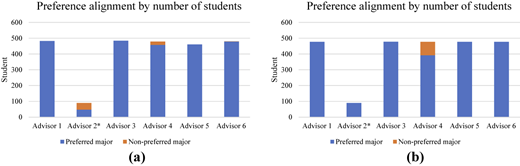
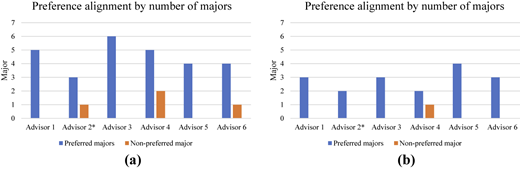
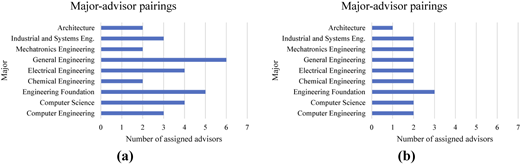
Figures 1–5 provide a detailed visual comparison of the baseline and proposed models, revealing significant insights. The stark contrasts in fairness are vividly depicted in Figures 1 and 2, which clearly showcase the reduced variability in the proposed model.
In Figures 3 and 4, the alignment of student assignments with advisor preferences is illustrated, emphasizing improvements in both student numbers and the range of majors. As discussed in the problem formulation, the advisor with coordinator roles has a reduced capacity compared to others due to additional administrative and management commitments. Consequently, this appears in the results as a lower caseload for this advisor because their fair load is calculated separately. This distinction ensures that the caseload distribution remains equitable while acknowledging the unique responsibilities of the coordinator role.
Finally, Figure 5 highlights the strategic optimization in the number of majors assigned to each advisor. This targeted approach promotes a depth of expertise over breadth, ensuring that advisors develop deeper knowledge and skills in fewer fields. By concentrating on specific areas, advisors can offer more specialized guidance, enhancing the overall quality of the advising process.
The detailed statistical data provided in Appendix A supports the findings discussed above. It includes a deeper analysis of deviation metrics such as the minimum, maximum, mean (μ), standard deviation (σ), and the 95% confidence interval for the half-width (CI HW) for various parameters. These metrics further validate the model’s performance by demonstrating reduced variability and improved consistency in advisor assignments. For instance, the mean and standard deviation figures for caseload fairness and class load fairness from Tables A1 and A2 reveal a more consistent application of the model criteria compared to the baseline, which is depicted by narrower confidence intervals in the proposed model.
6. Managerial insights
The findings from the implemented experimental study underscore the importance of adopting a data-driven, optimization-based approach to student-advisor assignments. This section outlines the practical implications for academic institutions and provides strategic recommendations for enhancing the efficiency and effectiveness of the advising process.
6.1 Implications
The proposed model significantly improves workload fairness among advisors, reducing discrepancies and ensuring a more equitable distribution of students. This can lead to better advisor morale and increased efficiency in advising sessions. A more balanced workload allows advisors to dedicate sufficient time and resources to each student, ultimately enhancing the overall quality of the advising process (Menke et al., 2020).
In addition, by incorporating advisor preferences for certain majors, the model ensures that advisors are paired with students whose academic interests align with their expertise. This alignment enhances the quality of guidance provided, leading to improved academic outcomes and student satisfaction. Such strategic pairing not only benefits students but also leverages the advisors’ strengths effectively (Hart-Baldridge, 2020).
Moreover, the model’s ability to limit the number of advisors handling each major helps prevent advisor overload, ensuring that advisors can manage their caseloads more effectively and provide high-quality support to each student. This targeted approach promotes a depth of expertise over breadth, ensuring that advisors develop deeper knowledge and skills in fewer fields (Ying et al., 2023).
6.2 Recommendations
To maximize these benefits, institutions should integrate the proposed MILP model into their academic advising systems. This integration could involve training staff on the use of AIMMS or similar optimization software to facilitate the assignment process. Regular use of these tools can help maintain an optimal balance of advisor workloads and student assignments.
In practice, the model can be used as a decision-support tool for periodic assignment planning, based on the information available at the time of decision making. This makes it suitable for several practical applications in academic advising. For example, institutions may use the model to assign newly admitted students without changing previously assigned students by fixing the existing decision variable values before reoptimization. Similarly, the model can be applied to rebalance workloads when significant imbalances arise or to adjust assignments when major structural changes occur, such as changes in student programs or advisor availability. These implementation options allow institutions to benefit from the model while preserving continuity in existing advising relationships.
Furthermore, continuously collecting and analyzing data on student demographics, advisor preferences, and advising outcomes is crucial for refining the model. This ongoing data collection ensures that the system remains responsive to changing needs and continues to provide optimal assignments. It also helps identify trends and areas for improvement, making the advising process more dynamic and effective (Biró and Gyetvai, 2023).
Institutions should also consider adjusting their policies to support the implementation of the optimization model. This may include revising advisor evaluation metrics to account for the improved workload balance and student-advisor alignment achieved through the model. Such policy adjustments can ensure that the new strategies are embedded in the institution’s operational framework (Elomri et al., 2015).
Finally, fostering a culture of continuous improvement by regularly reviewing the effectiveness of the assignment process and making necessary adjustments based on feedback from advisors and students is essential. Continuous improvement practices ensure that the advising system evolves with the changing educational landscape and remains effective in meeting the needs of both students and advisors.
7. Limitations
Despite the promising results, this study has several limitations that need to be addressed in future research to enhance the robustness and applicability of the proposed student-advisor assignment model.
One significant limitation of the model is that it does not consider the individual characteristics and historical performance of advisors. Incorporating metrics such as advisor performance, experience, and specialization could provide a more nuanced and effective matching process that better aligns with diverse student needs. Also, the model currently focuses solely on the assignment process without evaluating the long-term impact on overall student outcomes. Future models should incorporate mechanisms to track and optimize student performance over time based on advisor assignments.
Furthermore, the model does not optimize the total number of advisors needed based on actual demand and capacity. Including variables for advisor availability, required advising time, and capacity constraints could lead to a more efficient allocation of advising resources. The assumption that all students are unassigned at the beginning of the assignment process is also a limitation. In reality, students may prefer to continue with their current advisors from previous years. Therefore, models should account for ongoing advising relationships and focus primarily on assigning new students.
Relatedly, the current study focuses on the static assignment problem under limited future visibility. Although the model can be applied in reoptimization settings by fixing selected decision variables to preserve existing assignments, it does not explicitly model dynamic reassignment over multiple periods or continuity constraints across years. As a result, the current formulation does not fully capture sequential decision making in environments where student needs, majors, and advisor preferences may evolve over time.
Moreover, the experimental study was conducted in a single academic advising center within one college, which limits the generalizability of the findings. Broader studies encompassing multiple colleges or universities are necessary to validate the model’s applicability across different educational contexts. Additionally, the study was conducted under a limited computational solving horizon and a limited set of experimental scenarios based on real data, and did not explore various student combinations, such as different majors and risk classes. Future research should include more extensive testing periods and diverse student cohorts to ensure the model’s robustness.
8. Future research directions
To overcome the limitations identified in this study, future research should focus on integrating advisor characteristics and historical performance data into the assignment model. This enhancement will facilitate a more personalized matching process, improving both advisor and student satisfaction. As well, models should be developed to assess and optimize the long-term impact of advisor assignments on student outcomes, providing a more comprehensive approach to academic advising.
Future research should also incorporate qualitative feedback from advisors and students to assess perceived fairness, satisfaction, continuity of advising, and the practical usability of the proposed assignment framework.
Incorporating capacity optimization to determine the ideal number of advisors required based on actual demand will further improve resource allocation. Moreover, accounting for ongoing advising relationships by considering students who wish to continue with their current advisors will make the model more realistic and practical. This can be achieved by extending the current formulation to support partial reoptimization, where existing advisor-student assignments are fixed and only selected assignments, such as those of newly admitted students, remain decision variables. Such extensions would help preserve continuity of advising while still enabling optimization when needed.
Future research should explore advanced modeling techniques, such as stochastic optimization, to handle uncertainty in student-advisor assignments. In particular, dynamic, sequential, and stochastic assignment models represent natural extensions of the current work. These approaches would allow assignment decisions to account for evolving information over time; however, they require uncertainty information about future parameters, such as newly admitted students in subsequent years, possible changes in student majors or needs, and changes in advisor availability or preferences, which are difficult to obtain in practice and involves substantially more complex prediction and modeling. In addition, introducing more Key Performance Indicators (KPIs), such as advisor satisfaction, student retention rates, and graduation timelines, will provide a more holistic evaluation of the advising process. Additionally, improving the model’s solving time by using better formulations or heuristic approaches can make it more practical for real-time applications.
Expanding experimental studies to include multiple scenarios and different student compositions will provide more robust validation of the model. Longitudinal studies over extended periods will help understand the continuity of care and its impact on student outcomes. Comparing the performance of different solvers can also identify the most efficient computational strategies for implementing the model.
Innovative future research could focus on data-driven optimization techniques that continuously adjust advisor assignments based on real-time data throughout the semester. This approach could help optimize student outcomes and address issues proactively. In addition, exploring the potential of machine learning algorithms to predict advising needs and outcomes can provide valuable insights and enhance the decision-making process. Integrating these advanced techniques will push the boundaries of academic advising and contribute to more effective educational strategies.
A further extension would be to incorporate simulation-based approaches to model advisor and student behaviors and preferences. Such simulations can complement the proposed optimization model by evaluating its performance under dynamic and uncertain behavioral scenarios, providing deeper insights into long-term advising outcomes.
9. Conclusion
This research examines the use of optimization approaches in academic advising operations, with particular attention to workload balance, advisor preferences, and student characteristics in one institutional setting. It offers a comprehensive explanation of the process and its unique aspects. By reviewing the relevant literature, the study highlights the research gap, emphasizing the underexplored issue of equitably assigning academic advisors to students from different majors and risk classes. Subsequently, it introduces a framework to optimize this assignment and conducts an experimental study to analyze the proposed model, resulting in managerial recommendations and strategies for improvement.
Existing studies have underscored the importance of supporting the advisory process with innovative tools and have examined the impact of advisors on student outcomes. However, few studies have attempted to optimize the assignment of advisors to students. These optimization studies often lacked connection to real-world problems, failed to consider practical goals, and addressed only a small number of instances.
In response to these gaps, the proposed framework in this study employs a data-driven research approach to formulate an optimization problem that enhances the assignment decisions. This model considers multiple criteria, including the number of students, their risk classes, advisor major preferences, and the distribution of advisors across majors. Consequently, it aims to achieve fairness and advisor satisfaction, with the potential to support student outcomes.
The conducted experimental study provided a detailed comparison between the baseline assignment and the solution from the proposed model. It demonstrated substantial improvement across all evaluated objective components relative to the baseline assignment.
As a result, several managerial insights were derived, ranging from ways to adopt the model and the advantages of this adoption to strategies for improving resource management. The study also concluded with a discussion of its limitations and suggested four main future research directions, with several sub-paths related to advanced decision problems and optimization models, comparative experimental studies, and longitudinal studies.Table A3, A4 and A5