This study explores the contribution of the Blue Economy to employment generation across the European Union from 2009 to 2017. It seeks to identify the most influential sectors in the development of blue jobs and examine their geographical distribution across EU sea basins.
A panel data regression model was applied to a balanced dataset covering 27 EU member states. The model identifies sectoral impacts on employment, highlighting both positive and negative contributors within the Blue Economy. The analysis is disaggregated by the eight EU sea basins.
Results indicate that coastal tourism remains the most influential sector in generating blue jobs, followed by Maritime Transport and the exploitation of non-renewable marine resources. Conversely, fisheries and aquaculture show a negative relationship with job creation, likely due to climate change and restrictive EU quota policies.
The study focuses on the 2009–2017 period and does not consider recent disruptions such as COVID-19 or geopolitical conflicts. Future research should extend the analysis to more recent data.
Findings support the design of targeted public policies that strengthen tourism and transport sectors as engines of sustainable maritime employment.
The Blue Economy can promote inclusive job creation across the EU, even in landlocked areas, contributing to regional cohesion.
This research contributes novel empirical evidence on blue employment in the EU by incorporating all member states and examining the spatial dimension of job distribution across sea basins. It offers a comprehensive picture of how blue employment evolves and affects both coastal and landlocked countries.
1. Introduction
In today's world, a number of key concepts have emerged across different contexts, progressively shaping a new way of understanding socio-economic development. Among these, by way of example, and among many others, are the concepts of Green Economy (Loiseau et al., 2016), Social Innovation (Cajaiba-Santana, 2014), Globalization (Martín-Cervantes et al., 2020), Energy Transition (Sovacool, 2016), and, more recently, the Blue Economy. The term was coined in 2010 at the request of the Club of Rome, when Pauli (2010) authored a report entitled “The Blue Economy”, which would ultimately become fundamental in the sphere of Sustainable Development. This report advocated the implementation of one hundred innovative business practices designed to transform traditional marine production models through new competitive strategies explicitly aimed at avoiding ocean overexploitation and addressing, and thereby eliminating the alarming levels of marine pollution. For this reason, the Blue Economy embodies a new paradigm within the sphere of socio-economic development, as it serves as a vehicle for equity and social benefit across multiple sectors (Cisneros-Montemayor et al., 2019), grounded in a distinctly inclusive perspective (Cisneros-Montemayor et al., 2021).
Gradually, the Blue Economy became a theoretical conceptual framework (Cobacho et al., 2020; Keen et al., 2018) that would have to be constantly redefined according to the requirements of all stakeholders of society (Ertör and Hadjimichael, 2020), whether or not they belong to the maritime environment.
The Blue Economy represents an emerging concept (Kedia and Gautam, 2020) for which there is no consensual definition as such (Keen et al., 2018). Indeed, supranational institutions such as The Commonwealth of Nations (Commonwealth of Nations, 2021), The United Nations (United Nations, 2017), or The World Bank (van den Burg et al., 2019; World Bank, 2017) provide different notions about this neologism. Such heterogeneity among the definitions has in common the emphasis on the enormous potential of seas and oceans to supply humanity with natural resources, energy, and food (van den Burg et al., 2019), highlighting its sustainable aspect (Daly et al., 2021; Oliveira Neto et al., 2021; Sampaolo et al., 2021), closely linked to the feasibility of establishing an authentic Circular Economy (Blomsma, 2018; Clube and Tennant, 2020; Pu et al., 2021) within the context of the Global Economy (Clube and Tennant, 2020; Idris, 2020).
Consequently, from the original framework of the Blue Economy, many other terms have been extended from the epithet “blue” that give a good account of the multidisciplinarity of this vast field of study, among which the following may be mentioned: Blue Business (Fusco et al., 2022), Blue Carbon (Cao et al., 2022; Kuwae et al., 2022), Blue Development (Mogila et al., 2021), Blue Economies (Cobacho et al., 2020; Dziura, 2016; Katila et al., 2019; Vierros and Harden-Davies, 2020), Blue Energy (Andreadou et al., 2019), Blue Financing (Shiiba et al., 2022), Blue Governance (López-Bermúdez et al., 2020), Blue Investments (Tirumala and Tiwari, 2022), or Blue Justice (Arias Schreiber et al., 2022; Bennett et al., 2021; Schutter et al., 2021a). This study aims to address a persistent gap in the current academic analysis of the Blue Economy: its potential contribution to job creation and, more specifically, within the European Union, by identifying those activities that most significantly foster employment across the different European maritime façades. To that end, the paper has been structured as follows: Next, section 2 details the state of the art regarding the Blue Economy, highlighting its main lines of research and driving themes, while section 3 describes the data and methodology implemented. Finally, section 4 compiles the results obtained in this study, which are conveniently discussed in light of the predominant literature in section 5. Further background and conceptual elaboration on the Blue Economy are available in the supplementary material I and II (Martin-Cervantes, 2025a, b), which include and expand content not covered in the sections of this manuscript.
2. Literature review
The Blue Economy is characterized by presenting a series of contents and objectives whose essence is based on pragmatism. In this regard, Burgess et al. (2018) define several rules aimed at ensuring blue growth, taking as a point of reference all those individuals on whom, in one way or another, its implementation may have repercussions, i.e. the stakeholders of the Blue Economy. Among these, the studies focused on local coastal communities occupy an essential place (Clark Howard, 2018; Erkkilä-Välimäki et al., 2022). It is also important to highlight the works that analyze the extractive sectors related to the marine environment through two main blocks: the fishing industries (Erkkilä-Välimäki et al., 2022; van der Grient and Drazen, 2021; Huyen et al., 2021; Somoebwana et al., 2021) and the broad set of practices focused on the deployment of the Aquaculture (de Amstalden, 2022; Andrés et al., 2021; Garza-Gil et al., 2021; Wiber et al., 2021),
The activities linked to Ecotourism (Phelan et al., 2020) are other of those that agglutinate more stakeholders, having to be adapted to the particular circumstances of each country. This is the case of the sailing events in Malta (Jones and Navarro, 2018) or the Scuba industry (Nisa et al., 2022) in the Pacific Ocean countries. This degree of diversity among countries and geographic areas has to be reflected by Marine Spatial Plannings (MSP) (Bennett, 2018; van den Burg et al., 2019; Gerhardinger et al., 2020), which are the programmatic plans on which the enactment and implementation of blue policies are carried out in view of generating sustainable economic development (Bennett et al., 2021; Garza-Gil et al., 2021; Schutter et al., 2021b), resulting to be fundamental for the decision-making processes in this area (Cobacho et al., 2020; Weir and Kerr, 2019).
As Surís-Regueiro et al. (2021) point out, the multifaceted nature of Marine Spatial Plannings (MSP) goes hand in hand with the complexity of the Blue Economy, given that elements so heterogeneous as cultural, institutional, political, socioeconomic, environmental and ecological factors have to be considered together, aimed at revitalizing aquatic ecosystems services (Bennett et al., 2021; Daly et al., 2021; Phelan et al., 2020; Schutter et al., 2021a). From these, humans obtain direct benefits that contribute to increase societal well-being, and public health at the same time that global poverty is reduced (Cobacho et al., 2020; Obura, 2020). Notably, the Blue Economy stakeholders are dynamically defined both locally and globally, so it is increasingly frequent to find a planning of its objectives at a supranational level, according to zones or areas of nations such as the SAARC countries (Alharthi and Hanif, 2020), the ASEAN countries (Song and Fabinyi, 2022), the CARICOM countries (Hassanali, 2020), or the GCC countries (Alshubiri, 2018, 2020), just to mention a few examples. Accordingly, the outcomes of the Blue Economy have served to constitute a dense network of transnational political-economic relations, whereby the Blue practices have come to be configured de facto as an international economic policy tool (Kedia and Gautam, 2020), playing a prominent place in the geopolitics of the present (Druzhinin and Lachininskii, 2021; Idris, 2020; Kaczynski, 2012; Mallin et al., 2019). In line with Louey (2022), it can be termed as “an instrument of political maneuver” which, is often contested nowadays when nations determine their exclusive economic zones (Maclellan, 2018).
Innovation also occupies a primary role in the Blue Economy, and two main lines of research may be distinguished: on the one hand, the works specifically focused on the study of technological innovation per se (Arias Schreiber et al., 2022; Meyer, 2021; Spaniol and Rowland, 2022) that, among other aspects, analyze the environmental impact of the exploitation of the subaqueous mining resources (van der Grient and Drazen, 2021; Mogila et al., 2021; Song and Fabinyi, 2022; Voyer and van Leeuwen, 2019), the electrification of seas under sustainable perspectives (Spaniol and Hansen, 2021), the procurement of blue carbon (Mudd et al., 2009), the decarbonization of the marine environment (Geerlofs et al., 2021), or the control and management of residues deposited into the oceans (Phelan et al., 2020; Xu et al., 2021). Similarly, recent studies emphasize the need to embed sustainability-related competencies into education systems as a means of fostering long-term transitions in social awareness (AlDhaen, 2023; AlDhaen and Mahmood, 2020) in the context of the Blue Economy.
The analysis carried out in this study aligns with recent approaches to sustainability and finance applied across various regions, from BRICS-T countries (Tekin, 2022, 2024) to advanced industrialized economies within the OECD (Tekin et al., 2025; Ugur et al., 2023), offering a valuable comparative perspective for rigorously framing the European case.
3. Methodology
To overcome objectively the intrinsic complexity of abstracting numerically the achievements attained by the Blue Economy (Keen et al., 2018; Reinertsen and Asdal, 2019) throughout Europe, it has been used as an empirical point of reference for this research. The most significant variables of this report have been extracted over the 2009–2018 time horizon for each of the 27 member countries of the European Union, as specified in Table 1. To carry out a panel data regression, it has been determined as a dependent variable the percentage of individuals employed in the area of the Blue Economy versus the total number of workers employed in sectors that this report considers particularly important for the development of the Blue Economy (independent variables), i.e.: Living resources, Non-living resources, Ocean energy, Port activities, Shipbuilding and repair, Maritime transport, and Coastal tourism.
Therefore, given the non-existence of missing values, it has been possible to structure a longitudinal database, obtaining a balanced panel composed of 2,160 items (T = 10 years (2009–2018), Total variables = 8, and Individuals = 27). Each of these items collects information on an annual basis on the variables defined in Table 1. From the analysis of panel data regression, the process of excluding any trace of unobservable heterogeneity that may affect the variables under study is facilitated (Mačiulytė-Šniukienė et al., 2023). In other words, all omitted or unobservable variables that hinder causal inferences derived from an observational study can be controlled by using this approach (Boulouta, 2013; Halaby, 2004). Consequently, if the unobservable heterogeneity is correlated with the explanatory variables (with the consequent bias of the coefficients obtained in the model), a conditional type of inference would have to be performed, that is, an estimation by Fixed Effects (FE) (Himmelberg et al., 1999). Conversely, in the case where effects are uncorrelated with the explanatory variables, an unconditional inference would have to be carried out through the implementation of Random Effects (RE) (Arellano and Bover, 1990).
Additionally, to highlight other relevant aspects related to the performance of blue jobs in Europe, data from EU Blue Indicators (Blue Indicators, 2020) have been employed, by considering the total number of jobs created by the Blue Economy (at a general European level and discriminated according to the 8 sea basins established in the European Union for the period 2009–2017). Likewise, we also used data related to the European GDP (2009–2017) from Eurostat (2020), to represent the impact of the Blue Economy on the total goods and services generated in the European Union. The empirical findings obtained in this section have made it possible to determine specifically the employment patterns of each of the sectors that make up the Blue Economy. Next, in the subsequent section, the implications of such results are highlighted, studying how they should be related to the current sociopolitical frameworks and the sustainability objectives in the labor market of the European Union.
4. Results
In Table 2 it can be observed the main descriptive statistics concerning the 8 variables under study as defined in Table 1. The discrimination performed between the 27 member countries of the European Union, distinguishing between coastal countries and non-coastal countries, enables to specify the impact of the Blue Economy regardless of whether they have access to the seaside or not.
Thus, it can be verified that, for the entire analyzed dataset, the blue jobs correspond to a non-negligible average of 3.33% of the total number of jobs in each country, ranging from 4.03% of the coastal countries to 0.02% of the non-coastal countries (Austria, Czechia, Hungary, Luxembourg, and Slovakia). For the latter, variables NLR, CT, and, OE. In any case, it may be considered a logical circumstance that there is no maritime tourism as such, or that these economies cannot focus on the generation of renewable natural resources of oceanic origin, or that being landlocked it is not feasible to obtain energy from the seas. However, this pattern is also noticeable in the European coastal countries where only 4 nations have committed to strengthen marine renewable energies: Belgium, The Netherlands, Denmark, and Germany (especially the last two). The rest of the coastal countries are completely bypassing this sector and their contribution to job creation from non-living resources is limited to a relatively small number of countries (Croatia, Denmark, France, Germany, Italy, Netherlands, Poland, and Romania).
The sectors at the forefront of blue employment creation are primarily the tourism activities (CT) (led by France, Greece, Italy, Italy, Portugal, and Spain), followed by the industries related to the exploitation of natural resources (LR), essentially from fishing and the increasing implementation of the aquaculture (led by Spain, Italy, France, Germany, and Greece), the port activities (PA) (led by Germany, France, Spain, Italy, and The Netherlands), the maritime transport (MT) (led by Germany, Italy, France, The Netherlands, and Denmark). In addition to these segments, the Shipbuilding and repair industry (SAR) plays a major role in the creation of blue jobs with an average for the whole set of analyzed countries of more than 10%. However, as has been noted, the contribution of the sectors related to energy production (EO) is quite small, as is the case with non-renewable natural resources (NLR), in both cases corresponding to less than 1%. As far as the non-coastal countries are concerned, as is obvious, the variables PA, SAR, and MT are confined to the main river basins of these Central European countries, mainly to the basins of rivers such as the Danube, the Tisza, or the Vltava. If we stick to the variability measures of the dataset as collected in Tables 2, it can be verified that variables that vary the most over the time horizon (2009–2018), are precisely those that show higher average values, i.e. and, in this order: CT, LR, PA, MT, SAR, NLR, and OE. In a certain sense, this variability indicates a certain clustering at the country level or even regionally given the disparity present across all nations. In this sense, it can be stated that the tourism sector (CT) is essentially centered in the Mediterranean countries, while maritime transport (MT) or port activities (PA) in addition to the Mediterranean area prevail in the North Sea countries.
When performing regression analysis on sample data, it is not necessary to start from an a priori-determined modeling, either the pooled least squares (PLS) model (or common effects model), the fixed effects (FE) model, or the random effects (RE) model. As Hsiao (1985) points out, in practice the selection of any of these alternatives depends on the objectives established by each researcher and the characteristics of each study. Intuitively, it seems that the most convenient is to perform the regression from a Fixed Effects (FE) Model since through this approach it is feasible to focus on analyzing the impact of the variables over time (Bell et al., 2019), without making inferences about the effects exerted on the variables by an infinite set of factors, a task that would correspond to the Random Effects (RE) model (Searle et al., 2009). Subsequently, Table 3 summarizes the main characterizing features of the Fixed Effects (FE) model obtained based on the nature of the sample used and the underlying statistical evidence of this methodology. Using the Breusch-Pagan test (or Lagrange multiplier test) (Breusch and Pagan, 1979) as a threshold, it can be seen how the random effects estimator substantially improves the pooled OLS model and, in turn, the conclusion derived from the Hausman test (Hausman, 1978) determines that among the two possible alternatives, the fixed effects estimator is the most consistent.
Note that in this particular version of the Hausman test the null hypothesis is “the random effects estimator is inconsistent”. The prevalence of the fixed effects (FE) model over the random effects (RE) is also confirmed in the Joint significance of differing group means test. The ascription to a fixed effects model is characterized by allowing the regression intercepts to vary across individuals (Mátyás and Sevestre, 1995) (in this case countries belonging to the European Union), a pattern that is verified in the Robust test for differing group intercepts. The dichotomy as to which type of model to implement specifically (Fixed or Random) is again confirmed by the criteria Akaike (1974), Schwarz (1978), and Hannan-Quinn (Hannan and Quinn, 1979), as it is displayed in Table 3. Taking into account that lower values of these criteria are associated with better models, in all cases the choice of opting for a Fixed Effects model would be preferable. On the contrary, since higher Log-likelihood values (Fisher, 1997) also denote better models, the convenience of the fixed effects model for the considered dataset is again proven.
On the other hand, the joint test of named regressors determines that the resulting regression model fits the data better than a hypothetical model without independent variables (or intercept model). Similarly, both the values of the sum-squared of the residuals and the S. E. of the regression can be considered relatively low, resulting in a model whose internal R-squared explains a high percentage of the observed variability in the target variable from the regression model (62.52%). Concerning the significance of variables that compose the fixed effects model, it can be inferred that, in addition to the intercept, the variables LR and CT are statistically significant given a p-value = 0.001 (the first of them presenting a negative coefficient). Next, given a p-value = 0.01 the variables NLR, MT, and SAR are statistically significant (the last one also presents a negative coefficient). Finally, it can be observed that variable PA is statistically significant at a p-value = 0.05, while variable OE lacks statistical significance throughout the three p-values employed.
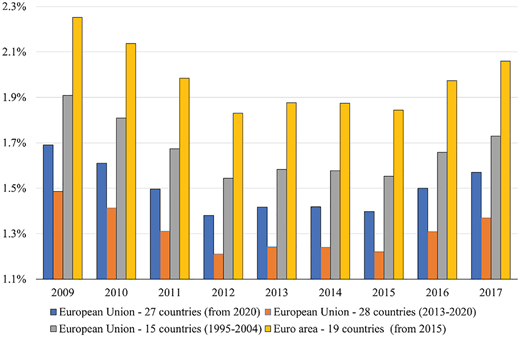
Regarding the evolution of the Blue Economy in the European Union, Figure 1 exhibits the contribution of this group of practices according to the different states that have formed the European Union over the last thirty years (EU-15, EU-27, and EU-28), in addition to the Euro Area. All the cases reveal how the contribution of the Blue Economy over the period analyzed displays a “U” shape, i.e. decline (between 2009 and 2011), stabilization (between 2012 and 2016), and rise (between 2017 and 2018). Such a characterization is undoubtedly a result of the effects of the financial crisis of 2008 which, as in other latitudes such as in the Asia-Pacific area (Bhattacharya and Dash, 2020), was felt with particular severity among the industries that generate the largest number of jobs (mainly Coastal Tourism (CT) and Living Resources (LR), see Table 2).
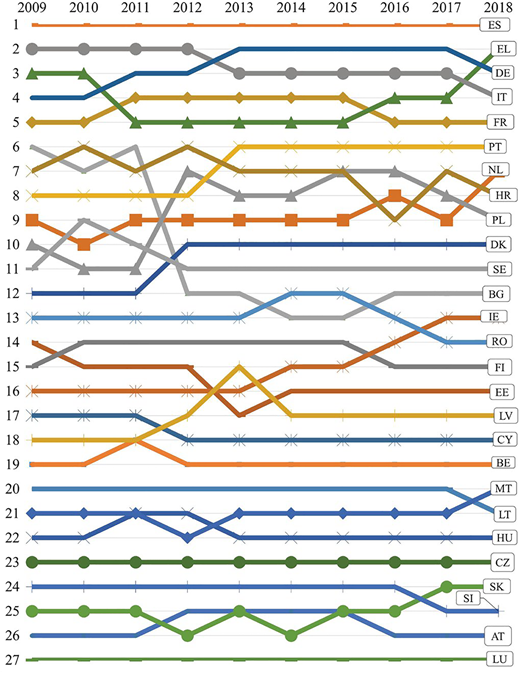
Precisely, this financial upheaval was especially noticeable in the European countries that traditionally have been leading the activities within the scope of the Blue Economy (e.g. Spain, Italy, or Greece), as shown in Figure 2, which represents the evolution of each country in the hierarchical order of the Blue Economy. The landlocked countries are those that occupy the final places in the ranking; however, it is symptomatic to note that Slovenia, being a country with a minuscule coastline (47 km), is surpassed by Central European nations such as Hungary and Czechia. According to this hierarchization, the two Mediterranean state islands (Cyprus and Malta), occupy rather low positions, even though marine activities constitute a large part of their GDP. This can be explained by the fact that, although the relative weight of the Blue Economy in the GDP of these nations is quite high, in absolute values it is far below the “great powers” of the European Blue Economy (e.g. Spain, France, Italy, Greece, or Germany). In the same manner, It can be also noted that the only two EU countries with shores on the Black Sea (Romania and Bulgaria) have a central position in the ranking, or that there exists a slight disparity between the Baltic countries. For instance, while Poland holds a relatively high position, Estonia and Lithuania occupy, respectively, middle and low positions.
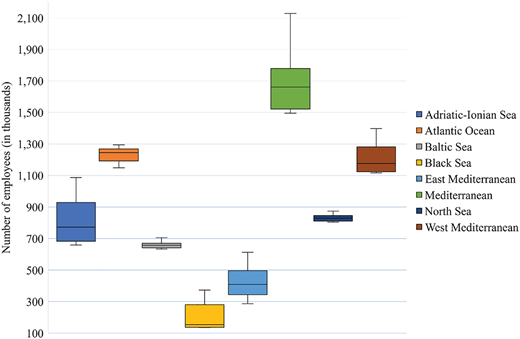
For its part, Figure 3 details the evolution of the blue jobs according to the 8 European ocean basins according to the classification established by Blue Indicators (Blue Indicators, 2020), i.e. “Nothern waters” (Atlantic Ocean, North Sea, and Baltic Sea), “Mediterranean” (Mediterranean, West Mediterranean, Adriatic-Ionian Sea, and East Mediterranean), and “Black Sea”. As it can be observed, the greatest poles of job growth are confined to three specific areas: the Mediterranean, the West Mediterranean, and the Atlantic Ocean, in all cases exceeding the million of employees.
5. Discussion
When addressing the current state of the Blue Economy in today’s real-world context, studies such as (Wuwung et al., 2022) examine global trends through a governance-focused lens using qualitative methods. In contrast, our manuscript provides a strictly empirical perspective grounded in actual employment data, thereby offering a complementary approach that reveals clear differences between countries and sectors across the European Union.
The variable resulting from the fixed effects model with the lowest statistical significance is PA (Port Activities) (given a p-value less than 0.05), describing a positive relationship with the jobs generated by the Blue Economy in the European Union. This variable reveals a potential growth niche for the Blue Economy if we take into account that most of the commodities that enter and leave Europe do so from its ports, a process that has become even more pronounced in recent times due to the internationalization and globalization of economies (Grossmann et al., 2007). However, as indicated by López-Bermúdez et al. (2020), in order to achieve greater effectiveness, port activities have to establish an even more exhaustive control, coordinating the needs of all stakeholders involved in the maritime sector. The potential for further growth is even more perceptible in those areas that act as “bridgeheads” to other continents. Such is the case of the ports of Southern Spain with respect to the Mahgreb (Ruiz Seisdedos and Fernández Carrasco, 2020) (or to the strategic alliance between Italy and Turkey with a view to creating a port trade corridor with Asia (Tanchum, 2020).
6. Conclusions
In short, this research has analyzed the impact of the Blue Economy on job creation across Europe, safeguarding the main intrinsic complexity in the study of the Blue Economy: its quantification (Reinertsen and Asdal, 2019). By using data from The EU Blue Economy Report (European Commission, 2021), a contrasted framework in this field of study, it has been possible to obtain a clear picture of this phenomenon. However, this research has also faced certain limitations. For instance, the time horizon established (2009–2018), does not allow us to appreciate the impact of the COVID-19 crisis or the recent war event in Ukraine on the Blue Economy. It is also worth noting that the temporal scope of this study could not be extended beyond 2018, due to the relatively slow pace at which the European institutions have released consistent and comparable data on the Blue Economy at the supranational level.
Our findings also confirm the need to strengthen the implementation of practical policies and strategies by aligning Blue Economy initiatives with the European Union's sustainability goals through its funding mechanisms, while recognizing the essential role that higher education institutions must play to ensure that this transition is both effective and enduring.
The supplementary material for this article can be found online.