Skip to article sections
Purpose

The purpose of this article is to present a three-stage co-creation process implemented within the HeritACT project. HeritACT, aligned with the New European Bauhaus initiative, explores heritage reactivation as climate action. This article details the application of online surveys and workshops in three pilot cases – Eleusis, Milan and Ballina – to engage local stakeholders. The aim is to identify unique challenges, objectives and potential barriers for each pilot, ultimately developing tailored heritage reactivation strategies. This process seeks to establish a foundation for future community engagement phases: co-recognition, co-envisioning and co-implementation.

Design/methodology/approach

The proposed process combines a selection of methods and digital tools to support local stakeholders to identify particular challenges and contexts for urban management, what each pilot case expects to achieve and how, and the associated barriers and risks. It involved three stages: (1) an online survey with each local municipality stakeholder to help identify the unique characteristics of each pilot case. (2) An online co-creation workshop for each pilot case. (3) An output-sharing workshop to generate discussion and refine outcomes.

Findings

The HeritACT project successfully implemented a three-stage co-creation process across its pilot cases in Eleusis, Milan and Ballina. This process, involving online surveys and workshops, effectively identified the unique challenges and objectives for each location. In Eleusis, the focus shifted to developing a governance model for reactivated spaces. Milan aimed to establish a network of resilient community hubs within its “cascina”. Ballina’s strategy centred on reactivating vacant religious buildings to build community resilience. The co-creation methodology, combining digital tools and stakeholder engagement, proved crucial for understanding local requirements and setting the stage for future co-recognition, co-envisioning and co-implementation phases.

Originality/value

The originality and value of this article lie in its proposed three-stage co-creation process for heritage reactivation, which integrates online surveys and workshops. This process’s innovation is its ability to foster comprehensive discussions and establish stepping stones for future community engagement phases within the HeritACT project. Furthermore, the methodology has been designed to be generalisable and replicable across diverse cultural, planning, and socio-economic contexts. The article offers a valuable contribution by presenting a process that effectively renders visible the nuanced requirements of each pilot case (Eleusis, Milan and Ballina) and facilitates the development of tailored heritage reactivation strategies aligned with the New European Bauhaus principles. This approach expands existing co-creation methodologies by combining digital tools to generate curated roadmaps for co-recognition, co-envisioning and co-implementation.

HeritACT is an EU Horizon Europe project aligned with the New European Bauhaus (NEB) that explores heritage reactivation as climate action. This article focuses on the implementation of a co-creation process for heritage reactivation strategies in three pilot cases of the HeritACT project, namely Eleusis (Greece), Milan (Italy) and Ballina (Ireland). The proposed process combines a selection of methods and digital tools to support local stakeholders to identify particular challenges and contexts for urban management; what each pilot case expects to achieve and how; and the associated barriers and risks. It involved three stages: (1) an online survey with each local municipality stakeholder to help identify the unique characteristics of each pilot case. (2) An online co-creation workshop for each pilot case. (3) An output-sharing workshop to generate discussion and refine outcomes. The article presents the co-creation processes and associated results regarding each heritage reactivation strategy. The Eleusis pilot sets out to develop an effective model for the governance of historic structures; while the Milan pilot focuses on “cascina” remaining in the metropolitan area and transforming them into a network of resilient community hubs, and finally, the Ballina pilot focuses on vacant religious institution buildings and their reactivation to build community resilience. The innovative contribution of this article is a three-stage process that enabled comprehensive discussions of the stepping stones for future community engagement activities planned in the project, which involves co-recognition, co-envisioning and co-implementation phases. This process has been generalised to be applied to different cultural, planning and socio-economic contexts to ensure its replicability in future potential pilots. These activities leverage digital tools for participatory processes and are rooted in the NEB principles, fostering climate action initiatives in the pilot cases.

The NEB initiative, launched in 2020, serves as a catalyst for achieving the objectives outlined in the European Green Deal (EGD) by fostering the creation of aesthetically pleasing, sustainable, and inclusive environments. At its core, the initiative recognises that transitioning to a sustainable society entails a cultural transformation grounded in empathy, compassion, creativity and paradigm shifts, with art and culture playing crucial roles (Von der Leyen, 2024).

Derived from the NEB initiative, the HeritACT project applies its principles to heritage reactivation in three European pilot locations: Eleusis (Greece), Milan (Italy) and Ballina (Ireland). The project is divided into three phases: co-recognition, co-envisioning and co-implementation. A toolkit of digital tools and a selection of design solutions are proposed to be applied as part of the three phases through community engagement activities.

As part of its overarching aim, a co-creation process with partners from the three pilots was proposed to achieve three primary goals: firstly, to collect the objectives and priorities unique to each pilot case within the project’s framework; secondly, to identify barriers and risks that may impede the realisation of these objectives; and thirdly, to establish a foundational knowledge base for the co-recognition, co-envisioning and co-implementation phases.

By fulfilling these objectives, a comprehensive understanding of the aspirations of each pilot case within HeritACT is developed while also collating the challenges that may hinder the realisation of their vision and objectives. This article delineates the preparation, implementation, and evaluation of this collaborative effort, outlining the main outcomes of the co-creation process. As will be discussed in the next section, each pilot is characterised by a unique urban context, planning regulations, history and culture. Within the overarching aim of the HeritACT project, each pilot works with different elements (e.g. Cascina in Milan, institutional buildings in Ballina and communities in Elefsina) of its built and cultural landscapes to improve the respective town’s historical urban environments. The three-step co-creation process described in this article has been tested and validated in these three completely different contexts. Despite the varying context, the key contribution of this co-creation process and tools tested remains in its ability to render visible the nuanced requirements and needs of each pilot, activate the visioning of a shared roadmap between the pilots and establish a closely aligned strategy to advance the HeritACT strategy in three different contexts. As such, the article expands the plethora of co-creation methodologies proposing a combination of digital tools and methods to generate curated roadmaps for the co-recognition, co-envisioning and co-implementation phases amongst pilots with varying contexts and compositions.

HeritACT project’s focus on reactivating historical urban environments to foster sustainable urban development is exemplified through three pilots: Elefsina; Milan; Ballina. In Elefsina, the initiative’s goal is to involve the neighbourhoods in cultural and urban planning endeavours, focusing on inclusiveness through creative sustainable design measures. The pilot opts to work towards the reconciliation of the differences between its communities, by creating conditions that facilitate connection to their common historical heritage, as defined by the physical, mythological and historical landscape of Elefsina. Similarly, in Ballina, the project explores the potential of institutional buildings and sites to act as dispersed hubs for the EU Green Deal and the NEB in Irish towns. In Milan, the project focuses on the revitalisation of the historic “Cascina” – former agricultural estates that now lie within urbanised zones. The Milan pilot aims to restore these sites as cultural and ecological hubs, strengthening community engagement through collaborative design and sustainable practices. Overall, by fostering partnerships, supporting vulnerable groups and creating living laboratories, the HeritACT initiative seeks to integrate art, culture and technology while promoting healthy, climate-adaptive lifestyles.

Co-creation processes involve the collaboration of various stakeholders in the design and innovation of products, services or experiences and have been increasingly recognised for their potential to enhance outcomes (Ertz, 2024). However, co-creation success depends on a range of conditions, including context, stakeholder characteristics and process design (Rădulescu et al., 2020; Lee et al., 2024). Therefore, a framework for co-creation projects that considers these factors is essential for their effective implementation (Lee et al., 2018).

In the context of cultural heritage, co-creation is understood as the process of collaborating with stakeholders to guide the design process, prioritising the narrative of cultural heritage (Avram et al., 2020; Egusquiza et al., 2021; Gravagnuolo et al., 2021; Hincapie et al., 2016; Johnston and Marwood, 2017; Niu et al., 2018; Wu and Hou, 2020). It is a sustainable and bottom-up approach that focuses on integrating stakeholders' needs and ideas to inform decision-making (Grcheva et al., 2021). A range of studies have explored the co-creation processes in the context of cultural heritage and resilience. Fava (2022) highlights the role of community participation and self-organisation in adaptive heritage reuse, which can contribute to resilience in urban systems. Pultrone (2019) further emphasises the potential of cultural heritage in promoting sustainable development and social inclusion, particularly in the face of crises such as the COVID-19 pandemic and climate change. These studies underscore the importance of co-creation processes in leveraging cultural heritage for resilience and sustainable development.

Additionally, heritage co-creation approaches can be used to address post-disaster reconstruction and recovery to protect intangible heritage (Wu and Hou, 2020), as a key aspect in the context of climate emergency; to define strategies for reusing cultural heritage to promote a circular economy (Arlotta, 2020; Chandler and Pace, 2019), and foster urban regeneration through the development of culture-led projects (Niu et al., 2018).

Such approaches benefit in several ways: they emphasise shared responsibilities, provide a space for cultural dialogue (Wergin, 2021), bring together divergent groups in communities, contribute to community regeneration and redevelopment (Phillips and Stein, 2016), and democratise the preservation and valorisation of heritage (Pappalardo, 2020; Gravagnuolo et al., 2021). Co-creation techniques include interviews, workshops (Swords et al., 2021), and the use of digital technologies (Buthke et al., 2020), fostering an iterative and flexible process.

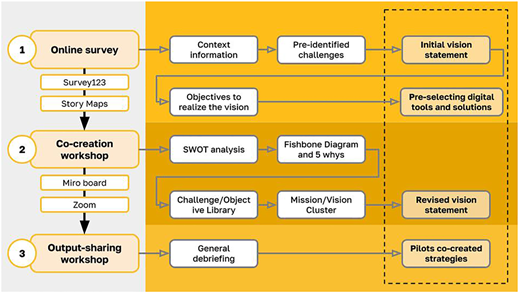
The co-creation process proposed for this study involved three stages (Figure 1). First, an online survey was conducted with each local municipality stakeholder to identify the unique characteristics of each pilot case. Second, an online co-creation workshop was held for each pilot case. The workshop included exercises to better understand the case’s ability to achieve project objectives, identify the root causes of challenges and negotiate solutions regarding a vision statement and strategic goals. Finally, an output-sharing workshop was organised to generate discussion and refine outcomes. By the end of the process, each pilot achieved an agreed strategy for heritage reactivation practices with the community, considering the specific context of each case.

The process was designed to ensure the integration of the project’s consortium through a bottom-up approach. Initially, the online survey gathered input exclusively from municipal stakeholders. The online workshops engaged the pilot partners, while the output-sharing workshop broadened the discussion to include the entire consortium.

  1. Online survey with stakeholders

The survey was specifically designed to gather initial information from each pilot case. It serves two primary purposes: supporting the selected techniques and tools for the first workshop sessions and obtaining contextual information related to the local management of the buildings targeted for reactivation within the project. The survey was distributed to all partners associated with each pilot case to ensure that they could internally discuss and provide comprehensive answers for each question.

Survey123, developed by ESRI, was chosen to implement the survey and collect responses. This software enables participants to contribute visual elements, such as pictures, drop pins on a web map, and share files. The collected data can be visualised, analysed and shared using ESRI’s ArcGIS platform, facilitating the extraction of valuable insights, identification of trends, and informed decision-making based on the survey results. Notably, the outputs generated by Survey123 can be displayed using visualisation tools that can be embedded into websites, further enhancing the accessibility and presentation of the survey data.

  1. Online co-creation workshops

The workshops were conducted in two sessions, both taking place entirely online. The key tools utilised for these workshops included Doodle, Zoom, Miro boards, and Google Presentations. The exercise was designed to enhance the understanding of the town or city’s capacity to meet project objectives, identify the root causes of challenges and negotiate solutions aligned with a vision statement and strategic goals. The workshop sessions were designed to effectively guide participants through the framework, facilitate collaborative discussions, and ultimately derive meaningful insights and outcomes for each of the pilot towns/cities in the HeritACT project.

Representatives from each pilot case participated in the first session. The primary objective of the session was to review the inputs obtained from the survey using the selected techniques, namely SWOT analysis, Fishbone Diagram +5 Whys, and Objective/Action cluster model. Each technique and tool supported the workshop sessions by fulfilling a specific purpose within the framework, encompassing identifying challenges and potentialities, exploring possible solutions, formulating objectives and actions, and developing vision statements.

  1. Output-sharing workshop

The output-sharing workshop was specifically designed to bring together all participants from each pilot case and facilitate the sharing of outcomes derived from the co-creation workshop sessions. The primary focus of this session was to foster knowledge exchange, promote cross-learning, and debrief on the specific contexts of each pilot case. A presentation template was designed to summarise the outcomes of the first workshop sessions and guide the discussions. It included a summary of the SWOT analysis, Fishbone Diagram, and the identified challenges and corresponding solutions. The presentation concluded with a comparison between the initial vision/mission statement from the survey and the revised version developed during the first sessions. Each pilot case was allocated 10 min to present their findings and insights.

A combination of digital tools and methods has been used to facilitate three stages of the co-creation process. It is to be noted that these tools were primarily used in the first two stages and the outcomes were discussed in the output-sharing workshop.

  1. SWOT Analysis

Strengths, Weaknesses, Opportunities and Threats analysis or, in short, SWOT analysis is a strategic planning technique used to evaluate the internal and external factors affecting organisations’ or projects’ performance and ability to achieve objectives. It was developed by Albert S. Humphrey at the Stanford Research Institute (SRI) in the 1960s (Gurel and Tat, 2017).

During a SWOT analysis, participants identify and evaluate their strengths and weaknesses through an internal assessment. They also assess opportunities and threats by analysing the external environment, which involves monitoring industry trends, market dynamics, and competitive forces. The analysis is supported by a diagram with four quadrants, where the columns can be interpreted as helpful (left-hand side) and harmful (right-hand side) aspects of the conditions.

SWOT analysis provides a comprehensive understanding of an organisation’s or project’s current position and informs strategic decision-making. It helps to identify areas for improvement, capitalise on opportunities, mitigate risks and formulate effective strategies that align with their strengths and objectives (Gurel and Tat, 2017).

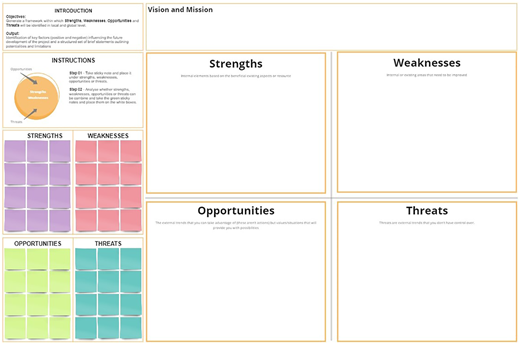
Within this study’s framework, the SWOT analysis was modified to facilitate the start of the vision and mission stated in the survey. This modification was implemented to identify strengths and weaknesses within the HeritACT project and explore the opportunities and threats associated with the pilot case’s context and the selected buildings/sites (Figure 2). Instructions were provided alongside the diagram to facilitate the implementation of the SWOT analysis technique which served as a guide for carrying out the process in preparation for the following steps.

  1. Fishbone Diagram +5 Whys

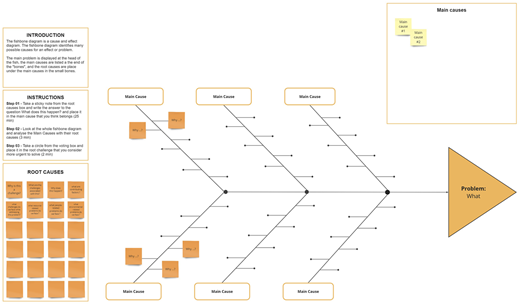
The Fishbone Diagram, also known as the Ishikawa Diagram or Cause and Effect Diagram, is a visual tool used to identify and analyse the potential causes of a problem or an effect. It helps teams or individuals systematically explore various factors that may contribute to a particular outcome. The diagram resembles the shape of a fishbone, with the “head” representing the effect or problem and the “bones” representing different categories of potential causes. It aims to visually represent the potential causes of a problem to facilitate problem-solving and root-cause analysis. The diagram typically consists of a horizontal line representing the effect or problem under investigation. Several diagonal lines (bones) are connected to the main line, each representing a different category of potential causes. The diagonal lines (bones) on the Fishbone Diagram usually represent categories of causes that can contribute to the effect or problem being analysed.

Collaboratively, the participants brainstormed and identified potential causes within each category, writing the causes as branches stemming from the respective category line. This process encouraged a comprehensive exploration of factors that could contribute to the problem.

The 5 Whys technique is a problem-solving approach that complements the Fishbone Diagram exercise. After identifying potential causes on the diagram, the 5 Whys technique is generally applied to investigate the root causes. It involves repeatedly asking “why” to delve deeper into each identified cause. By asking “why” five times (though it can vary), the team uncovers the underlying reasons or contributing factors behind each cause.

Once potential causes have been identified and analysed using the Fishbone Diagram and the 5 Whys technique, the team can prioritise and focus on addressing the most critical or influential causes. This analysis can guide problem-solving efforts, help develop action plans and lead to effective solutions that address the root causes rather than just the symptoms.

By combining the Fishbone Diagram and the 5 Whys technique, the participating team gained a structured approach to identify potential causes and investigate the root causes of a problem. This collaborative process promoted a deeper understanding of the problem and facilitated targeted problem-solving efforts, ultimately leading to more effective solutions.

A comprehensive and well-structured design was developed to integrate the Fishbone Diagram and 5 Whys technique for the workshops, as illustrated in Figure 3. This exercise aimed to enhance the problem-solving process by visually representing the cause-and-effect relationships and facilitating in-depth analysis of the underlying root causes.

  1. Vision/Mission cluster

The vision/mission cluster technique develops and refines a project’s vision and mission statements. As a method, it supports the development of a clear understanding of the project’s purpose and desired future state. The technique helps project teams gather and organise ideas, aspirations and concepts that align with the project’s objectives.

The application of this technique starts by identifying the key stakeholders involved in the project. Once the participants are identified, brainstorming sessions or workshops are organised, where stakeholders can freely express their thoughts, ideas and aspirations for the project’s future. Participants are encouraged to think beyond the immediate goals and envision the broader impact and purpose of the project.

As the ideas start flowing, they are captured and documented using any available media or tool. Then, the ideas are grouped and categorised based on their common themes or concepts. Patterns and similarities among the ideas must be tracked to identify overarching goals and directions for the project.

In the next step, clustered ideas are refined and prioritised. Once the ideas are refined, the vision and mission statements for the project can be created collaboratively. The vision statement should articulate the project’s desired future state or outcome, serving as a beacon that guides the team towards a shared goal. Conversely, the mission statement should define the project’s purpose, core values, and the actions required to achieve the envisioned future state.

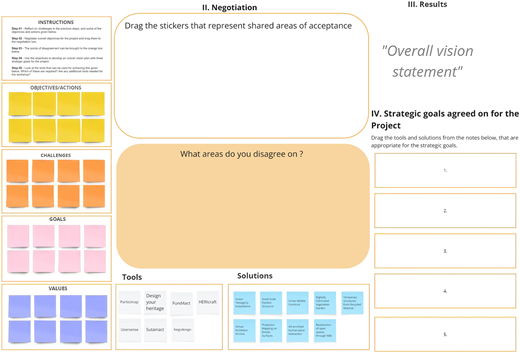
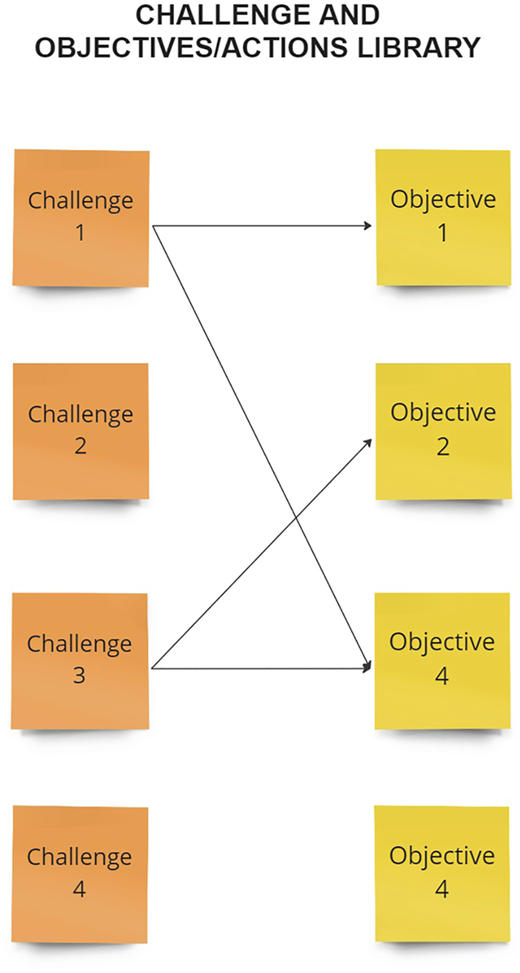
In this study, the vision/mission cluster involved adapting and renaming the Vision/Mission board to the Objective/Action cluster (Figure 4). This cluster served as a tool for participants to review and compare the outcomes from the previous techniques used in the co-creation workshop. To support the identification of correlations between the challenges identified during the SWOT analysis and the Fishbone Diagram, a dedicated Challenges and Objectives/Actions library was developed (Figure 5).

The Challenges and Objectives/Actions library contained a compilation of challenges, objectives and actions derived from the survey responses. These elements were categorised and organised in a structured manner, allowing participants to navigate and reference them during the workshop easily. This library served as a resource for participants to establish connections between the identified challenges and the corresponding actions previously defined in the survey.

To facilitate the utilisation of the Objective/Action cluster, a set of steps were defined:

  • Step 01 Reflect on Challenges and Previous Outcomes – Participants were encouraged to reflect on the challenges identified in the previous steps and consider the objectives and actions generated from those techniques.

  • Step 02 Negotiate Overall Objectives – Participants engaged in a negotiation process to identify and agree upon five overarching objectives for the project.

  • Step 03 Address Disagreements – Any points of disagreement that arise during the negotiation process could be brought to the disagreement box, allowing for open discussion and resolution of conflicting viewpoints.

  • Step 04 Develop an Overall Vision Plan – Using the agreed-upon objectives, participants worked together to develop an overall vision plan. This plan encompassed three to five strategic goals that align with the identified objectives.

  • Step 05 Assess Required HeritACT digital tools – Participants evaluated the tools provided for achieving the vision plan. They considered which tools were necessary to complete the co-recognition and co-envision phases of the project.

The co-creation methodology and related tools were tested in three pilots of the HeritACT project – Eleusis, Ballina and Milan. The results from each stage are presented below.

The use of Survey123 allowed the creation of a custom survey webpage that was easily shareable among the engaged stakeholders. The first page of the survey was dedicated to a clear explanation of the purpose of data collection. Respondents were prompted to select the specific pilot case to which their responses pertained. This step ensured that the data could be accurately attributed to the relevant location, allowing for a focused analysis and consideration of the unique context of each pilot case.

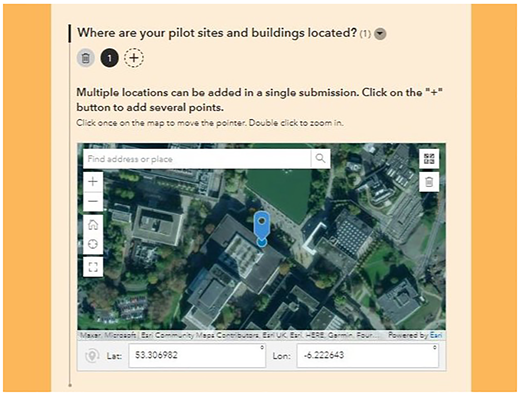
The survey incorporated a web map embedded within its interface to facilitate the collection of building/site geolocation data (Figure 6). This interactive map feature enabled respondents to easily search for the specific locations of the target buildings/sites. Respondents could utilise the search functionality provided by the embedded web map to find the desired building/site and then drop a pin on the map to mark its location accurately.

By integrating this web map into the survey, a collection of geolocation data was streamlined. Respondents could visually identify and mark the precise locations of the target buildings/sites, ensuring the accuracy and consistency of the collected data. This feature not only enhanced the efficiency of data collection but also facilitated subsequent analysis and decision-making processes, as geospatial information played a crucial role within the context of the HeritACT project.

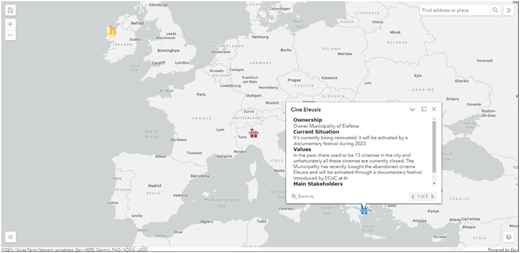
All the involved partners across the three pilots actively contributed to the survey by providing the necessary information. The survey results were compiled and organised in a table format. The collected geolocations were then linked to a web map to facilitate the visualisation of the responses during session 1 of the workshops (Figure 7). The web map was embedded in the Miro boards used for the workshops to guarantee that all participants could check the context of each building/site location as well as access a summary of the related information (such as ownership, current situation, values, main stakeholders, etc).

By involving all relevant partners in the survey process, diverse perspectives and insights from stakeholders within each pilot case were gathered. This collaborative approach fostered a comprehensive understanding of the local context and ensured that the survey responses captured a broad range of perspectives and considerations.

The survey responses obtained from each pilot case provided valuable insights into the specific requirements and perspectives of the stakeholders involved. The survey served as a crucial data collection tool, enabling the gathering of initial information and gaining a deeper understanding of the unique characteristics and challenges faced by each location.

The responses received from the survey participants were analysed and synthesised to shape the subsequent workshop sessions and facilitated the development of tailored strategies and solutions for each location. By incorporating the perspectives expressed through the survey responses, the project team was able to ensure that stakeholder requirements were effectively addressed and integrated into the overall goal of the HeritACT project. This inclusive approach not only fostered collaboration and engagement but also ensured that the project outcomes would align with each pilot case’s specific needs and aspirations.

The starting vision statement and SWOT analysis defined by stakeholders of Eleusis, Greece have been summarised as follows (Table 1). Eleusis’s stakeholders wanted to ensure that heritage buildings and public spaces activated during its European Capital of Culture (ECoC) year remain sustainable through a cultural strategy that promotes year-round activities and NEB values. They identified the city’s strength in its multifunctional, culturally rich spaces owned by the Ministry of Environment, which attract diverse audiences. However, political challenges, coordination issues and limited infrastructure, especially accessibility from Athens, present significant obstacles. Despite these challenges, Eleusis saw opportunities to leverage its industrial heritage, improve environmental conditions and secure funding from local industries, although threats like political instability, underutilization and the impact of climate change pose risks to its success.

Using the Fishbone Diagram, the Eleusis partners identified the core problem/challenge as the “Governance of spaces over time”. During the discussions on solutions, the following topics were presented as potential ways to overcome the challenges identified in Eleusis. Several potential actions have been identified, including community recognition and engagement activities for new residents, updating the business plan for the spaces and seeking additional European funding to supplement national and regional funds. Maintaining bottom-up procedures through community engagement methodologies, evolving the European Capital of Culture (ECoC) legacy, and utilising virtual reality (VR) and augmented reality (AR) technologies are also recommended. Forming partnerships with businesses, underrepresented communities, youth and senior groups, event organisers, tourism providers, charities and educational institutions will be crucial in addressing the challenges faced by Eleusis.

The proposed solutions aim to address the identified challenges and leverage the strengths and opportunities within Eleusis. By focusing on community engagement, funding strategies, collaboration and partnerships, the stakeholders hope to create a sustainable and vibrant cultural environment in the municipality.

Concluding the stakeholder requirement analysis, the vision/mission statement for Elefsina was redefined as follows: “Develop an effective governance model for reactivated spaces within the HeritACT Project”. This revised vision/mission statement reflects the focus and objective of the Elefsina pilot, which is to establish a robust and efficient governance framework for the revitalised spaces. By emphasising the importance of governance, the partners aim to ensure the long-term sustainability and successful management of the reactivated buildings/sites. This revised vision/mission statement aligns with the overall goals of the HeritACT project and underscores the significance of establishing a strong governance structure to support the project’s objectives in Elefsina.

In Milan, stakeholders emphasised the need to sustain heritage buildings and public spaces activated during the ECoC year through a cultural strategy that promotes year-round activities and NEB values. They identified strengths in Milan’s rich cultural heritage and strong community networks but noted challenges like bureaucratic obstacles, inconsistent funding and accessibility issues. Opportunities exist to leverage Milan’s cultural identity and green policies for innovative, sustainable practices. However, threats include political instability, underutilization of spaces and the impact of climate change on outdoor activities. The stakeholders' vision statement and SWOT analysis defined by Milan stakeholders can be summarised as follows (Table 2).

In the Fishbone Diagram, the core problem/challenge identified by the Milan stakeholders is “How might we realise the potential of the cascina for social and ecological benefits (attractiveness and sustainability)”. Key challenges include limited resources, both in terms of budget and human resources, as well as a lack of specific skills required for effective utilisation. Administrative bureaucracy and red tape hinder progress, and there is also resistance to adopting digital technologies.

The identified actions to overcome these challenges are based on adopting a design thinking approach to engage communities, which is crucial, as it fosters collaboration, empathy and co-creation in the development of the cascina. Clearly defining what is desirable, feasible and viable in terms of amenities, services and experiences is also essential. Strengthening existing collaborations and building new partnerships among stakeholders, including community organisations, local businesses and government entities, is necessary to enhance engagement and promote a collective effort. Experimentation and testing of different activities and initiatives within the cascina can help assess their sustainability, impact and replicability. This approach allows for the identification of successful strategies that can be scaled up to achieve the desired social and ecological benefits of the cascina.

By considering and implementing these potential solutions, Milan can address the challenges identified in realising the potential of the cascina for social and ecological benefits. These approaches promote community engagement, collaboration, and experimentation, contributing to the development of a vibrant and sustainable cascina that offers meaningful experiences to its visitors.

After the stakeholder requirement analysis, the vision/mission statement for Milan was redefined to establish “… a network of resilient and community hubs to deliver social and ecological benefits to local communities … through feasible, desirable and viable solutions.” This redefined vision/mission statement reflects the goal of creating interconnected hubs within Milan that not only provide social and ecological benefits but also prioritise the feasibility, desirability and viability of the solutions implemented. The statement emphasises the importance of meeting the needs of both the local communities and the managers responsible for the sites, fostering a collaborative and sustainable approach to developing and managing the network of hubs.

Stakeholders in Ballina defined their starting vision statement and SWOT analysis, which has been summarised in Table 3. Ballina’s vision centres on fostering a sense of place and social cohesion by promoting the cultural and architectural heritage of its historic assets for community benefit. The town’s strengths lie in its authentic historic core, active street frontages and engaged stakeholders, but it faces challenges such as high vacancy rates, dereliction and a reliance on car usage. Opportunities include revitalising the town through data-driven mapping of vacant structures and leveraging historic sites for events, while also embracing shifts in work culture to enhance inclusivity. However, threats such as ongoing dereliction, socioeconomic stratification and climate-related risks to the historic core could undermine these efforts.

For the Fishbone Diagram, the core problem/challenge identified by the Ballina partners is the “Unrealized potential of Ballina as a thriving historic town with sustainable neighbourhoods”. The main identified causes include high vacancy rates and dereliction of buildings, particularly redundant historic structures, traffic congestion exacerbates the town’s challenges, while climate change introduces additional risks, such as increased rainfall, flooding and damage to both structures and natural areas. Demographic challenges, coupled with issues related to tenure, finance and complex ownership and governance structures, hinder efforts to revitalise the town. Additionally, there is resistance to pedestrianisation, a lack of connectivity from catchment areas, and insufficient river crossings, all of which limit access and mobility within Ballina.

To address these challenges, several strategic actions have been proposed. One approach is to activate vacant structures and lands through temporary cultural and community uses, which can engage residents and breathe new life into underutilised areas. Raising awareness and educating stakeholders about successful adaptive reuse projects from other locations can also inspire local initiatives and demonstrate best practices. Testing pedestrianisation on specific days can provide insights into the benefits of creating more walkable spaces in the town. Finally, incorporating resilience strategies into planning and design will help ensure that Ballina’s structures and neighbourhoods are better prepared to withstand future challenges, including those posed by climate change and evolving community needs. These proposed solutions aim to activate vacant spaces, promote adaptive reuse, improve pedestrian accessibility and foster resilience in Ballina.

Following the stakeholder requirement analysis, the vision/mission statement for Ballina was redefined as follows: “To build community resilience through the re-activation of historic structures, historic designed landscapes, and natural environments, including woodland and water courses”. This vision/mission statement highlights the focus on revitalising and repurposing historic assets, preserving and enhancing the natural environment, and fostering community resilience. By leveraging the rich heritage and natural resources of Ballina, the aim is to create a sustainable and vibrant community that embraces its history, promotes environmental stewardship and enhances the overall well-being of its residents.

The second session of the workshops was strategically organised to provide an opportunity for all pilot cases to share their unique contexts and engage in discussions regarding the specificities of each case study. The presentation template allowed participants to set up the context of their respective pilot cases. Following the presentations, workshop facilitators provided quick comments to highlight specific aspects and particularities related to each respective first session of workshops. These facilitator comments served to provide additional context and enrich the understanding of the workshop outcomes.

Importantly, the facilitators actively encouraged discussions among all participants. The focus of these discussions was primarily on the challenges associated with each pilot case, particularly those related to the reactivation of the buildings/sites. The goal was to explore potential shared or unique risks and challenges faced by the pilot cases, fostering an environment of collaborative learning and experience sharing.

By incentivising discussions and focusing on the challenges specific to each pilot, participants were able to exchange valuable experiences and insights. This approach facilitated the identification of potential synergies, shared risks and opportunities for collaboration. Ultimately, it promoted a deeper understanding of the project’s objectives and a more comprehensive approach to the reactivation of buildings/sites within the HeritACT project.

The proposed co-creation process allowed the review of requirements within each pilot case. The three-stage process enabled comprehensive discussions that set the stepping stones for future activities planned in the project, which involves co-recognition, co-envision and co-implementation phases of heritage reactivation solutions. The proposed methodological framework for co-creation combining digital tools and workshops was crucial to enhance the participation of all pilot stakeholders (Swords et al., 2021; Buthke et al., 2020).

In the context of the HeritACT project, the process of reviewing objectives and mission statements was relevant since it aimed to understand the requirements of each pilot case, where collaborating with local stakeholders is crucial to achieving the project objectives. In this case, the design process of future activities will consider each case’s context. Sharing the survey results as a web map (Figure 7) ensured that all stakeholders involved in the co-creation process could depart from the same data set for the following steps. It is described by (Rădulescu et al., 2020; Lee et al., 2024) referring to the importance of clear objectives and goals in the co-creation process, to establish shared objectives among stakeholders to align efforts and expectations during the collaborative process.

Integrating the SWOT analysis with the Fishbone diagram, stakeholders were able to depart from the selected buildings and sites and discuss the complexities in achieving the initial vision and mission statement. This bottom-up approach served as a way to inform decision-making within the project’s objectives regarding heritage reactivation (Grcheva et al., 2021). The vision and mission review process was influenced by the assessment of what digital tools and solutions in the context of the HeritACT project could be implemented to solve the challenges for each pilot case. In each first session of co-creation workshops, stakeholders were involved in a profound discussion about the common objective of the pilot case within the project. The outputs from previous phases of the process were revisited to support the development of a refined view of the pilot case.

The use of SWOT analysis proved to be an effective tool to not only identify but also monitor the dynamic changes in the implementation of the defined strategy for heritage reactivation. Gürel (2017) presents this use as part of the historical development of the tool, as modern strategic planning now frequently integrates SWOT analysis with other analytical tools to provide a more comprehensive view of the strategic landscape. Additionally, there is an increasing emphasis on adapting SWOT analysis to dynamic environments, ensuring that strengths, weaknesses, opportunities and threats are continuously reassessed.

As introduced by Fava (2022), the process of rethinking heritage and its uses requires the active participation of local communities and this was expressed across all reviewed vision and mission statements. Considering building resilient communities, as proposed in Milan’s and Ballina’s visions, lies on the idea of democratising heritage (Pappalardo, 2020; Gravagnuolo et al., 2021), while in Eleusis’ vision, a governance model will facilitate a legacy impact after the heritage reactivation in the pilot.

Implementing the values of the NEB inherently involves a collaborative approach, as it emphasises multi-level engagement, transdisciplinarity and participation. Under the overarching framework of the HeritACT project, this study has presented a co-creation strategy that comprehends the nuances of each pilot case, with a focus on establishing a shared vision for each one, using the same set of tools. The results demonstrate that the co-creation strategy effectively facilitated the identification of stakeholders' requirements within each pilot context. The insights gained from this process will inform the subsequent phases of the project. The stakeholder engagement across three stages has proven to be instrumental in supporting the creation of tailored roadmaps for the co-recognition, co-envisioning and co-implementation phases. This approach ensured that the project aligned closely with the needs and aspirations of the pilots while incorporating the project’s framework for heritage reactivation.

The application of the proposed three-step process across three different contexts demonstrates that the combination of methodologies and digital tools offers a flexible and adaptable approach to co-creation methodologies, ensuring its replicability—not only for heritage-focused projects but also for cases involving cultural, planning and socio-demographic considerations.

Funding: HeritACT project has received funding from HORIZON-CL2-2022-HERITAGE-01 under Grant Agreement Number 101094998.
Arlotta
,
A.I.
(
2020
), “
Locating heritage value in building material reuse
”,
Journal of Cultural Heritage Management and Sustainable Development
, Vol. 
10
No. 
1
, pp. 
6
-
15
,
Emerald Group Holdings Ltd.
, doi: .
Avram
,
G.
,
Ciolfi
,
L.
and
Maye
,
L.
(
2020
), “
Creating tangible interactions with cultural heritage: lessons learned from a large scale, long term co-design project
”,
CoDesign
, Vol. 
16
No. 
3
, pp. 
251
-
266
,
Taylor & Francis
, doi: .
Buthke
,
J.
,
Larsen
,
N.M.
,
Pedersen
,
S.O.
and
Bundgaard
,
C.
(
2020
), “
Adaptive reuse of architectural heritage
”, In
Gengnagel
,
C.
,
Baverel
,
O.
,
Burry
,
J.
,
Ramsgaard Thomsen
,
M.
and
Weinzierl
,
S.
(Eds),
Impact: Design With All Senses
,
DMSB 2019, Springer
,
Cham
, doi: .
Chandler
,
A.
and
Pace
,
M.
(
2019
),
The Production of Heritage: The Politicisation of Architectural Conservation
, (1st ed.) ,
Routledge
,
New York
.
Egusquiza
,
A.
,
Zubiaga
,
M.
,
Gandini
,
A.
,
De Luca
,
C.
and
Tondelli
,
S.
(
2021
), “
Systemic innovation areas for heritage-led rural regeneration: a multilevel repository of best practices
”,
Sustainability
, Vol. 
13
No. 
9
, pp. 
50
-
69
, doi: .
Ertz
,
M.
(
2024
), “
Co-Creation
”,
Encyclopedia
, Vol. 
4
No. 
1
, pp. 
137
-
147
, doi: .
Fava
,
F.
(
2022
), “
Commoning adaptive heritage reuse as a driver of social innovation: Naples and the scugnizzo liberato case study
”,
Sustainability
, Vol. 
14
No. 
1
, pp. 
1
-
16
, doi: .
Gravagnuolo
,
A.
,
Micheletti
,
S.
and
Bosone
,
M.
(
2021
), “
A participatory approach for ‘circular’ adaptive reuse of cultural heritage. Building a heritage community in salerno, Italy
”,
Sustainability
, Vol. 
13
No. 
9
, pp. 
1
-
33
, doi: .
Grcheva
,
O.
,
Vehbi
,
B.O.
,
Carman
,
J.
and
Bakolas
,
A.
(
2021
), “
From public participation to Co-creation in the cultural heritage management decision-making process
”,
Sustainability
, Vol. 
13
, pp. 
1
-
20
.
Gurel
,
E.
and
Tat
,
M.
(
2017
), “
SWOT analysis: a theoretical review
”,
The Journal of International Social Research
, Vol. 
10
, pp. 
994
-
1006
.
Hincapie
,
M.
,
Diaz
,
C.
,
Zapata
,
M.
and
Mesias
,
C.
(
2016
), “
Methodological framework for the design and development of applications for reactivation of cultural heritage
”,
Journal on Computing and Cultural Heritage
, Vol. 
9
No. 
2
, pp. 
1
-
24
, doi: .
Johnston
,
R.
and
Marwood
,
K.
(
2017
), “
Action heritage: research, communities, social justice
”,
International Journal of Heritage Studies
, Vol. 
23
No. 
9
, pp. 
816
-
831
, doi: .
Lee
,
J.-J.
,
Jaatinen
,
M.
,
Salmi
,
A.
,
Mattelmäki
,
T.
,
Smeds
,
R.
and
Holopainen
,
M.
(
2018
), “
Design choices framework for Co-creation projects
”,
International Journal of Design
, Vol. 
12
No. 
2
, pp. 
15
-
31
.
Lee
,
D.
,
Feiertag
,
P.
and
Unger
,
L.
(
2024
), “
Co-production, co-creation or co-design of public space? A systematic review
”,
Cities
, Vol. 
154
, pp. 
1
-
13
, doi: .
Niu
,
S.
,
Lau
,
S.S.Y.
,
Shen
,
Z.
and
Lau
,
S.S.Y.
(
2018
), “
Sustainability issues in the industrial heritage adaptive reuse: rethinking culture-led urban regeneration through Chinese case studies
”,
Journal of Housing and the Built Environment
, Vol. 
33
No. 
3
, pp. 
501
-
518
, doi: .
Pappalardo
,
G.
(
2020
), “
Community-based processes for revitalizing heritage: questioning justice in the experimental practice of ecomuseums
”,
Sustainability
, Vol. 
12
No. 
21
, p.
9270
, doi: .
Phillips
,
R.
and
Stein
,
J.
(
2016
), “
Heritage and community regeneration in northern Ireland: finding points of coalescence in the development planning process
”,
Journal of Community Practice
, Vol. 
24
No. 
1
, pp. 
4
-
17
, doi: .
Pultrone
,
G.
(
2019
), “
Passato e/è futuro nell’implementazione dell'Agenda 2030. Strategie di valorizzazione del patrimonio culturale per i territori fragili
”,
ArcHistoR
, Vol. 
6
No. 
12
, pp. 
488
-
501
.
Rădulescu
,
M.A.
,
Leendertse
,
W.
and
Arts
,
J.
(
2020
), “
Conditions for Co-creation in infrastructure projects: experiences from the overdiepse polder project (The Netherlands)
”,
Sustainability
, Vol. 
12
No. 
18
, pp. 
1
-
24
, doi: .
Swords
,
J.
,
Nally
,
C.
,
Rogage
,
K.
,
Watson
,
R.
,
Charlton
,
J.
and
Kirk
,
D.
(
2021
), “
Colliding epistemologies, productive tensions and useable pasts in the generation of heritage-led immersive experiences
”,
International Journal of Heritage Studies
, Vol. 
27
No. 
2
, pp. 
186
-
199
, doi: .
von der Leyen
,
U.
(
2024
), “
Opening speech by President von der Leyen at the second New European Bauhaus Festival
”,
9 April 2024, Brussels, Belgium, available at:
 https://ec.europa.eu/commission/presscorner/detail/en/speech_24_1926 (
accessed
 21 April 2024).
Wergin
,
C.
(
2021
), “
Healing through heritage?: the repatriation of human remains from European collections as potential sites of reconciliation
”,
Anthropological Journal on European Cultures
, Vol. 
30
No. 
1
, pp. 
123
-
133
, doi: .
Wu
,
H.
and
Hou
,
C.
(
2020
), “
Utilizing co-design approach to identify various stakeholders' roles in the protection of intangible place-making heritage: the case of Guchengping Village
”,
Disaster Prevention and Management: An International Journal
, Vol. 
29
No. 
1
, pp. 
22
-
35
, doi: .
Published by Emerald Publishing Limited. This article is published under the Creative Commons Attribution (CC BY 4.0) licence. Anyone may reproduce, distribute, translate and create derivative works of this article (for both commercial and non-commercial purposes), subject to full attribution to the original publication and authors. The full terms of this licence may be seen at http://creativecommons.org/licences/by/4.0/legalcode

Data & Figures

Figure 1
A three stage workflow chart linking surveys, workshops, analysis steps, and vision outputs.The flowchart is divided into three horizontal stage bands arranged from top to bottom and numbered “1”, “2”, and “3” in circles along the left side. The left column has a light gray background containing stage titles, while the middle and right portions use yellow and darker backgrounds. A dashed vertical rectangle on the right groups final output boxes. In Stage 1, the left box reads “Online survey”. Beneath it are two smaller stacked boxes labeled “Survey 123” and “Story Maps”. A black downward arrow leads from these tools to Stage 2. From the “Online survey” box, a rightward arrow enters the yellow area and connects to a box labeled “Context information”. A second rightward arrow continues to “Pre-identified challenges”. Another rightward arrow leads to the output box “Initial vision statement” inside the dashed right-side panel. A lower branch in Stage 1 begins with a leftward arrow leading from the box “Initial vision statement” to the box “Objectives to realize the vision”. A long horizontal arrow from this box continues rightward to the output box “Pre-selecting digital tools and solutions” inside the dashed panel. In Stage 2, the left box reads “Co-creation workshop”. Beneath it are two smaller stacked boxes labeled “Miro board” and “Zoom”. A black downward arrow beneath these points to Stage 3. From the “Co-creation workshop” box, a rightward arrow connects to “S W O T analysis”, then another arrow connects to “Fishbone Diagram and 5 whys”. A lower Stage 2 branch begins with a leftward arrow from “Fishbone Diagram and 5 whys” to “Challenge slash Objective Library”, then a rightward arrow to “Mission slash Vision Cluster”. A rightward arrow from this box leads to the dashed output panel box labeled “Revised vision statement”. In Stage 3, the left box reads “Output-sharing workshop”. A rightward arrow connects to the box “General debriefing”. A long rightward arrow continues into the dashed output panel to the final box labeled “Pilots co-created strategies”.

Proposed methodological framework for stakeholder requirements analysis and outcomes of each stage. Property of the author(s). Authors' own creation/work

Figure 1
A three stage workflow chart linking surveys, workshops, analysis steps, and vision outputs.The flowchart is divided into three horizontal stage bands arranged from top to bottom and numbered “1”, “2”, and “3” in circles along the left side. The left column has a light gray background containing stage titles, while the middle and right portions use yellow and darker backgrounds. A dashed vertical rectangle on the right groups final output boxes. In Stage 1, the left box reads “Online survey”. Beneath it are two smaller stacked boxes labeled “Survey 123” and “Story Maps”. A black downward arrow leads from these tools to Stage 2. From the “Online survey” box, a rightward arrow enters the yellow area and connects to a box labeled “Context information”. A second rightward arrow continues to “Pre-identified challenges”. Another rightward arrow leads to the output box “Initial vision statement” inside the dashed right-side panel. A lower branch in Stage 1 begins with a leftward arrow leading from the box “Initial vision statement” to the box “Objectives to realize the vision”. A long horizontal arrow from this box continues rightward to the output box “Pre-selecting digital tools and solutions” inside the dashed panel. In Stage 2, the left box reads “Co-creation workshop”. Beneath it are two smaller stacked boxes labeled “Miro board” and “Zoom”. A black downward arrow beneath these points to Stage 3. From the “Co-creation workshop” box, a rightward arrow connects to “S W O T analysis”, then another arrow connects to “Fishbone Diagram and 5 whys”. A lower Stage 2 branch begins with a leftward arrow from “Fishbone Diagram and 5 whys” to “Challenge slash Objective Library”, then a rightward arrow to “Mission slash Vision Cluster”. A rightward arrow from this box leads to the dashed output panel box labeled “Revised vision statement”. In Stage 3, the left box reads “Output-sharing workshop”. A rightward arrow connects to the box “General debriefing”. A long rightward arrow continues into the dashed output panel to the final box labeled “Pilots co-created strategies”.

Proposed methodological framework for stakeholder requirements analysis and outcomes of each stage. Property of the author(s). Authors' own creation/work

Close Figure 1
Figure 2
A SWOT analysis worksheet with instruction panels, sticky notes, and four labeled planning sections.The worksheet is divided into a narrow left column and a wide right section, with all panels outlined by thin gold borders. A long top header across the right section reads “Vision and Mission”. At the upper left is a panel titled “INTRODUCTION”. Inside are small text headings “Objectives:” and “Output:” followed by explanatory paragraphs. Below it is a panel titled “INSTRUCTIONS”. On the left side of this panel is a circular orange diagram labeled around the edge with “Opportunities” at the upper left and “Threats” at the lower left. Inside the circle, the center text reads “Strengths” and “Weaknesses”, with curved arrows around the circle. On the right side are two text paragraphs beginning “Step 01 - Take sticky note and place it under strengths, weaknesses, opportunities or threats”. and “Step 02 - Analyse whether strengths, weaknesses, opportunities or threats can be combine and take the green sticky notes and place them on the white boxes”. Below the instruction panel, four colored sticky-note grids are arranged in two rows and two columns. The upper left grid is titled “STRENGTHS” and contains twelve lavender square notes arranged in four rows and three columns. The upper right grid is titled “WEAKNESSES” and contains twelve pink square notes arranged in four rows and three columns. The lower left grid is titled “OPPORTUNITIES” and contains twelve light green square notes arranged in four rows and three columns. The lower right grid is titled “THREATS” and contains twelve teal square notes arranged in four rows and three columns. The large right section is divided into four equal writing panels arranged in a two-by-two matrix. The upper left panel is titled “Strengths”. Beneath the title, smaller text reads “Internal elements based on the beneficial existing aspects or resource”. The upper right panel is titled “Weaknesses”. Beneath the title, smaller text reads “Internal or existing areas that need to be improved”. The lower left panel is titled “Opportunities”. Beneath the title, smaller text reads “The external trends that you can take advantage of these aren’t actions) but values slash situations that will provide you with possibilities”. The lower right panel is titled “Threats”. Beneath the title, smaller text reads “Threats are external trends that you don’t have control over”.

Adapted SWOT analysis diagram created in Miro board. Property of the author(s). Authors' own creation/work

Figure 2
A SWOT analysis worksheet with instruction panels, sticky notes, and four labeled planning sections.The worksheet is divided into a narrow left column and a wide right section, with all panels outlined by thin gold borders. A long top header across the right section reads “Vision and Mission”. At the upper left is a panel titled “INTRODUCTION”. Inside are small text headings “Objectives:” and “Output:” followed by explanatory paragraphs. Below it is a panel titled “INSTRUCTIONS”. On the left side of this panel is a circular orange diagram labeled around the edge with “Opportunities” at the upper left and “Threats” at the lower left. Inside the circle, the center text reads “Strengths” and “Weaknesses”, with curved arrows around the circle. On the right side are two text paragraphs beginning “Step 01 - Take sticky note and place it under strengths, weaknesses, opportunities or threats”. and “Step 02 - Analyse whether strengths, weaknesses, opportunities or threats can be combine and take the green sticky notes and place them on the white boxes”. Below the instruction panel, four colored sticky-note grids are arranged in two rows and two columns. The upper left grid is titled “STRENGTHS” and contains twelve lavender square notes arranged in four rows and three columns. The upper right grid is titled “WEAKNESSES” and contains twelve pink square notes arranged in four rows and three columns. The lower left grid is titled “OPPORTUNITIES” and contains twelve light green square notes arranged in four rows and three columns. The lower right grid is titled “THREATS” and contains twelve teal square notes arranged in four rows and three columns. The large right section is divided into four equal writing panels arranged in a two-by-two matrix. The upper left panel is titled “Strengths”. Beneath the title, smaller text reads “Internal elements based on the beneficial existing aspects or resource”. The upper right panel is titled “Weaknesses”. Beneath the title, smaller text reads “Internal or existing areas that need to be improved”. The lower left panel is titled “Opportunities”. Beneath the title, smaller text reads “The external trends that you can take advantage of these aren’t actions) but values slash situations that will provide you with possibilities”. The lower right panel is titled “Threats”. Beneath the title, smaller text reads “Threats are external trends that you don’t have control over”.

Adapted SWOT analysis diagram created in Miro board. Property of the author(s). Authors' own creation/work

Close Figure 2
Figure 3
A fishbone analysis worksheet with cause branches, instruction panels, and problem arrowhead.The worksheet is arranged in three areas: a left instruction column, a central fishbone diagram, and a right note panel. At the upper left is a rectangular box titled “INTRODUCTION”. Inside, a paragraph reads: “The fishbone diagram is a cause and effect diagram that identifies many possible causes for an effect or problem. The main problem is displayed at the head of the fish. The main causes are listed at the end of the ‘bones’. The root causes are place under the main causes in the small bones”. Directly below is a rectangular box titled “INSTRUCTIONS”. Three paragraphs are listed in sequence. The first begins “Step 01” and reads: “Take a sticky note from the root causes box and write the answer to the question What does this happen? and place it in the main cause that you think belongs (25 min)”. The second begins “Step 02” and reads: “Look at the whole fishbone diagram and analyse the ‘Main Causes’ with their root causes (3 min)”. The third begins “Step 03” and reads: “Take a circle from the voting box and place it in the root challenge that you consider more urgent to solve (2 min)”. Below this is a tall panel titled “ROOT CAUSES”. At the top are eight orange sticky notes arranged in two rows of four. Their labels read: “Why is this a challenge”?, “What are the changes associated with this”?, “Why does this happen”?, “what are contributing factors “?, “what challenges do we face while addressing this problem”?, “what resource-related problems do we face “?, “what people-related problems do we face “?, and “what environmental-related challenges do we face “?. Beneath these are four rows of blank orange sticky notes arranged in a grid. The center contains a large fishbone diagram. A long horizontal spine extends from left to right and ends in a large yellow triangular arrowhead. Inside the arrowhead, the upper line reads “Problem:” and the lower line reads “What”. Three diagonal bones rise upward from the spine and three diagonal bones descend downward from the spine. At the outer ends of all six diagonal bones are rounded label boxes outlined in yellow. Each of these boxes is labeled “Main Cause”. Short smaller branch lines extend outward from both sides of each diagonal bone. Tiny dark dots appear at the ends of many small branches. Three larger dark circular nodes are placed along the main spine where the major diagonal bones connect. Near the left upper and lower diagonal bones are several orange sticky notes placed beside smaller branches. These notes are labeled “Why ellipsis”? At the upper right is a bordered panel titled “Main causes”. Inside are two pale yellow sticky notes. The upper note reads “Main cause hash 1” and the lower note reads “Main cause hash 2”.

Fishbone diagram designed for stakeholders to identify the main problem and its root causes. Property of the author(s). Authors' own creation/work

Figure 3
A fishbone analysis worksheet with cause branches, instruction panels, and problem arrowhead.The worksheet is arranged in three areas: a left instruction column, a central fishbone diagram, and a right note panel. At the upper left is a rectangular box titled “INTRODUCTION”. Inside, a paragraph reads: “The fishbone diagram is a cause and effect diagram that identifies many possible causes for an effect or problem. The main problem is displayed at the head of the fish. The main causes are listed at the end of the ‘bones’. The root causes are place under the main causes in the small bones”. Directly below is a rectangular box titled “INSTRUCTIONS”. Three paragraphs are listed in sequence. The first begins “Step 01” and reads: “Take a sticky note from the root causes box and write the answer to the question What does this happen? and place it in the main cause that you think belongs (25 min)”. The second begins “Step 02” and reads: “Look at the whole fishbone diagram and analyse the ‘Main Causes’ with their root causes (3 min)”. The third begins “Step 03” and reads: “Take a circle from the voting box and place it in the root challenge that you consider more urgent to solve (2 min)”. Below this is a tall panel titled “ROOT CAUSES”. At the top are eight orange sticky notes arranged in two rows of four. Their labels read: “Why is this a challenge”?, “What are the changes associated with this”?, “Why does this happen”?, “what are contributing factors “?, “what challenges do we face while addressing this problem”?, “what resource-related problems do we face “?, “what people-related problems do we face “?, and “what environmental-related challenges do we face “?. Beneath these are four rows of blank orange sticky notes arranged in a grid. The center contains a large fishbone diagram. A long horizontal spine extends from left to right and ends in a large yellow triangular arrowhead. Inside the arrowhead, the upper line reads “Problem:” and the lower line reads “What”. Three diagonal bones rise upward from the spine and three diagonal bones descend downward from the spine. At the outer ends of all six diagonal bones are rounded label boxes outlined in yellow. Each of these boxes is labeled “Main Cause”. Short smaller branch lines extend outward from both sides of each diagonal bone. Tiny dark dots appear at the ends of many small branches. Three larger dark circular nodes are placed along the main spine where the major diagonal bones connect. Near the left upper and lower diagonal bones are several orange sticky notes placed beside smaller branches. These notes are labeled “Why ellipsis”? At the upper right is a bordered panel titled “Main causes”. Inside are two pale yellow sticky notes. The upper note reads “Main cause hash 1” and the lower note reads “Main cause hash 2”.

Fishbone diagram designed for stakeholders to identify the main problem and its root causes. Property of the author(s). Authors' own creation/work

Close Figure 3
Figure 4
A negotiation worksheet with note grids, agreement areas, goals, tools, and solutions panels.The worksheet is arranged as a collaborative planning canvas with multiple bordered panels on a light grey background. At the upper left is a rectangular box titled “INSTRUCTIONS”. Inside, five numbered steps are listed in sequence. “Step 01” reads, “Reflect on challenges in the previous steps, and some of the objectives and actions given below”. “Step 02” reads, “Negotiate overall objectives for the project and drag them to the negotiation box”. “Step 03” reads, “The points of disagreement can be brought to the orange box below”. “Step 04” reads, “Use the objectives to develop an overall vision plan with three strategic goals for the project”. “Step 05” reads, “Look at the tools that can be used for achieving this given below. Which of these are required? Are any additional tools needed for the workshop”? Below the instruction box, four stacked sticky-note panels are aligned vertically. The first panel is titled “OBJECTIVES slash ACTIONS” and contains eight yellow square sticky notes arranged in two rows of four. The second panel is titled “CHALLENGES” and contains eight orange square sticky notes arranged in two rows of four. The third panel is titled “GOALS” and contains eight pink square sticky notes arranged in two rows of four. The fourth panel is titled “VALUES” and contains eight blue square sticky notes arranged in two rows of four. Across the upper middle is a large rounded rectangular panel headed “Roman numeral 1. Negotiation”. Inside the panel, the sentence reads, “Drag the stickers that represent shared areas of acceptance”. The panel is otherwise blank. Directly below it is a second large rounded rectangular panel filled with pale tan color. Centered near the top is the question, “What areas do you disagree on”? At the upper right is the heading “Roman numeral 3. Results”. Beneath it, large gray italic text reads, “Overall vision statement”. Below this section is the heading “Roman numeral 4. Strategic goals agreed on for the Project”. Smaller text underneath reads, “Drag the tools and solutions from the notes below, that are appropriate for the strategic goals”. Five empty white rectangular boxes are stacked vertically beneath this text. They are labeled in order as “1”, “2”, “3”, “4”, and “5”. At the lower center are two bordered note panels placed side by side. The left panel is titled “Tools”. It contains pale gray sticky notes arranged in two rows. The visible labels include “Participmap”, “Design your heritage”, “Fund 4 act”, “HERicraft”, “Usersense”, “Sustainact”, and “Negodesign”. The right panel is titled “Solutions”. It contains light blue sticky notes arranged in two rows. The visible labels include “Green Integrity Installations”, “Small Scale Pavilion Structure”, “Urban Mobile Furniture”, “Digitally Fabricated Vertical Garden”, “Temporary structures from Recycled Material”, “Virtual Exhibition Archive”, “Projection Mapping on Kinetic Surfaces”, “A R enriched human place interaction”, and “Reactivation of open spaces through N B S”.

Objective/Action cluster model. Property of the author(s). Authors' own creation/work

Figure 4
A negotiation worksheet with note grids, agreement areas, goals, tools, and solutions panels.The worksheet is arranged as a collaborative planning canvas with multiple bordered panels on a light grey background. At the upper left is a rectangular box titled “INSTRUCTIONS”. Inside, five numbered steps are listed in sequence. “Step 01” reads, “Reflect on challenges in the previous steps, and some of the objectives and actions given below”. “Step 02” reads, “Negotiate overall objectives for the project and drag them to the negotiation box”. “Step 03” reads, “The points of disagreement can be brought to the orange box below”. “Step 04” reads, “Use the objectives to develop an overall vision plan with three strategic goals for the project”. “Step 05” reads, “Look at the tools that can be used for achieving this given below. Which of these are required? Are any additional tools needed for the workshop”? Below the instruction box, four stacked sticky-note panels are aligned vertically. The first panel is titled “OBJECTIVES slash ACTIONS” and contains eight yellow square sticky notes arranged in two rows of four. The second panel is titled “CHALLENGES” and contains eight orange square sticky notes arranged in two rows of four. The third panel is titled “GOALS” and contains eight pink square sticky notes arranged in two rows of four. The fourth panel is titled “VALUES” and contains eight blue square sticky notes arranged in two rows of four. Across the upper middle is a large rounded rectangular panel headed “Roman numeral 1. Negotiation”. Inside the panel, the sentence reads, “Drag the stickers that represent shared areas of acceptance”. The panel is otherwise blank. Directly below it is a second large rounded rectangular panel filled with pale tan color. Centered near the top is the question, “What areas do you disagree on”? At the upper right is the heading “Roman numeral 3. Results”. Beneath it, large gray italic text reads, “Overall vision statement”. Below this section is the heading “Roman numeral 4. Strategic goals agreed on for the Project”. Smaller text underneath reads, “Drag the tools and solutions from the notes below, that are appropriate for the strategic goals”. Five empty white rectangular boxes are stacked vertically beneath this text. They are labeled in order as “1”, “2”, “3”, “4”, and “5”. At the lower center are two bordered note panels placed side by side. The left panel is titled “Tools”. It contains pale gray sticky notes arranged in two rows. The visible labels include “Participmap”, “Design your heritage”, “Fund 4 act”, “HERicraft”, “Usersense”, “Sustainact”, and “Negodesign”. The right panel is titled “Solutions”. It contains light blue sticky notes arranged in two rows. The visible labels include “Green Integrity Installations”, “Small Scale Pavilion Structure”, “Urban Mobile Furniture”, “Digitally Fabricated Vertical Garden”, “Temporary structures from Recycled Material”, “Virtual Exhibition Archive”, “Projection Mapping on Kinetic Surfaces”, “A R enriched human place interaction”, and “Reactivation of open spaces through N B S”.

Objective/Action cluster model. Property of the author(s). Authors' own creation/work

Close Figure 4
Figure 5
A worksheet with challenge and objective sticky notes connected by directional arrows.The worksheet is titled “CHALLENGE AND OBJECTIVES slash ACTIONS LIBRARY” in large uppercase text centered at the top. Below the title, two vertical columns of sticky notes are arranged side by side. The left column contains four orange square sticky notes aligned from top to bottom. The right column contains four yellow square sticky notes aligned opposite them. Thin arrows connect selected notes from the left column to notes in the right column. In the left column, the top orange note reads “Challenge 1”. The second orange note reads “Challenge 2”. The third orange note reads “Challenge 3”. The bottom orange note reads “Challenge 4”. In the right column, the top yellow note reads “Objective 1”. The second yellow note reads “Objective 2”. The third yellow note reads “Objective 4”. The bottom yellow note also reads “Objective 4”. A horizontal arrow extends from “Challenge 1” to “Objective 1”. A diagonal arrow descends from “Challenge 1” to the third yellow note labeled “Objective 4”. From “Challenge 3”, a diagonal arrow rises upward to “Objective 2”. Another horizontal arrow extends from “Challenge 3” to the third yellow note labeled “Objective 4”.

Challenges and Objectives/Actions library model. Identified challenges on the left are connected to potential action points on the right. Property of the author(s). Authors' own creation/work

Figure 5
A worksheet with challenge and objective sticky notes connected by directional arrows.The worksheet is titled “CHALLENGE AND OBJECTIVES slash ACTIONS LIBRARY” in large uppercase text centered at the top. Below the title, two vertical columns of sticky notes are arranged side by side. The left column contains four orange square sticky notes aligned from top to bottom. The right column contains four yellow square sticky notes aligned opposite them. Thin arrows connect selected notes from the left column to notes in the right column. In the left column, the top orange note reads “Challenge 1”. The second orange note reads “Challenge 2”. The third orange note reads “Challenge 3”. The bottom orange note reads “Challenge 4”. In the right column, the top yellow note reads “Objective 1”. The second yellow note reads “Objective 2”. The third yellow note reads “Objective 4”. The bottom yellow note also reads “Objective 4”. A horizontal arrow extends from “Challenge 1” to “Objective 1”. A diagonal arrow descends from “Challenge 1” to the third yellow note labeled “Objective 4”. From “Challenge 3”, a diagonal arrow rises upward to “Objective 2”. Another horizontal arrow extends from “Challenge 3” to the third yellow note labeled “Objective 4”.

Challenges and Objectives/Actions library model. Identified challenges on the left are connected to potential action points on the right. Property of the author(s). Authors' own creation/work

Close Figure 5
Figure 6
A location survey form with map interface, marker pin, search bar, and coordinates.The screenshot shows a digital survey form on a beige panel centered between two vertical orange side margins. At the top, a question line reads, “Where are your pilot sites and buildings located? (1)” followed by a small downward arrow icon. Below the question are three circular controls arranged horizontally: a gray trash bin icon, a dark filled circle containing the number “1”, and a dashed circle with a plus sign. Under the controls is instructional text reading, “Multiple locations can be added in a single submission. Click on the “plus” button to add several points”. A second smaller line reads, “Click once on the map to move the pointer. Double click to zoom in”. Below the text is a large interactive map panel showing an aerial satellite view of an urban campus or city block with buildings, roads, trees, and green spaces. Near the center-right of the map is a blue location pin marker placed on a building roof, with a smaller blue dot directly below the pin. At the top of the map is a white search bar labeled “Find address or place” with a magnifying glass icon on the right. Along the left side of the map is a vertical toolbar of square buttons. From top to bottom are a plus sign for zoom in, a minus sign for zoom out, a house icon, a circular target or reset icon, and a fullscreen frame icon. Along the right side of the map near the top are two white square buttons. The upper button shows an expand or fullscreen symbol, and the lower button shows a trash bin icon. At the bottom edge of the map is attribution text including “Maxar, Microsoft, Esri Community Maps Contributors, Esri U K, Esri, HERE, Garmin, Four ellipsis” followed by “Powered by Esri”. Below the map are two white coordinate entry fields. The left field is labeled “Lat:” and displays “53.306982”. The right field is labeled “Lon:” and displays “negative 6.222643”. A thin vertical line with a small circular node runs down the left side of the beige panel.

Questions associated with collecting building/site geolocation data. Property of the author(s). Authors' own creation/work

Figure 6
A location survey form with map interface, marker pin, search bar, and coordinates.The screenshot shows a digital survey form on a beige panel centered between two vertical orange side margins. At the top, a question line reads, “Where are your pilot sites and buildings located? (1)” followed by a small downward arrow icon. Below the question are three circular controls arranged horizontally: a gray trash bin icon, a dark filled circle containing the number “1”, and a dashed circle with a plus sign. Under the controls is instructional text reading, “Multiple locations can be added in a single submission. Click on the “plus” button to add several points”. A second smaller line reads, “Click once on the map to move the pointer. Double click to zoom in”. Below the text is a large interactive map panel showing an aerial satellite view of an urban campus or city block with buildings, roads, trees, and green spaces. Near the center-right of the map is a blue location pin marker placed on a building roof, with a smaller blue dot directly below the pin. At the top of the map is a white search bar labeled “Find address or place” with a magnifying glass icon on the right. Along the left side of the map is a vertical toolbar of square buttons. From top to bottom are a plus sign for zoom in, a minus sign for zoom out, a house icon, a circular target or reset icon, and a fullscreen frame icon. Along the right side of the map near the top are two white square buttons. The upper button shows an expand or fullscreen symbol, and the lower button shows a trash bin icon. At the bottom edge of the map is attribution text including “Maxar, Microsoft, Esri Community Maps Contributors, Esri U K, Esri, HERE, Garmin, Four ellipsis” followed by “Powered by Esri”. Below the map are two white coordinate entry fields. The left field is labeled “Lat:” and displays “53.306982”. The right field is labeled “Lon:” and displays “negative 6.222643”. A thin vertical line with a small circular node runs down the left side of the beige panel.

Questions associated with collecting building/site geolocation data. Property of the author(s). Authors' own creation/work

Close Figure 6
Figure 7
A Europe map interface with marked sites and an open information popup.The screenshot shows an interactive digital map centered on Europe with a light gray basemap displaying country boundaries, coastlines, seas, and city labels. Visible countries include Ireland, United Kingdom, France, Spain, Portugal, Belgium, Netherlands, Germany, Poland, Czechia, Slovakia, Italy, Greece, Ukraine, Belarus, Lithuania, Denmark, and parts of Turkey, North Africa, and western Russia. Major city labels include Dublin, London, Paris, Madrid, Berlin, Warsaw, Rome, Prague, Munich, Turin, Athens, Kyiv, and Copenhagen. Three colored site markers appear on the map. One yellow marker is placed on the east coast of Ireland near Dublin. One multicolored marker is positioned in northern Italy near Turin. One blue-purple marker appears over southern Greece near the Aegean Sea. At the center-right is an open white information popup box connected to the northern Italy marker. The popup title reads “Cine Eleusis”. Below it are bold section headings with text entries. The first heading reads “Ownership” followed by “Owner Municipality of Elefsina”. The second heading reads “Current Situation” followed by text beginning “It’s currently being renovated, it will be activated by a documentary festival during 2023”. The third heading reads “Values” followed by multiple lines beginning “In the past, there used to be 13 cinemas in the city and unfortunately all these cinemas are currently closed. The Municipality has recently bought the abandoned cinema Eleusis and will be activated through a documentary festival introduced by E C o C at th”. The fourth heading reads “Main Stakeholders”. A vertical scrollbar appears along the right side inside the popup, showing additional hidden text. At the top-right corner of the popup are control icons including collapse, resize, and close. Along the bottom edge are “Zoom to” and page navigation controls reading “1 of 5”. At the upper right of the map is a white search bar labeled “Find address or place” followed by a magnifying glass icon and a double-arrow button. At the upper left is a vertical toolbar with a home icon, plus sign, and minus sign. At the lower left is a small menu button. At the lower right is a stacked layers icon. Along the bottom border is attribution text including “F O E N slash Swiss Parks Network, swisstopo, Esri, HERE, Garmin, F A O, N O A A, U S G S” and “Powered by Esri”.

Web map displaying all the buildings/sites to be re-activated in the project. Property of the author(s). Authors' own creation/work

Figure 7
A Europe map interface with marked sites and an open information popup.The screenshot shows an interactive digital map centered on Europe with a light gray basemap displaying country boundaries, coastlines, seas, and city labels. Visible countries include Ireland, United Kingdom, France, Spain, Portugal, Belgium, Netherlands, Germany, Poland, Czechia, Slovakia, Italy, Greece, Ukraine, Belarus, Lithuania, Denmark, and parts of Turkey, North Africa, and western Russia. Major city labels include Dublin, London, Paris, Madrid, Berlin, Warsaw, Rome, Prague, Munich, Turin, Athens, Kyiv, and Copenhagen. Three colored site markers appear on the map. One yellow marker is placed on the east coast of Ireland near Dublin. One multicolored marker is positioned in northern Italy near Turin. One blue-purple marker appears over southern Greece near the Aegean Sea. At the center-right is an open white information popup box connected to the northern Italy marker. The popup title reads “Cine Eleusis”. Below it are bold section headings with text entries. The first heading reads “Ownership” followed by “Owner Municipality of Elefsina”. The second heading reads “Current Situation” followed by text beginning “It’s currently being renovated, it will be activated by a documentary festival during 2023”. The third heading reads “Values” followed by multiple lines beginning “In the past, there used to be 13 cinemas in the city and unfortunately all these cinemas are currently closed. The Municipality has recently bought the abandoned cinema Eleusis and will be activated through a documentary festival introduced by E C o C at th”. The fourth heading reads “Main Stakeholders”. A vertical scrollbar appears along the right side inside the popup, showing additional hidden text. At the top-right corner of the popup are control icons including collapse, resize, and close. Along the bottom edge are “Zoom to” and page navigation controls reading “1 of 5”. At the upper right of the map is a white search bar labeled “Find address or place” followed by a magnifying glass icon and a double-arrow button. At the upper left is a vertical toolbar with a home icon, plus sign, and minus sign. At the lower left is a small menu button. At the lower right is a stacked layers icon. Along the bottom border is attribution text including “F O E N slash Swiss Parks Network, swisstopo, Esri, HERE, Garmin, F A O, N O A A, U S G S” and “Powered by Esri”.

Web map displaying all the buildings/sites to be re-activated in the project. Property of the author(s). Authors' own creation/work

Close Figure 7
Table 1

Summary of the results of the SWOT analysis for Eleusis stakeholders

Vision:
Heritage buildings and public spaces: how all these spaces that will be activated during the ECoC year will be maintained and remain operating and sustainable. Establish a cultural strategy/initiating bottom up approaches. Implementing NEB values/Create all year round activities
Strengths
Eleusis boasts multifunctional spaces, all owned by the Ministry of Environment and proximal to one another, thus possessing a large capacity for events. Moreover, these spaces are imbued with intangible cultural heritage and are home to active cultural associations, enabling them to attract diverse audiences
Weaknesses
Eleusis faces political challenges and coordination issues due to its various locations and differing needs, resulting in inconsistent funding and a lack of continuous operation. Insufficient infrastructure and accessibility challenges from Athens further hinder its progress
Opportunities
Eleusis has the potential to improve its environmental conditions and well-being, utilise its intangible historical assets, and leverage its industrial heritage to develop best practices. The city could explore the possibility of industries serving as funders, build upon the evolution of the European Capital of Culture legacy, and establish fully operational cultural spaces
Threats
This includes political obstacles, a lack of interest leading to underutilisation, and limited accessibility to the city, which pose significant challenges. Additionally, Eleusis faces general financing challenges for CCIs (Cultural and Creative Industries), and the impact of the climate crisis, such as increased temperatures and adverse weather conditions affecting the usability of outdoor spaces, cannot be ignored

Source(s): Authors’ own creation/work

Table 2

Summary of the results of the SWOT analysis for Milan stakeholders

Vision
From the cascina’s perspective, assets and initiatives are of added value for them. At the neighbourhood level, a proper governance model enables the solutions to be maintained and initiatives to be organised after the project. At the city level, models and lessons learned
Strengths
Milan benefits from active and running businesses and offers diverse activities, including education, farming, and social cohesion initiatives
Weaknesses
Milan faces a lack of resources in terms of time, budget and skills, as well as accessibility challenges within the sites and neighbourhoods
Opportunities
Milan has established collaborations and potential future collaborations, with a growing interest in the role and activities of cascina (historic agricultural estates)
Threats
The city grapples with accessibility issues for both the sites and the neighbourhood, bureaucracy, and the protected status of the buildings, along with the availability and openness of potential stakeholders

Source(s): Authors’ own creation/work

Table 3

Summary of the results of the SWOT analysis for Ballina stakeholders

Vision
To demonstrate by education, engagement, collaboration and demonstration the key role of cultural heritage, architectural conservation and adaptive reuse in creating a sense of place and social cohesion to empower and facilitate all stakeholders to realise the potential of the historic assets they have to be utilised for community benefit and a better way of life
Strengths
Ballina boasts a compact, authentic historic town core with built and natural heritage. Active street frontages with independent retailers and pedestrian permeability contribute to its charm. Engaged stakeholders and voluntary inter-generational groups are also notable strengths
Weaknesses
Ballina suffers from high vacancy levels and dereliction, along with a lack of data on the tenure and use of properties. The prevalence of car usage is another weakness that needs to be addressed
Opportunities
Ballina has opportunities to revitalise itself by mapping data on vacant structures to inform revitalisation efforts. Utilising historic structures and their surroundings for events and installations could breathe new life into the town. Leveraging shifts in work culture to promote environmental and societal benefits is another significant opportunity. There’s also potential for increasing diversity and inclusivity through community engagement
Threats
The town faces continued dereliction and potential demolition of historic structures, as well as socio-economic stratification within the community. Increased risk of climate-related damage to the historic core poses another threat

Source(s): Authors’ own creation/work

Supplements

References

Arlotta
,
A.I.
(
2020
), “
Locating heritage value in building material reuse
”,
Journal of Cultural Heritage Management and Sustainable Development
, Vol. 
10
No. 
1
, pp. 
6
-
15
,
Emerald Group Holdings Ltd.
, doi: .
Avram
,
G.
,
Ciolfi
,
L.
and
Maye
,
L.
(
2020
), “
Creating tangible interactions with cultural heritage: lessons learned from a large scale, long term co-design project
”,
CoDesign
, Vol. 
16
No. 
3
, pp. 
251
-
266
,
Taylor & Francis
, doi: .
Buthke
,
J.
,
Larsen
,
N.M.
,
Pedersen
,
S.O.
and
Bundgaard
,
C.
(
2020
), “
Adaptive reuse of architectural heritage
”, In
Gengnagel
,
C.
,
Baverel
,
O.
,
Burry
,
J.
,
Ramsgaard Thomsen
,
M.
and
Weinzierl
,
S.
(Eds),
Impact: Design With All Senses
,
DMSB 2019, Springer
,
Cham
, doi: .
Chandler
,
A.
and
Pace
,
M.
(
2019
),
The Production of Heritage: The Politicisation of Architectural Conservation
, (1st ed.) ,
Routledge
,
New York
.
Egusquiza
,
A.
,
Zubiaga
,
M.
,
Gandini
,
A.
,
De Luca
,
C.
and
Tondelli
,
S.
(
2021
), “
Systemic innovation areas for heritage-led rural regeneration: a multilevel repository of best practices
”,
Sustainability
, Vol. 
13
No. 
9
, pp. 
50
-
69
, doi: .
Ertz
,
M.
(
2024
), “
Co-Creation
”,
Encyclopedia
, Vol. 
4
No. 
1
, pp. 
137
-
147
, doi: .
Fava
,
F.
(
2022
), “
Commoning adaptive heritage reuse as a driver of social innovation: Naples and the scugnizzo liberato case study
”,
Sustainability
, Vol. 
14
No. 
1
, pp. 
1
-
16
, doi: .
Gravagnuolo
,
A.
,
Micheletti
,
S.
and
Bosone
,
M.
(
2021
), “
A participatory approach for ‘circular’ adaptive reuse of cultural heritage. Building a heritage community in salerno, Italy
”,
Sustainability
, Vol. 
13
No. 
9
, pp. 
1
-
33
, doi: .
Grcheva
,
O.
,
Vehbi
,
B.O.
,
Carman
,
J.
and
Bakolas
,
A.
(
2021
), “
From public participation to Co-creation in the cultural heritage management decision-making process
”,
Sustainability
, Vol. 
13
, pp. 
1
-
20
.
Gurel
,
E.
and
Tat
,
M.
(
2017
), “
SWOT analysis: a theoretical review
”,
The Journal of International Social Research
, Vol. 
10
, pp. 
994
-
1006
.
Hincapie
,
M.
,
Diaz
,
C.
,
Zapata
,
M.
and
Mesias
,
C.
(
2016
), “
Methodological framework for the design and development of applications for reactivation of cultural heritage
”,
Journal on Computing and Cultural Heritage
, Vol. 
9
No. 
2
, pp. 
1
-
24
, doi: .
Johnston
,
R.
and
Marwood
,
K.
(
2017
), “
Action heritage: research, communities, social justice
”,
International Journal of Heritage Studies
, Vol. 
23
No. 
9
, pp. 
816
-
831
, doi: .
Lee
,
J.-J.
,
Jaatinen
,
M.
,
Salmi
,
A.
,
Mattelmäki
,
T.
,
Smeds
,
R.
and
Holopainen
,
M.
(
2018
), “
Design choices framework for Co-creation projects
”,
International Journal of Design
, Vol. 
12
No. 
2
, pp. 
15
-
31
.
Lee
,
D.
,
Feiertag
,
P.
and
Unger
,
L.
(
2024
), “
Co-production, co-creation or co-design of public space? A systematic review
”,
Cities
, Vol. 
154
, pp. 
1
-
13
, doi: .
Niu
,
S.
,
Lau
,
S.S.Y.
,
Shen
,
Z.
and
Lau
,
S.S.Y.
(
2018
), “
Sustainability issues in the industrial heritage adaptive reuse: rethinking culture-led urban regeneration through Chinese case studies
”,
Journal of Housing and the Built Environment
, Vol. 
33
No. 
3
, pp. 
501
-
518
, doi: .
Pappalardo
,
G.
(
2020
), “
Community-based processes for revitalizing heritage: questioning justice in the experimental practice of ecomuseums
”,
Sustainability
, Vol. 
12
No. 
21
, p.
9270
, doi: .
Phillips
,
R.
and
Stein
,
J.
(
2016
), “
Heritage and community regeneration in northern Ireland: finding points of coalescence in the development planning process
”,
Journal of Community Practice
, Vol. 
24
No. 
1
, pp. 
4
-
17
, doi: .
Pultrone
,
G.
(
2019
), “
Passato e/è futuro nell’implementazione dell'Agenda 2030. Strategie di valorizzazione del patrimonio culturale per i territori fragili
”,
ArcHistoR
, Vol. 
6
No. 
12
, pp. 
488
-
501
.
Rădulescu
,
M.A.
,
Leendertse
,
W.
and
Arts
,
J.
(
2020
), “
Conditions for Co-creation in infrastructure projects: experiences from the overdiepse polder project (The Netherlands)
”,
Sustainability
, Vol. 
12
No. 
18
, pp. 
1
-
24
, doi: .
Swords
,
J.
,
Nally
,
C.
,
Rogage
,
K.
,
Watson
,
R.
,
Charlton
,
J.
and
Kirk
,
D.
(
2021
), “
Colliding epistemologies, productive tensions and useable pasts in the generation of heritage-led immersive experiences
”,
International Journal of Heritage Studies
, Vol. 
27
No. 
2
, pp. 
186
-
199
, doi: .
von der Leyen
,
U.
(
2024
), “
Opening speech by President von der Leyen at the second New European Bauhaus Festival
”,
9 April 2024, Brussels, Belgium, available at:
 https://ec.europa.eu/commission/presscorner/detail/en/speech_24_1926 (
accessed
 21 April 2024).
Wergin
,
C.
(
2021
), “
Healing through heritage?: the repatriation of human remains from European collections as potential sites of reconciliation
”,
Anthropological Journal on European Cultures
, Vol. 
30
No. 
1
, pp. 
123
-
133
, doi: .
Wu
,
H.
and
Hou
,
C.
(
2020
), “
Utilizing co-design approach to identify various stakeholders' roles in the protection of intangible place-making heritage: the case of Guchengping Village
”,
Disaster Prevention and Management: An International Journal
, Vol. 
29
No. 
1
, pp. 
22
-
35
, doi: .

Languages

or Create an Account

Close subscription notice
Close access options