

This study aims to explore how financial factors affect both conventional and Islamic stock market indices of G7 countries from July 27, 2015, to February 29, 2024.
It examines local factors like CDS, exchange rates and bond yields, along with global ones such as USCDS, VIX, OVX and MSCI, using the innovative MM-QR method to identify any asymmetric effects on stock market returns during bull, bear and normal market phases.
The findings suggest that CDS has a more pronounced negative impact on the conventional index compared to the Islamic index. While 10-year bond yields generally have a positive influence on both indices, except during bullish phases in Islamic markets. Exchange rates tend to negatively correlate with stock returns in both markets, except for a specific quarter in conventional markets. USCDS has a positive relationship with both conventional and Islamic indexes. The MSCI World Index has a significant positive effect on both markets, while VIX negatively affects the conventional market but tends to be positive in Islamic markets during bear and normal market conditions. OVX indicates that adverse news from the global oil market negatively impacts both conventional and Islamic stock markets.
Previous research has overlooked the comparative analysis, focusing solely on either Islamic or conventional equities. Therefore, the study initiates by analyzing how changes in financial factors affect Islamic equity returns within the G7 nations, with a parallel investigation into whether these effects align with those observed in conventional equity markets.
1. Introduction
Understanding how financial factors affect the stock market is crucial for both domestic and foreign investors looking to diversify their investments and reduce risk. Diversification stands as a cornerstone principle in portfolio management, serving as a crucial aspect in investment decision-making. Achieving effective diversification in a portfolio necessitates a comprehension of the long-term relationships among financial assets to mitigate investment risk.
Some investors prefer Islamic financial markets over conventional ones because Islamic financial products do not rely on interest-based debt contracts. Instead, they prioritize asset-backed transactions and adhere to the principle of risk-sharing. Therefore, investors and portfolio managers are increasingly interested in incorporating Islamic products into their portfolios. Islamic securities hold significance due to their distinct behavior, with reports indicating differences in sensitivity compared to conventional instruments (Narayan and Phan, 2017; Rahim and Masih, 2016). From the discussion above, it can be confidently asserted that Islamic finance is primarily oriented towards the real economy. In contrast conventional finance covers a broader spectrum of financial activities, some of which may not have direct connections to real economic transactions.
Through investigating how various financial factors impact Islamic and conventional stocks disparately, the study seeks to identify opportunities for diversification. For instance, certain factors may exert a greater influence on one type of stock over the other, enabling investors to optimize portfolio diversification more effectively. This study investigates the impact of both local and global financial factors on the returns of Islamic and conventional stock indices, with the goal of identifying opportunities for diversification between these investment types. Additionally, analyzing how different local (CDS, exchange rate, bond yield) and global (USCDS, MSCI word index, VIX, OVX) financial factors affect each type of stock enables investors to better anticipate market trends and make informed investment choices.
Oil indeed plays a crucial role in driving global economies, irrespective of their level of development. Its influence spans across both conventional and faith-based financial systems, exerting significant impacts on global markets. Studies exploring the influence of oil on stock markets in the United States have been conducted by various researchers, including Alsalman (2016), Godil et al. (2022), Tuna et al. (2021), Bai and Koong (2018), Ashraf et al. (2020), Fama (1981), Chen et al. (1986) and Barro (1990). Investigations on Japan, Canada and European countries include those of Mukherjee and Naka (1995), Cheung and Ng (1998) and Nasseh and Strauss (2000), Shahzad et al. (2018a, b). Research on the BRICS nations by Boubaker and Raza (2017), Ansari and Sensarma (2019), Fang and You (2014) and Chen and Lv (2015) primarily focuses on the conventional stock market, without addressing or comparing the Islamic index. Setiawan et al.'s (2022) study is notable among research on G7 countries but it concentrates on the Islamic index, without incorporating or contrasting it with the conventional index.
VIX plays a crucial role in financial markets, providing valuable information to investors, traders and policymakers alike. Central banks and policymakers around the world monitor the VIX because it provides insights into market expectations and risk sentiment. High levels of volatility, as reflected by the VIX, can indicate uncertainty and potential instability in financial markets. A substantial body of literature has examined the relationship between the VIX and returns in conventional stock markets, as evidenced by studies such as Mensi et al. (2014), Cheuathonghua et al. (2019) and Chandra and Thenmozhi (2015). However, comparatively fewer studies have specifically addressed the relationship between the VIX and returns in Islamic stock markets. Examples of such studies include Kumar and Sahu (2017), Hammoudeh et al. (2014), Karim et al. (2022) and Naifar (2016). Nevertheless, research that directly compares the impact of the VIX on Islamic and conventional stock market returns remains scarce.
There is limited research that directly compares the influence of different factors on Islamic and conventional stock returns, as explored by Dewandaru et al. (2014) through dynamic heterogeneous panel techniques. However, it’s worth noting that while Dewandaru’s study focused on macroeconomic variables rather than financial ones. Similarly, another study by Godil et al. (2022) investigated the influence of financial factors on conventional and Islamic stock indices but was limited to the USA. So, our aim is to assess the impact of different financial factors (CDS, bond yield, exchange rate, USCDS, OIL, VIX, OVX) on Islamic stocks of G7 countries using the MM-QR approach. Subsequently, we will compare the findings with those observed in conventional stocks. Our paper contributes to current literature in the following aspects.
First, the study initiates by analyzing how changes in financial factors affect Islamic equity returns within the G7 nations, with a parallel investigation into whether these effects align with those observed in conventional equity markets. Previous research has overlooked this comparative analysis, focusing solely on either Islamic or conventional equities. For instance, Shahzad et al. (2018a, b) examined the impact of oil prices on Islamic equity, a direct comparison with conventional equity was absent, while Hassan et al. (2020) compared financial factor impacts on Islamic and conventional equities but concentrated on emerging markets such as BRICS, neglecting advanced economies. Indeed, it is noteworthy to compare the effects of financial factors on Islamic and conventional equity within advanced economies such as the G7 nations. Such a comparison would offer valuable insights into the similarities and differences in the behavior of these two types of equities in highly developed financial markets.
Second, from a methodological standpoint, this study explores the nexus between financial factors and equity index (both Islamic and conventional) of G7 using novel Method of Moment Quantile Regression (MM-QR) approach. It aims to determine whether there exist significant differences in the impact of these factors on Islamic and conventional equity indices. The novel MM-QR method outperforms linear panel techniques as it gives empirical insights considering the distributional diversity of the relationship between variables. Moreover, MM-QR is particularly suitable for analyzing asymmetric associations between independent variables (such as CDS, E/R, 10-year bond yield, USCDS, VIX, OVX) and dependent variables (Islamic and conventional equity indices). Notably, to the best of the researcher’s knowledge, the MM-QR approach has not been concurrently tested for comparing the impact of financial factors on Islamic and conventional indices. As a result, the study adopts appropriate econometric methods to address this research gap effectively.
The remainder of this paper is organized as follows. The second section provides a review of the existing literature. Section three outlines the data and variables used in the study. The fourth section details the methodology. The fifth section presents the empirical findings and discussion. Finally, section six offers the conclusion.
2. Literature review
Given the focus of our study, special attention is given to literature on the financial factors and stock market relationships.
Credit default swaps (CDS) are fundamental credit derivative instruments in stock markets, often likened to insurance protecting creditors' receivables. Elevated CDS levels suggest growing default risk in the economy, typically indicating a negative correlation with the stock market, according to Coronado et al. (2012). As the most liquid credit derivative in the market, CDS tend to react swiftly to new credit risk information, outpacing other instruments in this regard. Numerous studies have delved into the correlation between CDS and conventional stock market returns. However, research examining the connection between CDS and Islamic stock indices is notably limited in comparison (Aman, 2019; Chan-Lau and Kim, 2004; Kang and Yoon, 2018; Shahzad et al., 2018a, b; Yang et al., 2018). Hachicha et al. (2022) conduct a detailed examination of hedging instruments aimed at hedging both the conventional and Islamic stock market returns of the Dow Jones index. Through a rolling-window analysis, they discovered a notably strong and positive correlation between the Emerging Markets and CDS, as well as between the Emerging Markets Islamic index and CDS. In a related vein, Aloui et al. (2015) explore the relationship between macroeconomic factors and Islamic stocks in Gulf Cooperation Council countries spanning from July 10, 2008, to July 13, 2013. Employing a DCCX-MGARCH model, their findings suggest that the US CDS serves as a significant global macroeconomic factor with positive effects on the Islamic stock index. Moreover, Wahyudi and Sani (2014) examine the relationship between the Jakarta Islamic Index (JII) returns and macroeconomic variables. Their analysis, employing the VAR Toda-Yamamoto causality test reveals that the VIX index and exchange rate significantly influence the Islamic stock markets in Indonesia. Another notable research of Naifar (2016) explores the interdependence between Dow Jones Islamic Market Index returns and international risk factors from January 2003 to October 2014. Employing the quantile regression approach, the study finds that the Volatility Index has significantly negative effects, while the US CDS has significantly positive effects on Dow Jones Islamic Market Index. However, Hammoudeh et al. (2014) examine the disparities between equity markets within conventional and Islamic financial frameworks from January 4, 1999, to July 22, 2013. Employing a copula approach, their findings indicate that the Dow Jones Islamic Market Index exhibits a negative average dependence on the Volatility Index.
The exchange rate and interest rate plays a vital role in navigating the local economic landscape. While fluctuations in exchange rates can have adverse effects on certain industries, they may prove beneficial for others (Gokmenoglu et al., 2021). There is ongoing debate within the literature regarding the interconnection between exchange rates and stock market return. Empirically, various studies present conflicting findings with some indicating a positive correlation (Ghumro et al., 2022; Reyes Guzman et al., 2023; Hashmi and Chang, 2021; Mechri et al., 2019; Barakat et al., 2016; Chandrashekar, 2018) and others suggesting a negative one (Bhargava and Konku, 2023; Chellaswamy et al., 2020; Zhu et al., 2022; Tsai, 2012; Mishra, 2016; Boako et al., 2016; Khan and Khan, 2018; Chkili and Nguyen, 2014; Ali et al., 2020; Alam and Rashid, 2014).
Numerous studies have investigated the connection between stock market returns, exchange rates and interest rates. However, there is a paucity of research that specifically investigates into the utilization of quantile regression methodology (Mechri et al., 2019; Ali et al., 2020; Chellaswamy et al., 2020; Tsai, 2012; Mishra, 2016; Boako et al., 2016, Shahzad, 2019) to explore the interplay among these factors. Ali et al. (2020), Chellaswamy et al. (2020), Tsai (2012), Boako et al. (2016) and Mishra (2016) employ quantile regression models to explore the correlation between the stock market and exchange rates. Their findings consistently reveal a significant negative influence of exchange rate fluctuations on stock market returns.
Another study of Gokmenoglu et al. (2021) examines the impact of the E/R on the stock index for the selected developing market economies. Applying Quantile-on-Quantile approach result indicates that significant E/R shocks are presented in some circumstances such as in case of bearish phase E/R shocks influence the stock market index return. Shahzad (2019) examines the relationship between fluctuations in 10-year government bond yields and stock market returns across developed nations, utilizing the quantile-on-quantile approach. Their findings suggest that there exists a predominantly positive correlation between interest rates and stock market.
Lou and Luo (2017) investigate the link between the stock price indices and exchange rates for G7 countries. By employing Granger causality test in quantiles, they find that there is a bidirectional link among the exchange rate and stock price index and in Canada, USA and Italy, on the other hand the link is unidirectional in case of France, Japan, Germany and UK. Another study by Habibi and Lee (2019) examines the influences of exchange rates on stock market return in G7. After utilizing ARDL model finds that the exchange rate changes in all G7 countries have short-run asymmetric effects on stock return. A recent research by Ashraf et al. (2020) investigates how macroeconomic factors affect returns in both conventional and Islamic stock market indices across emerging countries. They utilized panel data estimation methods for their analysis. Their findings suggest that both exchange rates and interest rates influence on both conventional and Islamic stock indices.
Oil is a vital component in driving global economies, regardless of their level of development. Its influence extends across both conventional and faith-based economic models, affecting global markets significantly. Within Islamic economies or financial markets, the importance of oil is even more pronounced, as many major oil-producing nations adhere to Islamic principles. This adherence fosters a shared risk among these nations, particularly during economic downturns and periods of financial instability.
A large body of literature exists, describing the relationships between crude oil and stock markets in developing and emerging economies (Hassan et al., 2020; Ahmed, 2018; Chau et al., 2014; Aun, 2014). But only a small proportion of literature focuses on these relationships in case of developed countries (Shahzad et al., 2018a, b; Setiawan et al., 2022).
Hassan et al. (2020) compared financial factor impacts on Islamic and conventional equities by concentrating on emerging markets such as BRICS using TGARCH method and found that in all five countries, crude oil is the net transmitter of volatility to both Islamic and conventional stocks.
Using the same technique, Chau et al. (2014) investigate how Arab World have affected by political uncertainty and its subsequent impact on MENA stock markets. Their findings suggest that the volatility in these markets, particularly in Islamic indices, has been exacerbated by the political turbulence.
Ahmed (2018) conducted an analysis utilizing dynamic panel GMM techniques to evaluate how political risk affects Sharia-compliant and conventional stocks in developed and developing economies separately. The study revealed that in developed countries, average fluctuations in interest rates and exchange rates exhibit a negative correlation.
Moreover, Aun (2014) also investigates the influence of macroeconomic shifts on Islamic and conventional indices of developed and emerging. It is discovered that Islamic indices exhibit a notable impact compared to conventional ones. Additionally, Islamic indices demonstrate a swifter adjustment to equilibrium.
In another research of Shahzad et al. (2018a, b), the association between five Islamic stock markets (comprising the Islamic Financials sector index, Islamic Market World index, Islamic indices of the Japan, USA and UK) and the oil market is investigated using the copula method. Their findings revealed a noteworthy positive lower tail dependence between oil and four of the five Islamic stock markets, specifically the DJIM, US, UK and Japan markets. Additionally, Godil et al. (2020) investigate the influence of oil prices on both Islamic and conventional stocks. They conducted this analysis using monthly returns data from the Dow Jones Islamic Market and Dow Jones Conventional Market Indexes, employing the QARDL Model. Their findings revealed an inverse relationship between oil prices and Islamic stocks during bullish trends, whereas a positive relationship was observed between oil prices and conventional stocks. Similarly, another most recent study by Godil et al. (2022) examines the short- and long-run relationships, and impulsive response effect of energy resources and precious metals on conventional and Islamic stocks through the Dynamic stimulated autoregressive distributed lag error correction model and found that crude oil has an insignificant impact on both the Islamic and conventional index. Alsalman (2016) investigates how oil price uncertainty impacts US real stock returns, both in aggregate and across sectors. The results of the estimation indicate that there is no statistically significant impact of oil price volatility on U.S. stock returns. Setiawan et al. (2022) also use GARCH methods to analyzes the behavior of financial assets through risk and return in stock markets of Muslim-majority countries and G7. The commodity, oil, US 10-year bonds are negatively affected by the total number of cases of Covid-19, meaning that when the number of cases is higher, the prices are lower.
The dynamic interactions between real oil prices, changes in exchange rates and stock market returns in both China and the United States are examined by Bai and Koong (2018) using the diagonal BEKK model. They find that oil prices show a significant and positive response to movements in the stock market. Additionally, there is a significant and negative relationship between the both stock markets and the exchange rate.
VIX plays a crucial role in financial markets, providing valuable information to investors, traders and policymakers alike. Central banks and policymakers around the world monitor the VIX because it provides insights into market expectations and risk sentiment. High levels of volatility, as reflected by the VIX, can indicate uncertainty and potential instability in financial markets.
There is a substantial body of literature examining the relationship between the effects of the VIX (Volatility Index) on Islamic and conventional stock market returns (Nazlioglu et al., 2015; Karim et al., 2022; Godil et al., 2019). Nazlioglu et al. (2015) find robust evidence of volatility transmission between the Dow Jones Islamic and conventional equities markets in the US, Europe and Asia throughout and after the financial crisis. Their findings highlight the contagious nature of these stock markets.
In the study of Karim et al. (2022) examine the asymmetric response of major Islamic and conventional stock returns to implied volatility, employing an asymmetric QRM approach. Their findings reveal that implied volatility indices have a significantly lesser impact on Islamic indices compared to conventional ones, with the exception of the FTSE Sharia index across various investment horizons.
Additionally, Godil et al. (2019) investigate the impact of oil prices and financial risk on Islamic and conventional stocks using the Newey–West HAC test. Their findings indicate a negative relationship between oil prices, financial risk and both types of stocks.
3. Data
The data we possess includes daily records of major conventional and Islamic stock return indices. Furthermore, we integrate three country-specific factors: credit default swaps, 10-year bond yields and exchange rates (where the US exchange rate is depicted by the dollar index as a proxy). We also have incorporated global factors such as the USCDS, the Morgan Stanley Capital International (MSCI) World Index, as well as volatility gauges like the CBOE Volatility Index (VIX) and Oil Volatility index (OVX). Country-level CDS spreads are sourced from DataStream, while exchange rates, 10-year bond yields, USCDS, the MSCI World Index, VIX and OVX, are acquired from investing.com. We analyze daily data covering the period from July 27, 2015, to February 29, 2024, for G7 nations, excluding observations from weekends (Saturday and Sunday). We have selected this timeframe based on the availability of data. In our empirical study, we concentrate on the first difference in the natural logarithmic series of each variable. Moreover, this study employs statistical software like Stata 16 and EViews 12 for data analysis.
Islamic stock indices for G7 countries are S&P/TSX 60 Shariah-GSPTXSI (Canada), Dow Jones Islamic Market UK-DJIUK (UK), Dow Jones Islamic Market Japan-DJIJP (Japan), and Dow Jones Islamic Market US-IMUS (U.S.), Dow Jones Islamic Market Europe-DJIEU. We resort to using DJIEU as a proxy for France, Italy and Germany, due to the unavailability of Islamic stock indices for those countries.
Daily major conventional stock market index data is gathered from investing.com. The stock indices are CAC 40 (France), S&P/TSX Composite (Canada), JASDAQ (Japan), Dow Jones Composite Average (United States), Italy 40 (Italy), UK 100 (United Kingdom), and Euro Stoxx 50 (Germany). Major Islamic and conventional stock market index for G7 nations and the local and global financial factors presents in Tables 1 and 2.
Major Islamic and conventional stock market index for G7 nations
| Country | Conventional stock index | Data source | Islamic stock index | Data source |
|---|---|---|---|---|
| Canada | S&P/TSX Composite | investing.com | S&P/TSX 60 Shariah-GSPTXSI | investing.com |
| UK | UK 100 | Dow Jones Islamic Market UK-DJIUK | ||
| Japan | JASDAQ | Dow Jones Islamic Market Japan-DJIJP | ||
| US | Dow Jones Composite Average | Dow Jones Islamic Market US-IMUS | ||
| Italy | Italy 40 | Dow Jones Islamic Market Europe-DJIEU | ||
| Germany | Euro Stoxx 50 | Dow Jones Islamic Market Europe-DJIEU | ||
| France | CAC 40 | Dow Jones Islamic Market Europe-DJIEU |
Note(s): Above are the Islamic and conventional stock indices of G7 utilized in our study, along with the respective data sources from which we gathered the index
Source(s): Created by the authors
The selected local and global financial factors
| Variables | Local/Global | Indictor | Data source |
|---|---|---|---|
| Credit default swaps | Local variable | CDS_ret | DataStream |
| 10-year bond yields | Local variable | BONDY_ret | investing.com |
| Exchange rates | Local variable | E/R_ret | investing.com |
| US credit default swap | Global variable | USCDS_ret | investing.com |
| The MSCI World Index | Global variable | MSCIW_ret | investing.com |
| Volatility index | Global variable | VIX_ret | investing.com |
| Oil volatility index | Global variable | OVX_ret | investing.com |
Note(s): The local and global financial factors we have used in our study is given above
Source(s): Created by the authors
We present the descriptive statistics, cross-section dependence test, panel unit root tests and unit root tests of all variables for G7 in Tables 3-6 respectively.
Descriptive statistics
| CON_ret | ISLAMIC_ret | CDS_ret | BONDY_ret | E?R_ret | USCDS_ret | MSCIW_ret | VIX_ret | OVX_ret | |
|---|---|---|---|---|---|---|---|---|---|
| Mean | 0.004733 | −0.007781 | 0.00073 | −0.31911 | −0.001734 | 2.934387 | −0.00823 | −0.0217 | 3.60369 |
| Median | 0.026525 | 0.061788 | 0.001263 | 0.09531 | −0.002304 | 2.897568 | 0.074012 | −0.0625 | 3.56105 |
| Maximum | 0.578261 | 0.593574 | 1.470176 | 1.301009 | 0.255238 | 3.295096 | 0.554007 | 1.90652 | 5.78429 |
| Minimum | −0.69689 | −0.904414 | −1.53157 | −6.90776 | −0.238985 | 2.297573 | −0.64535 | −1.5663 | 2.88256 |
| Std. Dev | 0.185892 | 0.251498 | 0.461338 | 1.295229 | 0.067463 | 0.194297 | 0.224904 | 0.53436 | 0.35521 |
| Skewness | −0.603622 | −0.929693 | 0.092908 | −1.59471 | 0.04471 | −0.153879 | −0.87324 | 0.25236 | 1.76631 |
| Kurtosis | 3.760314 | 3.365962 | 3.000793 | 5.527391 | 3.397833 | 3.144692 | 2.939031 | 3.05108 | 8.37314 |
| Jarque–Bera | 757.721*** | 1336.84*** | 12.85323*** | 6164.49*** | 61.89289*** | 43.05109*** | 1136.804*** | 95.7999*** | 15392.6*** |
Note(s): *** shows 1% level of significance
Source(s): Created by the authors
Unit root test for invariant variable
| Phillips–Perron test | ||
|---|---|---|
| Variable | Intercept | Intercept and trend |
| MSCI_RET | −331.125*** | −331.009*** |
| USCDS_RET | −38.6836*** | −39.1092*** |
| VIX_RET | −300.606*** | −300.474*** |
| OVX_RET | −41.4702*** | −41.4586*** |
Note(s): *** indicates 1% level of significance
Source(s): Created by the authors
Table 3 presents the summary statistics of the variables across G7 countries. The mean values of CON_RET, CDS_ret, USCDS_ret and OVX_ret are positive. Conversely, ISLAMIC_RET, BONDY_ret, E/R_ret, MSCIW_ret and OVX_ret exhibit negative means. The skewness and kurtosis normality tests indicate that all series are not normally distributed. Additionally, the Jarque–Bera test statistics presented in this table show that the hypothesis of normality is rejected at the 1% significance level.
The selection between first- or second-generation panel unit root tests relies on the outcomes of a cross-sectional dependence test. Therefore, the Breusch–Pagan Lagrange Multiplier (LM) test is employed to ascertain the appropriate panel unit root test. Findings from Table 4 indicate the presence of cross-section dependence among G7 countries at a significance level of 1%. Consequently, the cross-section dependence test supports the applicability of second-generation panel unit root tests for this study. Consequently, Table 5 presents the results of second-generation panel unit tests for G7 countries. According to Table 5, CIPS statistics indicate that all variables (CON_RET, ISLAMIC_RET, CDS_ret, BONDY_ret, E/R_ret) are stationary.
Cross-section dependence test results
| Variable | Breusch and Pagan LM | p- value |
|---|---|---|
| CON_RET | 15090.2*** | 0.0000 |
| ISLAMIC_RET | 27143.19*** | 0.0000 |
| CDS_ret | 8585.213*** | 0.0000 |
| BONDY_ret | 9246.676*** | 0.0000 |
| ER_ret | 13563.74*** | 0.0000 |
Note(s): ***p < 0.01
Source(s): Created by the authors
Panel unit root tests results
| CIPS | ||
|---|---|---|
| Variable | Intercept | Intercept and trend |
| CON_RET | −24.69374*** | −24.68534*** |
| ISLAMIC_RET | −25.50831*** | −25.49965*** |
| CDS_ret | −25.45953*** | −25.45087*** |
| BONDY_ret | −13.73835*** | −13.4762*** |
| ER_ret | −24.76965*** | −24.74926*** |
Note(s): *** indicates 1% level of significance
Source(s): Created by the authors
Table 6 displays the results regarding the non-stationarity of the cross-sectionally invariant variables MSCI_ret, USCDS_ret, VIX_ret, and OVX_ret. The Phillips–Perron Test is utilized in Table 6 to assess stationarity. According to the results, MSCI_ret, USCDS_ret, VIX_ret, and OVX_ret are stationary, indicating that all variables are stationary. Consequently, we proceed to employ the MM-QR approach to estimate our model.
4. Methodology
In this investigation, inspired by the research of Hassan et al. (2020), Ashraf et al. (2020) and Godil et al. (2020), we examine the impact of CDS, E/R, BONDY, USCDS, MSCIW, VIX and OVX on ISLAMIC_RET and STOCK_RET in G7 nations, employing a panel data framework (Baltagi, 2005):
In model 1 and model 2, CON_RET and ISLAMIC_RET denote the conventional stock market return and Islamic stock market return of G7; subscript and subscript indicate country and day. The coefficients, such as: = intercept, = Credit default swap (CDS_ret), = 10 years bond yield (BONDY_ret)), = Exchange rate (E/R_ret), = US credit default swap (USCDS_ret), = MSCI world index (MSCIW_ret), = CBOE Volatility index (VIX_ret) and = Oil volatility index (OVX_ret) respectively. denotes disturbance. To begin with, we examine the cross-section dependence among the G7 countries utilizing the Breusch and Pagan LM test (Breusch and Pagan, 1980), while considering the null hypothesis of no cross-section dependence, owing to the large T (time periods) in the dataset.
Following that, we evaluate the stationarity of the cross-sectionally variant variables (CON_RET, ISLAMIC_RET, CDS_ret, E/R_ret and BONDY_ret) using the panel unit root test (Pesaran, 2007), while considering cross-section dependence among G7 countries. The null hypothesis in this test is the presence of a unit root. Furthermore, we utilize the Phillips–Perron unit root test (Phillips and Perron, 1988) to assess the stationarity of cross-sectionally invariant variables (USCDS_ret, MSCIW_ret, VIX_ret and OVX_ret).
To compare the effects of local and global financial variables on both conventional and Islamic stock returns within the G7, we employ ordinary least squares regression (OLS). However, it’s crucial to acknowledge that the OLS estimator can be sensitive to outliers in the data, particularly in financial indicators such as stock returns, which often include outlying observations. Indeed, extreme values can have a notable impact on the results of OLS estimation, as highlighted by Greene (2020). To mitigate the risk of misleading OLS results, we opt for the method of moment quantile regression (Machado and Silva, 2019) for nine quantiles of both Islamic and conventional stock returns within the G7. Among the nine quantiles, 0.1, 0.2 and 0.3 signify the bearish market; 0.4, 0.5 and 0.6 indicate the normal market; and 0.7, 0.8 and 0.9 represent the bullish market. The MM-QR methodology serves as a foundational approach for capturing the conditional diversity present in the dependent variable. It also proves advantageous in managing individual effects and addressing endogeneity concerns among the determinants within a panel data model. Moreover, MM-QR stands out as an appropriate statistical technique for examining the impact of heterogeneity across different quantiles.
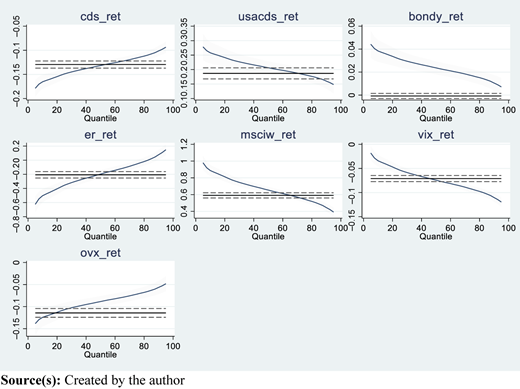
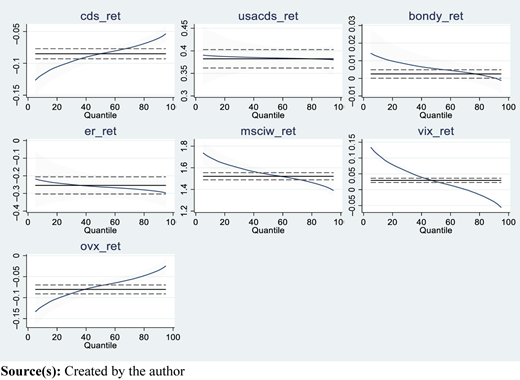
Moreover, we will present the figures depicting the estimated coefficients of each variable for the nine quantiles in Islamic and conventional stock market within G7. Machado and Silva (2019) offer evidence supporting the impact of independent variables on the entire conditional distribution. They enable a dependable estimation of conditional means by effectively isolating individual effects in panel models. Machado and Silva (2019) also address the common incidental parameter problem in quantile regressions with individual effects by enabling the individual effects to influence the entire distribution using this approach.
Finally, we utilize the Driscoll–Kraay estimator (Driscoll and Kraay, 1998) as a robustness check, which can be applied in fixed or random effects models to obtain consistent estimates of the variances and covariance’s of the parameters in the panel data model.
5. Result
In this section, we utilize MM-QR to clarify the variation in how local and global financial factors influence both conventional and Islamic stock returns in G7 countries across diverse quantiles.
The OLS estimation results from Tables 7 and 8 clearly indicate that local and global financial factors exert comparable effects on both conventional and Islamic stock market returns, except for bond yield. Specifically, CDS demonstrates a significant and negative impact on both Islamic and conventional index returns. On the other hand, bond yield exhibits a significant and positive influence solely on Islamic stock index returns. In addition, the exchange rate shows a significant negative effect on both conventional and Islamic stock returns.
Effects of the financial variables on conventional stock returns of G7 countries
| Dep. Var | Location | Scale | Quantile level | |||||||||
|---|---|---|---|---|---|---|---|---|---|---|---|---|
| CON_RET | ||||||||||||
| 0.1 | 0.2 | 0.3 | 0.4 | 0.5 | 0.6 | 0.7 | 0.8 | 0.9 | OLS | |||
| CDS_ret | −0.13*** | 0.02*** | −0.17*** | −0.15*** | −0.14*** | −0.14*** | −0.13*** | −0.13*** | −0.12*** | −0.11*** | −0.10*** | −0.13*** |
| −29.78 | 6.92 | −22.41 | −24.98 | −27.57 | −29.12 | −29.78 | −29.43 | −27.73 | −24.49 | −18.96 | −34.27 | |
| 0.000 | 0.000 | 0.000 | 0.000 | 0.000 | 0.000 | 0.000 | 0.000 | 0.000 | 0.000 | 0.000 | 0.000 | |
| BONDY_ret | 0.02*** | −0.01*** | 0.04*** | 0.03*** | 0.03*** | 0.03*** | 0.02*** | 0.02*** | 0.02*** | 0.02*** | 0.01*** | −0.00 |
| 8.25 | −4.6 | 7.93 | 8.31 | 8.55 | 8.51 | 8.18 | 7.53 | 6.51 | 5.06 | 3 | −0.67 | |
| 0.000 | 0.000 | 0.000 | 0.000 | 0.000 | 0.000 | 0.000 | 0.000 | 0.000 | 0.000 | 0.003 | 0.501 | |
| E/R_ret | −0.20*** | 0.18*** | −0.50*** | −0.40*** | −0.31*** | −0.25*** | −0.19*** | −0.14*** | −0.09*** | −0.02 | 0.08** | −0.21*** |
| −7.11 | 9.72 | −10.56 | −10.13 | −9.34 | −8.3 | −6.88 | −5.17 | −3.09 | −0.66 | 2.25 | −8.88 | |
| 0.000 | 0.000 | 0.000 | 0.000 | 0.000 | 0.000 | 0.000 | 0.000 | 0.002 | 0.511 | 0.025 | 0.000 | |
| USCDS_ret | 0.21*** | −0.03*** | 0.26*** | 0.24*** | 0.23*** | 0.22*** | 0.21*** | 0.20*** | 0.19*** | 0.18*** | 0.16*** | 0.19*** |
| 18.17 | −4.11 | 13.59 | 15.19 | 16.78 | 17.75 | 18.18 | 17.98 | 16.98 | 15.02 | 11.68 | 19.18 | |
| 0.000 | 0.000 | 0.000 | 0.000 | 0.000 | 0.000 | 0.000 | 0.000 | 0.000 | 0.000 | 0.000 | 0.000 | |
| MSCIW_ret | 0.66*** | −0.14*** | 0.89*** | 0.81*** | 0.75*** | 0.69*** | 0.65*** | 0.61*** | 0.57*** | 0.52*** | 0.44*** | 0.59*** |
| 32.19 | −10.38 | 26.09 | 28.47 | 30.78 | 31.95 | 32.06 | 31.14 | 28.67 | 24.58 | 18.02 | 37.38 | |
| 0.000 | 0.000 | 0.000 | 0.000 | 0.000 | 0.000 | 0.000 | 0.000 | 0.000 | 0.000 | 0.000 | 0.000 | |
| VIX_ret | −0.07*** | −0.02*** | −0.03*** | −0.05*** | −0.06*** | −0.07*** | −0.07*** | −0.08*** | −0.09*** | −0.09*** | −0.11*** | −0.07*** |
| −20.03 | −10.03 | −5.61 | −9.19 | −13.51 | −17.12 | −20.4 | −23.16 | −25.03 | −25.88 | −25.03 | −21.79 | |
| 0.000 | 0.000 | 0.000 | 0.000 | 0.000 | 0.000 | 0.000 | 0.000 | 0.000 | 0.000 | 0.000 | 0.000 | |
| OVX_ret | −0.08*** | 0.02*** | −0.12*** | −0.11*** | −0.10*** | −0.09*** | −0.09*** | −0.08*** | −0.07*** | −0.07*** | −0.06*** | −0.11*** |
| −14.08 | 5.14 | −11.79 | −12.78 | −13.68 | −14.08 | −14.04 | −13.49 | −12.31 | −10.39 | −7.41 | −22.62 | |
| 0.000 | 0.000 | 0.000 | 0.000 | 0.000 | 0.000 | 0.000 | 0.000 | 0.000 | 0.000 | 0.000 | 0.000 | |
| C | −5.28*** | 1.15*** | −7.20*** | −6.57*** | −6.01*** | −5.61*** | −5.24*** | −4.89*** | −4.53*** | −4.10*** | −3.48*** | −4.62*** |
| −27.78 | 9.41 | −22.81 | −24.81 | −26.72 | −27.65 | −27.68 | −26.78 | −24.56 | −20.94 | −15.19 | −31.6 | |
| 0.000 | 0.000 | 0.000 | 0.000 | 0.000 | 0.000 | 0.000 | 0.000 | 0.000 | 0.000 | 0.000 | 0.000 | |
Note(s): ***, **, * shows 1%, 5%, 10% level of significance
Source(s): Created by the authors
Effects of the financial variables on Islamic stock returns of G7 countries
| Dep. Var ISLAMIC _RET | Location | Scale | Quantile level | |||||||||
|---|---|---|---|---|---|---|---|---|---|---|---|---|
| 0.1 | 0.2 | 0.3 | 0.4 | 0.5 | 0.6 | 0.7 | 0.8 | 0.9 | OLS | |||
| CDS_ret | −0.086*** | 0.016*** | −0.117*** | −0.105*** | −0.097*** | −0.090*** | −0.084*** | −0.080*** | −0.075*** | −0.069*** | −0.060*** | −0.084*** |
| −16.65 | 4.37 | −10.99 | −12.73 | −14.33 | −15.89 | −16.92 | −17.3 | −16.84 | −14.74 | −10.89 | −21.02 | |
| 0.000 | 0.000 | 0.000 | 0.000 | 0.000 | 0.000 | 0.000 | 0.000 | 0.000 | 0.000 | 0.000 | 0.000 | |
| BONDY_ret | 0.005** | −0.003 | 0.012** | 0.009** | 0.008** | 0.006** | 0.005* | 0.004* | 0.003 | 0.002 | 0.000 | 0.002** |
| 1.9 | −1.59 | 1.98 | 2.03 | 2.04 | 1.98 | 1.86 | 1.66 | 1.32 | 0.76 | 0.09 | 2.03 | |
| 0.057 | 0.111 | 0.048 | 0.042 | 0.042 | 0.047 | 0.063 | 0.097 | 0.188 | 0.447 | 0.932 | 0.043 | |
| E/R_ret | −0.261*** | −0.018 | −0.22*** | −0.24*** | −0.24*** | −0.25*** | −0.26*** | −0.26*** | −0.27*** | −0.27*** | −0.28*** | −0.254*** |
| −7.11 | 9.72 | −10.56 | −10.13 | −5.55 | −6.84 | −7.92 | −8.69 | −9.21 | −9.04 | −7.86 | −8.88 | |
| 0.000 | 0.476 | 0.001 | 0.000 | 0.000 | 0.000 | 0.000 | 0.000 | 0.002 | 0.003 | 0.003 | 0.000 | |
| USCDS_ret | 0.384*** | −0.002 | 0.389*** | 0.387*** | 0.386*** | 0.385*** | 0.384*** | 0.383*** | 0.383*** | 0.382*** | 0.381*** | 0.382*** |
| 27.89 | −0.23 | 13.67 | 17.57 | 21.38 | 25.52 | 28.82 | 31.03 | 32.16 | 30.73 | 25.79 | 36.66 | |
| 0.000 | 0.818 | 0.000 | 0.000 | 0.000 | 0.000 | 0.000 | 0.000 | 0.000 | 0.000 | 0.000 | 0.000 | |
| MSCIW_ret | 1.546*** | −0.081*** | 1.695*** | 1.637*** | 1.598*** | 1.564*** | 1.539*** | 1.518*** | 1.494*** | 1.463*** | 1.423*** | 1.521*** |
| 64.73 | −4.54 | 34.46 | 42.97 | 51.14 | 59.9 | 66.7 | 70.93 | 72.43 | 67.85 | 55.61 | 37.38 | |
| 0.000 | 0.000 | 0.000 | 0.000 | 0.000 | 0.000 | 0.000 | 0.000 | 0.000 | 0.000 | 0.000 | 0.000 | |
| VIX_ret | 0.029*** | −0.044*** | 0.110*** | 0.079*** | 0.057*** | 0.039*** | 0.025*** | 0.013*** | 0.000 | −0.015*** | −0.038*** | −0.029*** |
| 6.59 | −13.28 | 12.19 | 11.24 | 9.96 | 8.1 | 5.92 | 3.48 | 0.21 | −3.92 | −7.96 | −21.79 | |
| 0.000 | 0.000 | 0.000 | 0.000 | 0.000 | 0.000 | 0.000 | 0.000 | 0.83 | 0.000 | 0.000 | 0.000 | |
| OVX_ret | −0.073*** | 0.025*** | −0.120*** | −0.102*** | −0.090*** | −0.079*** | −0.071*** | −0.064*** | −0.057*** | −0.047*** | −0.035*** | −0.080*** |
| −10.31 | 4.75 | −8.17 | −8.96 | −9.62 | −10.16 | −10.34 | −10.12 | −9.29 | −7.4 | −4.58 | −22.62 | |
| 0.000 | 0.000 | 0.000 | 0.000 | 0.000 | 0.000 | 0.000 | 0.000 | 0.000 | 0.000 | 0.000 | 0.000 | |
| C | −12.61*** | 3.88*** | −13.78*** | −13.33*** | −13.02*** | −12.75*** | −12.55*** | −12.39*** | −12.20*** | −11.96*** | −11.64*** | −12.39*** |
| −57.29 | 9.41 | −30.39 | −37.93 | −45.2 | −52.98 | −59.01 | −62.8 | −64.18 | −60.19 | −49.36 | −31.6 | |
| 0.000 | 0.000 | 0.000 | 0.000 | 0.000 | 0.000 | 0.000 | 0.000 | 0.000 | 0.000 | 0.000 | 0.000 | |
Note(s): ***, **, * shows 1%, 5%, 10% level of significance
Source(s): Created by the authors
When considering global factors, it’s notable that the USCDS and the MSCI World Index have a significant positive influence on both conventional and Islamic stock market indices. On the other hand, the VIX (Volatility Index) and OVX (Oil Volatility Index) exhibit a notably negative impact on stock returns across all market circumstances. In summary, OLS findings indicate that both local and global financial factors play a significant role in shaping G7 conventional and Islamic stock returns, with the exception of bond yield, which doesn’t show influence in the case of conventional stocks.
From the MM-QR results, observing both conventional and Islamic stock indices, it becomes apparent that all financial variables CDS, E/R, USCDS, MSCIW and OVX exhibit similar impacts except BONDY and VIX. The result suggests that there is a significantly negative relationship between CDS and stock returns, both in conventional and Islamic stock markets across G7 countries. This means that when CDS rates increase (indicating higher credit risk), stock returns tend to decrease. The observation aligns with Merton’s structural credit risk model, proposed in 1974, which posits an inverse relationship between credit risk (as measured by CDS) and stock market performance. This model suggests that as credit risk increases, the value of equity decreases. The coefficient is greater in the conventional stock index than in the Islamic stock index, indicating that investors exhibit stronger reactions in conventional markets compared to Islamic markets within the G7 context. This highlights the broader dynamics of financial markets and how investors respond to fluctuations in credit risk.
Moreover, the outcomes are typically documented in the previous studies (Tokmakçıoğlu et al., 2018; Shahzad et al., 2018a, b; Aman, 2019; Gün, 2018; Anton and Afloarei Nucu, 2020; Coronado et al., 2012; Yang et al., 2018). Besides, while CDS may have a significant influence on stock market returns in the lower quantiles, this influence diminishes as it moves towards the higher quantiles. The consistent decrease in the magnitude of the coefficient across quantiles indicates an asymmetric relationship between CDS and both stock market returns of G7. This asymmetry suggests that the impact of changes in CDS on stock market returns differs depending on the level of market performance or other factors represented by the quantiles.
10-years bond yield has a significant positive impact on the conventional and Islamic stock market return in all market circumstances (except bullish phase in Islamic market). The results are commonly recorded in earlier research conducted by Shahzad (2019), which delves into the connections between the 10-year bond yield and stock market across developed nations. The lower coefficient observed in the Islamic stock index compared to the conventional stock index suggests that fluctuations in bond yields exert a lesser effect on the Islamic stock market index in contrast to their impact on the conventional stock market index. However, in bullish market conditions, our research indicates that there is no significant correlation between bond yields and Islamic stock markets. This is a rational outcome because Sharia-compliant principles prohibit interest (riba) and speculation (gharar), exhibit less sensitivity to interest rate fluctuations and other market risks. While the 10-year bond yields may have some explanatory power for the returns of conventional stock markets, this explanatory power is notably weaker or less significant when it comes to Islamic stock market returns.
The exchange rate is inversely linked with both conventional and Islamic stock market return across G7 nations (except for Q9 in case of conventional stock index). This suggests that as the exchange rate rises (or the domestic currency weakens), stock market returns typically decline. One potential explanation for this negative effect is that G7 countries rely heavily on imports. In such countries, a stronger exchange rate (or weaker domestic currency) can lead to higher import costs, which may negatively affect corporate profits and, subsequently, stock market returns. Similar results were found with Bhargava and Konku (2023), Chellaswamy et al. (2020), Zhu et al. (2022), Ali et al. (2020), Alam and Rashid (2014) who detected a negative relationship between exchange rate and stock market return. For conventional stock market returns of G7, the impact of the exchange rate diminishes with increasing quantiles. This suggests that while the exchange rate still has a negative impact on conventional stock returns, this impact becomes less significant as market condition improves. Conversely, for Islamic stock market returns, the strength of the exchange rate increases with higher quantiles. This suggests that as market performance improves (moving from lower to higher quantiles), the impact of the exchange rate becomes more pronounced on Islamic stock market returns.
The USCDS has a stronger positive impact across all quantile in case of both conventional and Islamic stock market. The results are commonly documented in earlier research by Aloui et al. (2015), the investigation into the correlation between macroeconomic factors and Islamic stocks revealed that USCDS positively influences the Islamic stock index. When USCDS increases, the indexes of both Islamic and conventional index in G7 countries tend to increase as well. However, the magnitude of this correlation decreases as it moves from Q1 to Q9. This might suggest that the relationship is stronger in the lower quantiles (Q1–Q3) and weaker in the higher quantiles (Q7–Q9). This result indicates there is a slightly asymmetric dependency between those variables. Additionally, the coefficient is higher in Islamic stock indices compared to conventional ones, suggesting that the impact is more pronounced in Islamic stock indices than in conventional ones.
We find that the estimated coefficients of the MSCI world index have significant and positive effects on the stock market return in the case of both conventional and Islamic stock return at all quantile levels. A rise in the MSCI world stock market index implies a healthy global economy, which has a positive influence on market economies and stock returns. The coefficient’s magnitude diminishes as the quantile increases. In both stock markets, during bullish phases, the positive impact of the MSCI World Index weakens and is not as pronounced as during bearish phases. Furthermore, the lower coefficient observed in the conventional stock index compared to the Islamic stock index suggests that fluctuations in MSCI world index exert a lesser effect on the conventional stock market index in contrast to their impact on the Islamic stock market index.
In all quantiles, VIX has a significant negative impact on the conventional stock market. In the Islamic stock index, the correlation tends to be positive during bear (falling) and normal market conditions, indicating that Islamic stocks move in line with the broader market trends. We can also observe that the linkages between VIX and Islamic stock market returns are not significant at the starting point of high quantiles (Q7). As the VIX moves into a bullish state (Q8, Q9) the linkages between the VIX and Islamic stock market returns gradually become significant and negative. Therefore, during times of increased volatility or uncertainty, the VIX has a more pronounced impact on Islamic stock markets. This implies that when there’s greater volatility in the US stock market (reflected in VIX changes), it leads to higher volatility in the Islamic stock markets of G7 countries. This could be due to various factors, including global market interconnectedness and investor sentiment contagion. These positive findings align with earlier studies by researcher like Bekiros et al. (2017) and Badshah et al. (2018). Therefore, it can be said that the reaction of investors on the VIX are more prominent in conventional stock index than the investor of Islamic stock index.
We find that the estimated coefficients of the OVX indicate that bad news originating from the global oil market tends to have a significant negative impact on both conventional and Islamic stock markets. This suggests that the oil market can adversely affect stock market return. Moreover, as the quantile increases, the magnitude of the coefficients decreases in both market. This means that the negative impact of the oil market volatility on stock markets diminishes as market conditions improve or become bullish. These findings align with the research conducted by Sheikh et al. (2023), which proposes that the OVX has a more pronounced impact during periods of bearish market condition. Xiao et al. (2018) and Lin and Su (2020) also report similar findings, indicating that the OVX tends to have negative link with stock market. Furthermore, the coefficient of OVX is almost similar in both market.
Figures 1 and 2 display the coefficients of MM-QR for the conventional as well as Islamic stock index return of G7.
5.1 Robustness test
Tables 9 and 10 present the Driscoll–Kraay (Driscoll and Kraay, 1998) test results for the conventional and Islamic stock index returns of the G7 countries. Table 9 shows that the coefficients for CDS_ret, E/R_ret, VIX_ret and OVX_ret are significantly negative, while the coefficients for BONDY_ret, USCDS_ret and MSCIW_ret are significantly positive. Likewise, Table 10 reveals that all variables have the same sign as in the conventional stock returns, except for VIX_ret, which is positive and significant for the Islamic stock index. Therefore, all coefficients align with the estimates provided in the previous tables.
Driscoll–Kraay test results for conventional stock index return of G7
| Variable | Coefficient | t-statistics | p-value |
|---|---|---|---|
| CDS_ret | −0.1324*** | −28.8 | 0.000 |
| BONDY_ret | 0.0240*** | 8.64 | 0.000 |
| E/R_ret | −0.2043*** | −11.17 | 0.000 |
| USCDS_ret | 0.2077*** | 12.84 | 0.000 |
| MSCIW_ret | 0.6597*** | 22.34 | 0.000 |
| VIX_ret | −0.0733*** | −14.82 | 0.000 |
| OVX_ret | −0.0894*** | −8.34 | 0.000 |
| C | −5.2873*** | −18.77 | 0.000 |
Note(s): *, **, *** show 10%, 5%, %1 level of significance
Source(s): Created by the authors
Driscoll–Kraay test results for Islamic stock index return of G7
| Variable | Coefficient | t-statistics | p-value |
|---|---|---|---|
| CDS_ret | −0.0864*** | −12.88 | 0.000 |
| BONDY_ret | 0.0057* | 1.76 | 0.079 |
| ER_ret | −0.2612*** | −7.32 | 0.000 |
| USCDS_ret | 0.3847591*** | 16.78 | 0.000 |
| MSCIW_ret | 1.546721*** | 40.64 | 0.000 |
| VIX_ret | 0.0293751*** | 4.07 | 0.000 |
| OVX_ret | −0.0737911*** | −4.84 | 0.000 |
| C | −12.61534*** | −34.74 | 0.000 |
Note(s): *, **, *** show 10%, 5%, %1 level of significance
Source(s): Created by the authors
6. Conclusion
This paper makes the initial attempt to investigate the response of the Islamic and conventional stock markets returns to the local and global financial factors at different investment horizons. Our empirical results are practically useful for policymakers who have been using CDS, Bond yield, E/R, USCDS, MSCI world index, VIX and OVX as instruments to contain volatility in the G7 stock market.
In our investigation, we observe that the coefficients associated with local financial variables (such as CDS, BONDY, E/R) tend to be higher in the conventional stock return model compared to the Islamic stock return model. This emphasis that conventional stock markets are more influenced by local factors. On the contrary, in the Islamic stock index, the coefficient for USCDS and MSCIW is higher than in the conventional one. This indicates that Islamic stock markets are more impacted by global factors.
Besides, the impact of CDS on the conventional index is more pronounced and detrimental compared to its impact on the Islamic index of G7. The influence of 10-year bond yields on both conventional and Islamic stock market returns is notably positive under most market conditions, except during bullish phases in Islamic markets. Therefore, 10-year bond yields may provide some insight into conventional stock market returns, this relationship is considerably weaker or less pronounced in explaining Islamic stock market returns of G7. This outcome is logical since Islamic stocks are inherently less influenced by interest rates, aligning with their principles. The correlation between exchange rates and stock market returns tends to be mainly negative in both conventional and Islamic markets of G7, with the exception of Q9 in conventional stock returns. This negative relationship could be attributed to the significant dependence of G7 economies on imports. In such contexts, a stronger exchange rate (or a weaker domestic currency) often leads to higher import costs, potentially dampening corporate profits and subsequently reducing stock market returns.
Moreover, there is a positive relationship between USCDS and the Islamic as well as conventional indexes of the G7 countries. The MSCI World Index demonstrates significant and positive effects on stock market returns for both conventional and Islamic markets. The VIX exhibits a significant negative influence on the conventional stock market. In contrast, in the Islamic stock index, the correlation tends to be positive during bear (falling) and normal market conditions. However, as market conditions shift into bullish phases (Q8, Q9), the relationships between the VIX and Islamic stock market returns gradually become significant and negative. This suggests that Islamic stock markets are more susceptible to the influence of heightened volatility or uncertainty, as reflected by the VIX, during such periods. When the VIX is increasing investor should prefer the Islamic stock index over the conventional one (except in bullish period).
Moreover, OVX indicate that bad news originating from the global oil market tends to have a significant negative impact on both conventional and Islamic stock markets. This suggests that the oil market can adversely affect stock market return of G7. Therefore, investor sentiment tends to be highly sensitive to fluctuations in oil prices because of the perceived effects on economic growth, inflation and corporate earnings. Consequently, it’s quite logical that negative news in the oil market could erode investor confidence and lead to a subsequent sell-off in stock markets. In reaction, investors may alter their portfolio allocations to mitigate potential deflation risks, which could involve reducing their exposure to stocks.
Overall, our findings could provide some valuable implications for investors and risk managers. For example, international investors should pay enough attention to the asymmetric effects of the uncertainty of the financial factors on both Islamic and conventional stocks. Therefore, risk managers may adopt some means to avoid great investment risks and treat market phase differently based on financial factors status.
A limitation of this study is that G7 countries lack a majority Muslim population, resulting in very limited research on how financial factors specifically influence Islamic stock indices in these markets. Most of the research on Islamic finance tends to focus on regions where Islamic finance is more prominent, such as in the Middle East or Southeast Asia. This makes difficult to compare findings with existing studies, as there aren’t many directly relevant studies to draw upon. Additionally, future research could investigate the impact on specific sectors, offering a more nuanced analysis of how various Islamic sub-sectors react to financial factors. This would provide a deeper understanding of the market and potentially reveal sector-specific behaviors and sensitivities.
