

This paper examines the volatility spillover effects across four key commodities (gas, WTI, wheat, gold), bitcoin and G7 stocks during crisis periods, including the COVID-19 pandemic and the Ukraine war. The objective is to comprehend how linkages vary under extreme conditions to inform risk management and portfolio strategies.
The study applies a multi-method approach: time-varying parameter, quantile vector autoregression and time–frequency connectedness. It permits exploring directional connectedness and regime-specific behaviours across quantiles and frequency domains by using daily indices from January 2017 to February 2025.
The results reveal time-varying connectivity that intensifies during crises. WTI shifts from net receiver to significant transmitter of shocks in war, highlighting the energy market's vulnerability to conflict. The S&P 500 became a net recipient during the war. Commodities show no significant interconnection. Gold and Bitcoin act similarly, receiving shocks particularly during the pandemic. The Nikkei's behaviour aligns with Bitcoin and commodities. G7 indices, except Nikkei, are risk amplifiers while Bitcoin and commodities (except WTI) are consistent receivers. Extreme quantiles indicate symmetric net transmission. Short-term spillovers dominate, implying faster propagation of shocks, long-term connectedness is weak and less persistent.
Findings highlight the necessity for dynamically adjusting portfolio strategies in response to crises. Short-term volatility dominance implies the need for tactical allocation. Shock propagators can't play anything in portfolio strategies, while consistent receivers are suitable candidates as safe-haven assets and hedging instruments. WTI must be monitored to rebalance risk. Commodities can be used to diversify within the commodity sector.
This paper combines QVAR and time–frequency analysis to assess the behaviour of conventional and modern financial assets under crises periods. It contributes to the literature by identifying specific roles of each asset across different quantiles and time horizons, enhancing understanding of systemic risk and resilience under stress and offering insights for investment decision-making during disruptions.
1. Introduction
Geopolitical instability and the COVID-19 pandemic have raised volatility and uncertainty in financial markets, reinforcing the need for robust risk assessment and portfolio management. Understanding intermarket connections is essential for both global financial and commodities markets. Studying the spillover of risks between commodities (gold, WTI crude oil, wheat and natural gas), G7 stock markets and cryptocurrencies like Bitcoin can help portfolio managers prioritize diversification and prepare for energy and financial crises. Karimi et al. (2023), Tarchella et al. (2024), Ustaoglu (2023) emphasize the important role of these assets as investment havens during crises. Given the heterogeneous nature of these assets, assessing their interconnectedness is essential for risk portfolio management and strategic asset allocation during normal and stressed periods.
Bitcoin, the first and most traded cryptocurrency, operates on blockchain technology, isolated from the traditional financial system. It represents an attractive investment instrument as it is often considered a “safe-haven” asset similar to gold (Bouri et al., 2017; Colon et al., 2021; Le Thi Thuy et al., 2024; Li et al., 2023; Mokni et al., 2021; Shahbaz et al., 2017; Urquhart and Zhang, 2019). Bitcoin is always compared with commodities, including gold, oil, wheat and gas (Akhtaruzzaman et al., 2021; Balcilar et al., 2021), which often serve as refuges during crises. Because Russia and Ukraine are major exporters of wheat, oil and natural gas, the conflict is anticipated to strongly impact financial markets, motivating the focus on WTI and gas as core energy assets. The significance of G7 equity markets, characterized by large capitalization and strong economic influence, supports their inclusion (Shahbaz et al., 2017).
This study examines volatility spillovers and connectedness among G7 stocks, Bitcoin and commodities (gas, WTI, wheat, gold) during three periods: pre-COVID-19, COVID-19 and the Ukraine–Russia war in order to identify diversification, hedging and safe-haven attributes in varying market conditions (Mensi et al., 2022). Such analyses provide valuable insights for option pricing, value at risk estimation, portfolio optimization and hedging decisions (Boungou and Yatié, 2022; Yousaf et al., 2022; Yousaf and Yarovaya, 2022).
Methodologically, we apply time-varying interconnectedness (TVP-VAR) as established by Diebold and Yilmaz (2012, 2014), enhance the analysis through the quantile connectedness framework (QVAR) introduced by Ando et al. (2018, 2022) and investigate frequency-specific spillovers as outlined by Baruník and Křehlík (2018), Chatziantoniou et al. (2021, 2022). This comprehensive approach allows for the identification of net volatility transmitters and receivers, while also measuring the transmission of shocks across assets over various time horizons and frequency bands.
While the topic of volatility spillovers is well researched, the contribution of this paper to the literature is as follows: First, we integrate three distinct methodologies: TVP VAR, QVAR and time–frequency connectedness, to capture the complex, nonlinear and event-dependent spillover dynamics that are critical for understanding market behaviour during crises. This enhances understanding of market contagion, risk transmission and safe-haven behaviours in extreme conditions, providing valuable insights for adaptive risk management and portfolio optimization. Second, we use frameworks for multi-asset, overlying crisis analysis. Most studies focus on specific asset groups or bilateral relationships, with limited comprehensive multi-asset frameworks. Integrated multi-asset, quantile-dependent and asymmetric analyses remain underdeveloped, representing a critical area for future research. Furthermore, we contribute to the field of research by identifying specific roles of each asset across different quantiles and time horizons, enhancing understanding of systemic risk and resilience under stress and offering insights for investment decision-making during disruptions.
Our empirical findings provide several key insights. First, the connectedness between the G7 stock market indices, commodities indices and Bitcoin return index varies over time and exhibits spikes during extreme market conditions. Particularly, we demonstrate three major spillover transmission cycles. The first one is in the second half of 2019 until the end of 2019. The second cycle dynamic coincided with the disease period of COVID-19 in February 2020, in which volatility spillover risk reached the highest peaks. We detect a stronger connectedness across financial markets. The third high dynamic cycle occurred from February 2022 until March 2022, coinciding with two major crises: the Russia–Ukraine war in February 2022 and the bankruptcy of SVCB (March 2023).
Second, the empirical evidence reveals that asset roles within the spillover network vary depending on the crisis. A key result indicates that WTI crude oil transitions from a net receiver to a strong net transmitter of shocks during the Russia–Ukraine conflict, underscoring the energy sector's sensitivity to geopolitical tensions. Conversely, Gold and Bitcoin consistently act as net receivers of shocks, especially during the pandemic, confirming their perceived safe-haven characteristics. Third, risk transmission is symmetrical, with spillover effects being most intense in both the lower and upper extreme quantiles. Fourth, the time-frequency decomposition demonstrates that spillovers primarily occur over the short term (1–5 days), suggesting a fast contagion effect, while long-term connectedness remains limited. Finally, within the G7 equities, the Nikkei stands out by acting as a net receiver like traditional safe havens, whereas the DAX and CAC 40 indices persist as stable risk transmitters. These results emphasize the necessity of adopting dynamic and tactical asset allocation during crises and provide valuable guidance for the design of hedging and diversification strategies.
2. Literature review
Research on spillover and dynamic connectedness gains particular attention during financial and geopolitical crises (such as the Global Financial Crisis of 2008–2009, the European Sovereign Debt Crisis of 2010–2012, the oil price crash of 2014–2015, the COVID-19 pandemic crisis, the Russia–Ukraine war in 2022 and the collapse of SVB, 2023). These events amplify the transmission of shocks among assets, leading to contagion effects and influencing portfolio risk management (Nekhili et al., 2021; Tabash et al., 2024; Yamaka, 2024).
Research comparing Bitcoin to conventional assets indicates it has significantly higher volatility (Baur and Lucey, 2010; Benhamed et al., 2023) and is largely ineffective as a safe haven, often increasing portfolio risk during downturns (Charfeddine et al., 2020; Colon et al., 2021). While it may offer short-term hedging in G7 and European markets (Abid et al., 2023; Xu and Kinkyo, 2023), its role as a dominant hedger diminishes during crises like the COVID-19 pandemic and the Silicon Valley Bank collapse, revealing acute sensitivity to financial stress (Al-Shboul et al., 2022; Galati and Capalbo, 2024; Shoaib et al., 2022). Charfeddine et al. (2020), Karimi et al. (2023) highlight cryptocurrencies’ potential as portfolio diversifiers; however, their hedging capabilities remain limited. In contrast, commodities like gold serve as strong long-term hedges and safe havens (Ghorbel and Jeribi, 2021; Reboredo, 2013) with energy commodities (e.g. WTI, natural gas) experiencing significant fluctuations and spillover effects during turmoil (Mensi et al., 2021; Rehman et al., 2023; Zhang et al., 2020b). Studies on G7 markets confirm robust interconnectedness among equities, cryptocurrencies and commodities during crises (Adekoya and Oliyide, 2021; Boungou and Yatié, 2022; Mensi et al., 2022; Özdemir, 2022), with events like the Silicon Valley Bank collapse triggering contagion (Akhtaruzzaman et al., 2023; Yousaf et al., 2022). Overall, the literature shows that spillover and hedging roles are time-varying and context-dependent, with traditional assets generally offering superior hedging in normal conditions (Tarchella et al., 2024), Bitcoin providing limited diversification (Karimi et al., 2023), and assets like wheat showing weak safe-haven properties (Ustaoglu, 2023).
These studies highlight crisis-driven spillovers, contagion and time-varying dependencies, noting that assets may shift between transmitter and receiver roles depending on period and market structure.
While the extant literature confirms that financial and geopolitical crises act as catalysts, amplifying volatility spillovers and cross-market contagion, several critical questions remain unanswered, particularly concerning these spillovers’ asymmetric, regime-dependent and frequency-specific nature. Additionally, the existing literature presents divergent views on the role of different asset classes under stress. Bitcoin is debated as a potential safe haven considering its independence from traditional assets, while it reveals increased correlation with equities during downturns, suggesting limited and context-dependent hedging effectiveness. Commodities exhibit heterogeneous behaviours: gold acts as robust hedge and safe haven, whereas energy commodities like WTI and gas remain highly exposed to macroeconomic shocks as shown during Russia–Ukraine conflict. Meanwhile, G7 equity markets are persistently identified as central transmitters of financial shocks.
To address these gaps and synthesize the conflicting evidence on asset roles, this study proposes and tests the following hypotheses.
Crisis period (COVID-19, Ukraine war) intensifies volatility spillovers in a dynamic, asymmetric and frequency manner across gas, WTI, wheat, gold, bitcoin and G-7 stocks and heightened risk transmission.
G-7 stocks act as net transmitters, commodities (especially gold) act as net receivers during crisis.
Geopolitical risks and policy uncertainties have a significant impact on the connectedness of commodity markets
Short-term volatility spillovers will be more dominant and persistent during crises, reflecting the rapid propagation of shocks, while long-term connectedness will remain weaker, suggesting that the fundamental relationships between these assets are less affected over extended periods.
Many studies rely on a single methodology. We combine TVP-VAR, QVAR and frequency framework to simultaneously capture time-varying effects, regime-specific behaviours and horizon-specific dynamics.
3. Methodology and data
3.1 Model specification
The varying periods of strong volatility across the series suggest that market responses to global turbulences can vary over time. Furthermore, it implies that the dynamics influencing the series' volatilities may vary across different markets. In this context, analysing the connectedness of series individually and dynamically in pairs through a shared model is crucial for changing connectedness structures over time and the impact of global shocks on volatility transmissions.
Our methodology is presented in three steps. First, we apply the time-varying parameter Vector Autoregressive model of (Diebold and Yılmaz, 2014). The objective is to measure spillovers in considered assets. This model allows to capture the dynamics of a wide range of variables over time according to a specific law of movement.
On one hand, we can explore the correlation between the indices of the G7, commodities and cryptocurrencies by analysing how volatility spillover in one market influences volatility in the other, as discussed by Fang et al. (2023). We employ correlation measures to assess the connection between these indices. On the other hand, we can investigate the interdependence of G7, commodities and cryptocurrency indices by observing how coefficients change over time. Following the framework proposed by Diebold and Yilmaz (2012, 2014) and adapted by Bouri et al. (2021a, b), we trace and assess spillovers in a pre-determined network. We then elucidate how structural shocks in this network impact the volatility of each variable through measures of connectedness. This analysis focuses on the utilization of generalized variance decompositions and directional spillovers.
The widespread acceptance of the connectedness framework can be largely attributed to its capacity to offer researchers and practitioners a straightforward network analysis in both static and dynamic time series. In the static approach, a model is applied to the entire dataset, while the dynamic approach involves the use of a rolling-window approach.
For our second analysis, we utilize the quantile connectedness approach as developed by (Ando et al., 2018, 2022; Chatziantoniou et al., 2022). The QVAR is critical for testing our hypotheses regarding asymmetry and regime-specific behaviour.
Through the quantile connectedness approach, we can delve into how correlations among variables fluctuate during periods of extreme events, encompassing both positive and negative structural shocks across higher or lower quantiles. This approach enables us to ascertain whether the intensity and direction of these shocks (positive or negative) influence the degree of connectedness among the variables. Ultimately, we gain insights into how variables react to extreme shocks and whether discrepancies emerge during various types of shocks.
Finally, we use time–frequency connectedness (Baruník and Křehlík, 2018; Chatziantoniou et al., 2022) to classify connectedness into high-frequency: shocks have a short-lived impact on the assets of the network. When connectedness is the result of structural shocks, we analyse low-frequency and long term impacts of shocks. This decomposition is crucial for distinguishing between short-term and long-term contagion. It directly addresses our hypotheses (4).
We first consider the following model which expresses the ith asset index as a function of every lagged asset index in the system:
For all assets in the system, we can specify the following quantile vector autoregression, system for :
where and are vectors with dimensions representing endogenous variable. τ is conditional quantile, p constitute the lag length of the model. is a vector of constants. is a dimensional matrix of parameter, and represent a error vector which has a dimensional variance-covariance matrix, .
Following Koop et al. (1996), Pesaran and Shin (1998), hereafter KPPS, we calculate the « generalized forecast error variance decomposition (GFEVD)» with forecast horizon of . It reflects the impact of shock in variable on the variance of prediction error of variable . That is, the proportion of the -step-ahead forecast error variance of the variable in accounted for by the idiosyncratic innovation.
Denoting the KPPS H-step-ahead forecast error variance decompositions by , for the equation is specified as follows:
expresses the proportion of the H-step-ahead forecast error variance (FEV) of variable i due to shocks in the equation for variable j at the conditional quantile. In the decomposition matrix, the normalization of elements is given as:
Through the normalization, we get the following identities:
Now, we can calculate measures of connectedness as below:
First, we calculate the total connectedness index (TCI), which measures the higher is the degree of interconnectedness in the network. Consequently, a greater TCI value means a persistence of increased market risk, while a lower value suggests the opposite. The formula is:
Next, we compute the directional spillover indices. So we evaluate the impact that variables i has on all variables j to measure how much of a shock in series i is transmitted to all other series j: Total directional connectedness (TDC) TO others
Subsequently, the total directional connectedness FROM others that evaluate how much series is receiving from series is estimated as follows:
Finally, the difference between TDC TO others and TDC FROM others can be understood as the net influence series I has on the analysed network:
If NETi> 0 (NETi< 0), then the series i tends to demonstrate a higher (lower) impact on the entirety of the other series j. Therefore, it is considered as net transmitter (receiver) of shocks.
Now we move to the connectedness assessment in the frequency–time domain through the implementation of spectral decomposition technique (Stiassny, 1996). To do this, we first estimate the following frequency response function, Ψ () = , where and ω denotes the frequency. We then proceed with determining the spectral density of at a specific frequency ω, which could only be attained through the implementation of a Fourier transformation on the QVMA (∞), as follows:
Similarly, since the frequency-based GFEVD is the fusion of spectral density and GFEVD, then GFEVD could be normalized in the frequency domain in the same manner required for normalizing its time domain, as follows:
The expression (ω) refers to the ith series spectrum fraction at a given frequency ω that can be attributed to an effect on the jth series. This measure is widely recognized as an intra-frequency indicator. Thus, for connectedness across both of the short-term and long-term time frames to be effectively evaluated, and rather than focusing on a single frequency, we considered aggregating the entirety of frequencies within a specified range, denoted as: d= (a, b): a, b∈ (−π, π), a<b:
In this way, we were able to calculate exactly the same connectedness measurements as in Diebold and Yilmaz (2012, 2014). These measures refer now to frequency connectedness measures, which enabled us to depict the transmission of impacts within specified frequency ranges (denoted d), the formulas are:
Concerning us, we have two frequency bands that must be defined to capture short- and long-term dynamics. The first band, , helps in covering a one-to-five-day time span. The second band, , encloses timeframes ranging from six days to an infinite horizon. Hence, were designed to illustrate respectively short-term total directional connectedness toward others, short-term total directional connectedness from others, short-term net total directional connectedness and short-term total connectedness indexes. Regarding they respectively symbolize long-term total directional connectedness toward others, long-term total directional connectedness from others, long-term net total directional connectedness and long-term total connectedness index. Finally, we considered establishing a relationship associating the frequency-domain measures advanced by Baruník and Křehlík (2018) and the time-domain measures put forward by Diebold and Yilmaz (2012, 2014). Hence:
In other words, the total connectedness measures can be derived by aggregating the entirety of the frequency connectedness measures, computed using a specified quantile dubbed τ.
3.2 Data and descriptive analysis
We consider four types of commodities (gas, WTI, wheat and gold), Bitcoin, and G7 stock market return indices. Our data sample covers the daily return series of the different assets from January 3, 2017, to February 7, 2025. They are calculated by employing the formula , with denoting the price for the current day. Data procurement was conducted from the Datastream database. All data and their definition are concisely delineated in Table 1.
Series definition
| Indices | Description |
|---|---|
| Bitcoin | Cryptocurrency |
| Gold | Commodity |
| WTI | West Texas intermediate (curd oil) |
| Wheat | Commodity |
| Gas | Commodity |
| S & P 500 | American stock index |
| FTSE | Financial time stock exchange group |
| Nikkei | Japanese stock index |
| DAX.40 | German stock index |
| CAC.40 | France stock index |
| FTSE.MIB | Italian stock index |
| S&P/TSX | Toronto stock index (Canada) |
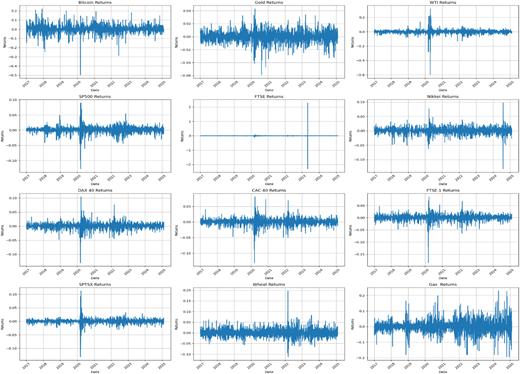
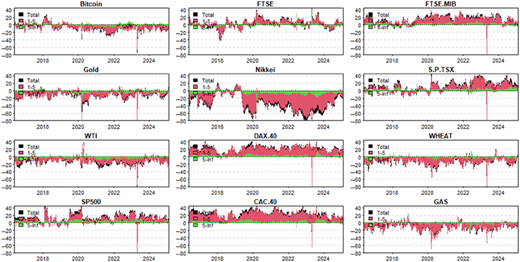
Figure 1 depicts volatility time clusters, highlighting the largest striking volatility during the Coronavirus pandemic, for some indices during the oil collapse of March–April 2020 and the Ukraine–Russia war. G7 indices peaked during COVID-19, WTI during the oil crash and wheat and gold during the war. Events such as US elections (2020), Russia–Ukraine conflict (2020) and SVB collapse (2023) increased these volatility periods, reflecting nonlinear behaviour and intensified market uncertainty.
We have conducted the Brock–Dechert–Scheinkman (BDS) test to verify the presence of nonlinear dependencies in our data prior to applying the TVP-VAR and QVAR framework. The BDS test results [1] confirm that the null hypothesis of i.i.d. (independent and identically distributed) behaviour is rejected for our returns series, indicating significant nonlinear dependence among our variables. This finding supports our methodological choice of employing nonlinear and time-varying models (TVP VAR and QVAR) to capture the complex dynamic relationships between series.
4. Empirical results
4.1 Connectedness analysis at the median quantile
We first analyse static volatility connectedness (Table 2). The highest values are on the diagonal, indicating dominant own effects. G7 equity market exhibit high pairwise connectedness, while commodities and bitcoin show lower connectivity. Total connectedness is 46.37% indicating moderate interdependence, with bitcoin, gold, WTI, wheat and Nikkei as net risk receivers, whereas other assets act as transmitters. The strongest pair connectivity is 21.70% produced from CAC.40 and DAX.40, implying similarities in diversification behaviour.
Volatility connectedness
| Bitcoin | Gold | WTI | SP500 | FTSE | Nikkei | DAX.40 | CAC.40 | FTSE.MIB | S.P.TSX | WHEAT | GAS | FROM | |
|---|---|---|---|---|---|---|---|---|---|---|---|---|---|
| Bitcoin | 75.33 | 1.94 | 0.69 | 5.07 | 2.02 | 1.36 | 2.58 | 2.50 | 2.80 | 4.37 | 0.60 | 0.74 | 24.67 |
| Gold | 2.38 | 72.92 | 2.49 | 2.90 | 2.05 | 1.74 | 3.32 | 3.18 | 2.83 | 4.23 | 1.13 | 0.85 | 27.08 |
| WTI | 1.20 | 2.23 | 67.35 | 2.88 | 3.82 | 1.20 | 2.90 | 3.98 | 3.83 | 7.79 | 1.62 | 1.20 | 32.65 |
| SP500 | 2.90 | 1.33 | 1.67 | 44.13 | 6.28 | 2.19 | 9.00 | 8.25 | 7.31 | 15.55 | 0.38 | 1.02 | 55.87 |
| FTSE | 1.34 | 0.97 | 1.70 | 6.98 | 42.66 | 1.95 | 12.07 | 13.49 | 10.48 | 7.28 | 0.62 | 0.47 | 57.34 |
| Nikkei | 1.84 | 1.95 | 1.68 | 9.89 | 4.57 | 48.87 | 7.80 | 7.63 | 6.60 | 7.48 | 0.64 | 1.05 | 51.13 |
| DAX.40 | 1.28 | 1.31 | 1.24 | 7.23 | 10.25 | 2.07 | 27.79 | 21.70 | 18.06 | 8.34 | 0.38 | 0.36 | 72.21 |
| CAC.40 | 1.19 | 1.15 | 1.70 | 6.64 | 11.21 | 1.98 | 21.26 | 27.20 | 18.32 | 8.65 | 0.36 | 0.32 | 72.80 |
| FTSE.MIB | 1.37 | 1.14 | 1.76 | 6.03 | 9.48 | 1.69 | 19.33 | 20.03 | 30.16 | 8.27 | 0.44 | 0.29 | 69.84 |
| S.P.TSX | 2.39 | 1.83 | 4.38 | 14.04 | 7.35 | 1.74 | 10.24 | 10.85 | 9.66 | 36.26 | 0.53 | 0.74 | 63.74 |
| WHEAT | 0.92 | 1.31 | 2.50 | 1.03 | 1.77 | 1.03 | 1.27 | 1.14 | 1.31 | 1.34 | 85.52 | 0.85 | 14.48 |
| GAS | 0.95 | 1.24 | 1.70 | 2.11 | 1.23 | 0.79 | 1.19 | 1.27 | 1.13 | 2.01 | 0.80 | 85.59 | 14.41 |
| TO | 17.76 | 16.39 | 21.50 | 64.81 | 60.01 | 17.75 | 90.96 | 94.01 | 82.32 | 75.30 | 7.50 | 7.91 | 556.22 |
| Inc.Own | 93.09 | 89.31 | 88.86 | 108.94 | 102.67 | 66.62 | 118.74 | 121.21 | 112.49 | 111.55 | 93.02 | 93.50 | cTCI/TCI |
| NET | −6.91 | −10.69 | −11.14 | 8.94 | 2.67 | −33.38 | 18.74 | 21.21 | 12.49 | 11.55 | −6.98 | −6.50 | 50.57/46.35 |
| NPT | 5.00 | 3.00 | 4.00 | 7.00 | 7.00 | 1.00 | 10.00 | 11.00 | 9.00 | 7.00 | 0.00 | 2.00 |
Note(s): Volatility connectedness for four commodities (WTI crude oil, gas, wheat and gold), bitcoin and the G7 stock market return indices for the sample period from January 1, 2017, to February 7, 2025. “FROM” indicates the total spillovers received by an asset or commodity index from all other series. “TO” indicates the total spillovers transmitted by an asset or commodity index to all other firms. TCI is the total net connectedness index. “NET” is the net spillover which is computed by the difference between the “from” and the “to” spillover index
Dynamic connectedness (Figure 2) fluctuates between 40% and 85% peaking during three major periods: late 2019 (geopolitical tensions), early 2020 (coronavirus pandemic) and 2022–2023 (Ukraine war and SVB collapse).
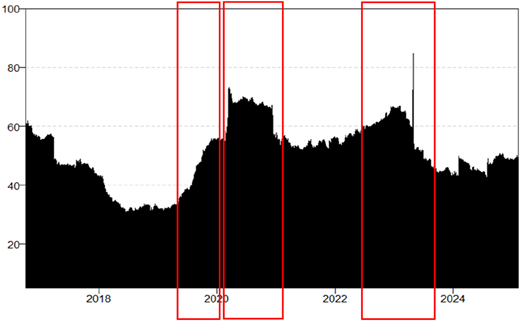
Dynamic total connectedness index of bitcoin, commodities and G7 stock market volatilities
Dynamic total connectedness index of bitcoin, commodities and G7 stock market volatilities
Connectedness reaches its maximum (85%) during COVID-19, driven by increased bitcoin volatility, simultaneous liquidation across markets and the spectacular fall in oil prices, confirming the finding of Sharif et al. (2020). Gold acted as a safe haven, while supply chain disruption raised wheat prices and increased volatility. These findings reflect prior evidence of stronger market connectedness during crises (Lyócsa et al., 2019; Umar et al., 2021, 2022; Wen et al., 2022; Yousaf and Yarovaya, 2022). Later, connectivity stabilized around 60%, likely due to positive vaccine developments that eased.
Our study aligns with previous findings highlighting stronger connectedness between G7 stocks, commodities and Bitcoin in turbulent periods and the importance of time-varying analysis (Ghorbel et al., 2024; Hussain et al., 2024; Jin and Tian, 2024; Khalfaoui et al., 2023; Zhang et al., 2020a).
4.2 Network of net pairwise directional spillover connectedness
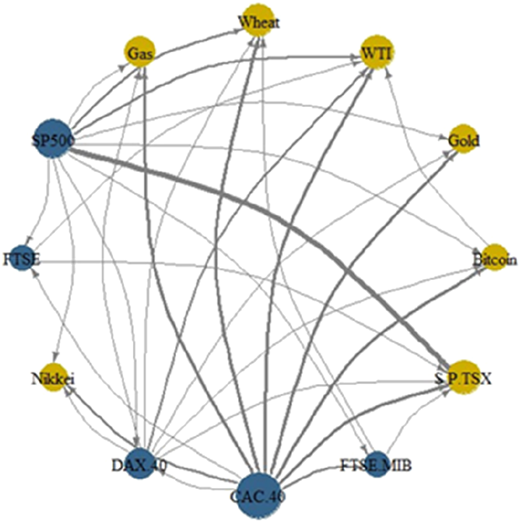
Figures 3–5 plot the directional connectedness network of total static sample implied volatility connectedness of each return indices of the G7 stock market, commodities and Bitcoin. Each directional connectedness is estimated before the COVID-19 crisis, Figure 3, during the COVID-19 crisis, Figure 4, and during the Ukraine–Russia war, Figure 5.
Figure 3 plots the directional connectedness network before COVID-19 considered as the normal period. In this phase, WTI, gold, wheat, gas, bitcoin, SP.TSX and Nikkei act as net risk receiver, while S&P 500, DAX.40, CAC.40, FTS.MIB and FTSE are net transmitters. WTI is the main receiver, followed by S&P/TSX, wheat, gas, gold, Nikkei and bitcoin. CAC 40 and S&P 500 exert the strongest spillover and represent the biggest forecast of variance contribution to all markets in the system (Table 3). Gold and bitcoin mainly receive shocks from S&P 500, CAC 40 and DAX 40 markets with no spillover detected between them in the three periods. Gold also shows no linkage with other commodities, consistent with its role as a safe-haven and wealth-preserving asset, unlike energy and agricultural commodities, which have distinct market fundamentals. The weak commodity-to-commodity correlation suggests diversification benefits within the commodity sector, lowering sector-specific risk and sensitivity.
Averaged dynamic connectedness table (pre-COVID-19 period)
| Bitcoin | Gold | WTI | Wheat | Gas | SP500 | FTSE | Nikkei | DAX.40 | CAC.40 | FTSE.MIB | S.P.TSX | FROM | |
|---|---|---|---|---|---|---|---|---|---|---|---|---|---|
| Bitcoin | 22.21 | 6.77 | 6.17 | 6.67 | 7.02 | 7.62 | 7.08 | 6.96 | 7.42 | 8.73 | 6.95 | 6.39 | 77.79 |
| Gold | 6.82 | 19.07 | 7.27 | 6.90 | 6.38 | 8.14 | 7.51 | 7.02 | 7.87 | 9.46 | 7.20 | 6.36 | 80.93 |
| WTI | 7.49 | 7.16 | 17.31 | 6.90 | 6.60 | 8.43 | 7.75 | 7.18 | 7.64 | 9.06 | 7.40 | 7.09 | 82.69 |
| Wheat | 7.30 | 7.16 | 6.83 | 18.62 | 6.57 | 8.21 | 7.33 | 6.95 | 7.72 | 9.26 | 7.22 | 6.83 | 81.38 |
| Gas | 7.55 | 6.89 | 6.63 | 6.86 | 19.66 | 7.68 | 7.07 | 6.75 | 7.72 | 9.44 | 7.23 | 6.51 | 80.34 |
| SP500 | 6.55 | 7.00 | 6.45 | 6.37 | 6.61 | 18.33 | 7.86 | 7.07 | 8.44 | 9.78 | 8.15 | 7.40 | 81.67 |
| FTSE | 7.08 | 6.78 | 6.31 | 6.38 | 6.70 | 9.32 | 16.77 | 6.84 | 8.68 | 10.31 | 7.89 | 6.95 | 83.23 |
| Nikkei | 6.61 | 6.88 | 6.45 | 6.77 | 6.74 | 8.53 | 7.44 | 18.43 | 8.46 | 9.28 | 7.68 | 6.73 | 81.57 |
| DAX.40 | 6.31 | 6.69 | 5.92 | 6.09 | 6.41 | 9.67 | 8.33 | 6.92 | 15.54 | 12.20 | 9.10 | 6.81 | 84.46 |
| CAC.40 | 5.98 | 6.49 | 5.91 | 5.92 | 6.13 | 9.98 | 8.81 | 6.83 | 10.98 | 16.50 | 9.58 | 6.89 | 83.50 |
| FTSE.MIB | 6.24 | 6.61 | 6.37 | 6.02 | 6.19 | 9.30 | 8.37 | 6.80 | 9.80 | 11.35 | 16.26 | 6.70 | 83.74 |
| S.P.TSX | 6.63 | 6.54 | 7.00 | 6.46 | 6.59 | 11.62 | 8.27 | 6.89 | 8.18 | 9.85 | 7.89 | 14.07 | 85.93 |
| TO | 74.55 | 74.97 | 71.30 | 71.33 | 71.95 | 98.50 | 85.83 | 76.21 | 92.92 | 108.71 | 86.30 | 74.66 | 987.23 |
| Inc.Own | 96.77 | 94.05 | 88.61 | 89.95 | 91.61 | 116.82 | 102.59 | 94.64 | 108.46 | 125.21 | 102.56 | 88.73 | cTCI/TCI |
| NET | −3.23 | −5.95 | −11.39 | −10.05 | −8.39 | 16.82 | 2.59 | −5.36 | 8.46 | 25.21 | 2.56 | −11.27 | 89.75/82.27 |
| NPT | 5.00 | 3.00 | 2.00 | 2.00 | 1.00 | 11.00 | 8.00 | 6.00 | 9.00 | 10.00 | 7.00 | 2.00 |
During the pandemic (Figure 4, Table 4), receiver and transmitter roles remain similar except for S&P TSX becoming a transmitter. Bitcoin becomes the strongest shock receiver comparable to wheat and Nikkei. Gold, wheat, gas and bitcoin receive spillover effect from WTI, but show no inter-commodity spillover, reflecting their different demand dynamics. Gold demand rose due to uncertainty, currency depreciation, and inflation concerns, while oil and gas prices collapsed due to declining economic activity and oversupply. Wheat became receiver from all G7 markets (except Nikkei) and from WTI, likely due to countries stockpiling to secure food supply under crisis conditions. Network distance indicates a strong connection between Nikkei and DAX.40.
Averaged dynamic connectedness table (COVID-19 period)
| Bitcoin | Gold | WTI | Wheat | Gas | SP500 | FTSE | Nikkei | DAX.40 | CAC.40 | FTSE.MIB | S.P.TSX | FROM | |
|---|---|---|---|---|---|---|---|---|---|---|---|---|---|
| Bitcoin | 12.53 | 6.80 | 7.75 | 6.67 | 7.05 | 8.68 | 7.80 | 6.48 | 8.95 | 10.24 | 9.03 | 8.01 | 87.47 |
| Gold | 6.62 | 14.93 | 7.65 | 5.90 | 6.96 | 8.53 | 7.42 | 6.15 | 8.98 | 9.95 | 8.55 | 8.37 | 85.07 |
| WTI | 5.79 | 6.19 | 16.12 | 6.03 | 6.00 | 8.38 | 8.32 | 5.89 | 9.25 | 10.83 | 8.70 | 8.51 | 83.88 |
| Wheat | 6.03 | 6.38 | 7.56 | 12.87 | 6.83 | 8.69 | 8.49 | 6.39 | 9.54 | 10.62 | 8.66 | 7.92 | 87.13 |
| Gas | 6.42 | 6.82 | 7.84 | 6.04 | 15.92 | 8.15 | 7.67 | 6.12 | 8.71 | 9.58 | 8.40 | 8.33 | 84.08 |
| SP500 | 5.67 | 6.43 | 7.24 | 5.62 | 6.28 | 15.36 | 8.42 | 6.10 | 9.77 | 10.16 | 8.76 | 10.19 | 84.64 |
| FTSE | 5.21 | 5.83 | 7.89 | 5.59 | 5.74 | 8.92 | 14.29 | 5.95 | 10.51 | 11.78 | 9.60 | 8.69 | 85.71 |
| Nikkei | 5.91 | 6.63 | 7.23 | 6.14 | 6.40 | 9.11 | 8.57 | 11.72 | 9.30 | 11.14 | 8.71 | 9.13 | 88.28 |
| DAX.40 | 5.12 | 5.64 | 7.46 | 5.67 | 5.65 | 9.05 | 9.27 | 5.57 | 14.97 | 12.43 | 10.40 | 8.77 | 85.03 |
| CAC.40 | 5.36 | 5.69 | 7.28 | 5.52 | 5.53 | 9.07 | 9.62 | 5.48 | 11.91 | 15.40 | 10.57 | 8.57 | 84.60 |
| FTSE.MIB | 5.45 | 5.92 | 7.21 | 5.55 | 5.61 | 9.10 | 9.28 | 5.55 | 11.97 | 12.09 | 13.53 | 8.75 | 86.47 |
| S.P.TSX | 5.82 | 6.30 | 7.56 | 5.54 | 6.15 | 10.03 | 8.71 | 5.80 | 9.73 | 10.61 | 9.08 | 14.68 | 85.32 |
| TO | 63.38 | 68.63 | 82.68 | 64.28 | 68.20 | 97.70 | 93.57 | 65.47 | 108.63 | 119.42 | 100.47 | 95.24 | 1027.67 |
| Inc.Own | 75.92 | 83.56 | 98.79 | 77.15 | 84.11 | 113.06 | 107.86 | 77.20 | 123.60 | 134.82 | 114.00 | 109.92 | cTCI/TCI |
| NET | −24.08 | −16.44 | −1.21 | −22.85 | −15.89 | 13.06 | 7.86 | −22.80 | 23.60 | 34.82 | 14.00 | 9.92 | 93.42/85.64 |
| NPT | 0.00 | 3.00 | 5.00 | 1.00 | 4.00 | 8.00 | 7.00 | 2.00 | 10.00 | 11.00 | 8.00 | 7.00 |
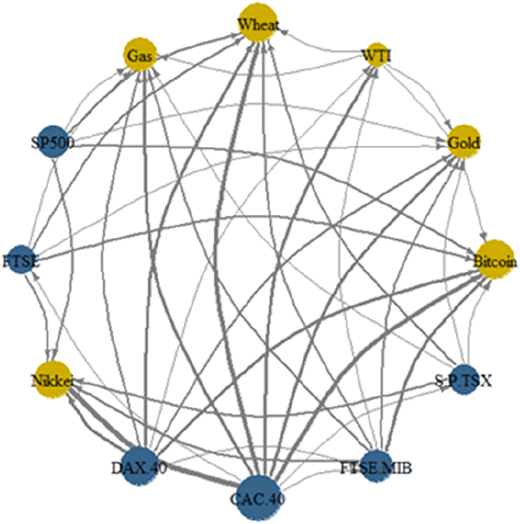
Figure 5 illustrates the network during the Russia–Ukraine war. The system becomes more complex than during pandemic, with significant role reversals: WTI shifts to a net transmitter, while S&P500 becomes a receiver (Table 5). Nikkei remains the major receiver, now impacted by all indices except for gas. FTSE exerts the strongest spillover effect, followed by WTI, highlighting war-driven sensitivity to energy shocks. Disruptions to trade routes, supply chains, international commerce and sanctions on Russia, a top global oil exporter, explain WTI's risk transmission role.
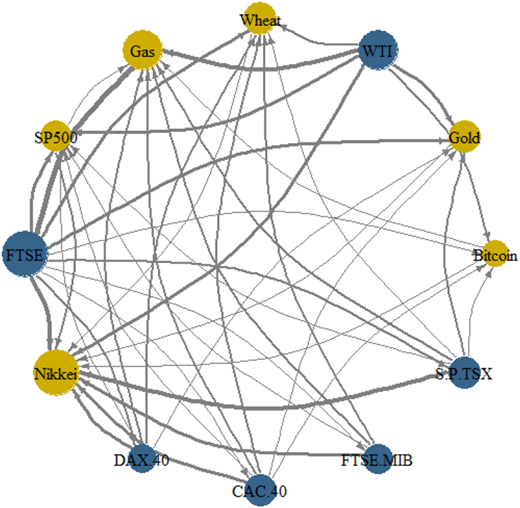
Directional connectedness network during the Ukraine–Russia war. Note Figures 3–5: Every index is defined as a node and a directional edge from i to j exists only if the net pairwise connectedness from i to j is positive. The nodes represent the return indices of the G7 stock market, commodities and bitcoin. The blue colour notes the net risk-transmitting index and the yellow colour notes the net risk-receiving index. The bold lines between each node indicate high spillover between different return indices. The larger the directional line, the greater the net impact of volatility on the financial market
Directional connectedness network during the Ukraine–Russia war. Note Figures 3–5: Every index is defined as a node and a directional edge from i to j exists only if the net pairwise connectedness from i to j is positive. The nodes represent the return indices of the G7 stock market, commodities and bitcoin. The blue colour notes the net risk-transmitting index and the yellow colour notes the net risk-receiving index. The bold lines between each node indicate high spillover between different return indices. The larger the directional line, the greater the net impact of volatility on the financial market
Averaged dynamic connectedness table (during the Ukraine–Russia war)
| Bitcoin | Gold | WTI | Wheat | Gas | SP500 | FTSE | Nikkei | DAX.40 | CAC.40 | FTSE.MIB | S.P.TSX | FROM | |
|---|---|---|---|---|---|---|---|---|---|---|---|---|---|
| Bitcoin | 14.93 | 7.15 | 8.93 | 7.04 | 5.99 | 7.01 | 9.31 | 6.08 | 7.96 | 8.34 | 8.25 | 9.02 | 85.07 |
| Gold | 7.37 | 13.02 | 9.55 | 6.74 | 6.43 | 6.98 | 9.87 | 5.47 | 8.26 | 8.93 | 8.15 | 9.23 | 86.98 |
| WTI | 5.91 | 5.92 | 28.42 | 6.17 | 4.59 | 5.02 | 8.50 | 5.22 | 7.46 | 7.71 | 7.72 | 7.35 | 71.58 |
| Wheat | 7.04 | 7.02 | 9.21 | 12.47 | 6.90 | 6.80 | 9.48 | 5.43 | 8.95 | 8.88 | 8.94 | 8.88 | 87.53 |
| Gas | 7.77 | 6.99 | 8.87 | 7.68 | 12.36 | 7.49 | 10.21 | 5.64 | 7.84 | 8.59 | 8.04 | 8.51 | 87.64 |
| SP500 | 7.83 | 7.11 | 8.41 | 6.90 | 5.89 | 11.43 | 9.95 | 5.58 | 9.02 | 9.01 | 8.84 | 10.03 | 88.57 |
| FTSE | 7.19 | 6.36 | 7.24 | 6.25 | 4.87 | 6.23 | 22.88 | 5.29 | 7.83 | 9.17 | 8.35 | 8.34 | 77.12 |
| Nikkei | 7.89 | 7.12 | 9.30 | 6.87 | 6.18 | 8.50 | 9.79 | 8.63 | 8.54 | 8.66 | 8.47 | 10.07 | 91.37 |
| DAX.40 | 7.35 | 6.81 | 8.03 | 6.51 | 5.65 | 7.38 | 10.19 | 5.06 | 12.15 | 10.93 | 10.76 | 9.18 | 87.85 |
| CAC.40 | 6.96 | 6.90 | 8.52 | 6.52 | 5.91 | 7.00 | 10.92 | 5.00 | 10.02 | 12.97 | 10.07 | 9.22 | 87.03 |
| FTSE.MIB | 7.70 | 7.06 | 7.96 | 6.16 | 5.69 | 7.16 | 10.31 | 5.24 | 10.12 | 10.33 | 13.11 | 9.17 | 86.89 |
| S.P.TSX | 7.23 | 6.95 | 8.22 | 6.91 | 6.03 | 8.32 | 10.74 | 5.39 | 9.28 | 9.01 | 8.39 | 13.53 | 86.47 |
| TO | 80.24 | 75.37 | 94.22 | 73.73 | 64.14 | 77.90 | 109.26 | 59.41 | 95.27 | 99.58 | 95.98 | 99.00 | 1024.10 |
| Inc.Own | 95.17 | 88.39 | 122.64 | 86.20 | 76.49 | 89.33 | 132.15 | 68.04 | 107.42 | 112.54 | 109.09 | 112.54 | cTCI/TCI |
| NET | −4.83 | −11.61 | 22.64 | −13.80 | −23.51 | −10.67 | 32.15 | −31.96 | 7.42 | 12.54 | 9.09 | 12.54 | 93.10/85.34 |
| NPT | 5.00 | 4.00 | 10.00 | 3.00 | 1.00 | 2.00 | 11.00 | 0.00 | 7.00 | 8.00 | 7.00 | 8.00 |
Bitcoin appears less impacted by war than in period of COVID, reflecting its perception as a hedge or safe haven in geopolitical uncertainty, consistent with Chkili et al. (2021), Mokni et al. (2021). Meanwhile, CAC.40 and DAX.40 nodes shrink notably compared to COVID-19, reflecting different crisis scales: the pandemic generated global economic disruptions, whereas the Ukraine–Russia war was a regional geopolitical conflict producing milder global financial contagion.
4.3 The quantile connectedness analysis
Figure 6 illustrates the total dynamic spillover under the extreme quantiles. Warmer shades indicate stronger connectivity. Consistent with Chen and Qi (2024), Khalfaoui et al. (2022), Mensi et al. (2023), total connectedness rises at upper and lower quantiles (above 80th and below 20th), indicating symmetric risk transmission. Several high spillover episodes emerge: late-2017, mid-2019, early-2020 and early-2022. Although connectivity dropped at the start of 2021, it remains important following the waves of COVID-19 (Naeem et al., 2023; Umar and Gubareva, 2020).
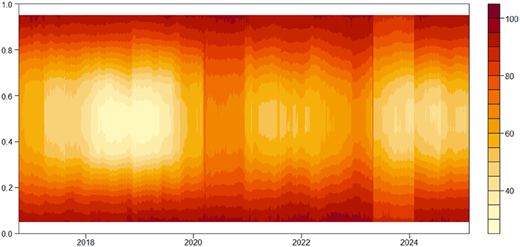
The high connectivity at the late-2017 coincides with Bitcoin's boom and increased market attention. Mid-2019 spillovers reflect the US FED rate cut to 0.25% which increased speculation. The sharp rise in 2020 aligns with the COVID-19 crisis, and early-2022 connectivity results from the Ukraine–Russia war. These findings confirm that risk transmission is event-dependent and sensitive to global shocks.
Dynamic directional results (Figure 7) show G7 stock indices (except Nikkei) are net contributors of impacts. Meanwhile, wheat, gas, oil, gold, bitcoin and Nikkei are net receivers, with Nikkei appearing as the most absorber of shocks during geopolitical uncertainty. For commodities, wheat, gas, WTI and gold are mostly net impact takers with heightened spillovers observed during COVID-19. Other G7 series intensify transmission near late-2019, mid-2020, late-2021 and late-2022 to early-2023. Bitcoin behaves mainly as a receiver and more generator at extreme lower and upper quantiles, showing a pattern similar to gold.
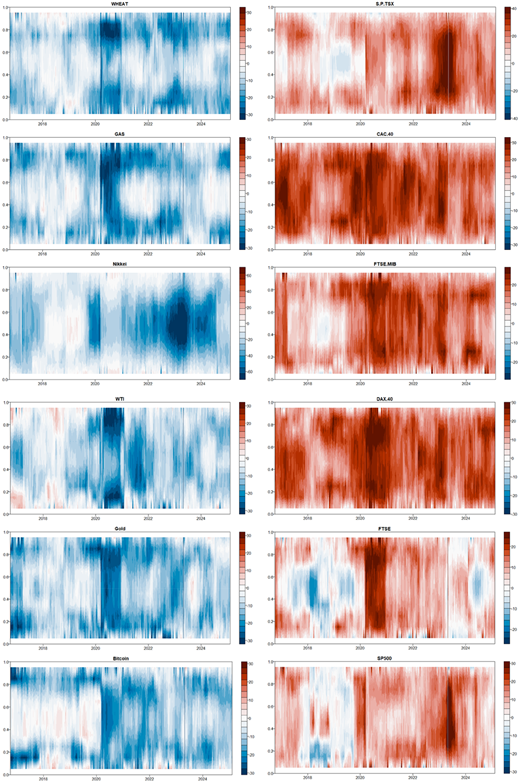
Heatmap visualization of the net total directional connectedness of across time. Notes: in the heatmap we present the net connectedness behaviour of the market where dark blue (net taker) and dark red (net sender). Note: The red colour indicates that the asset is a net transmitter of shock and the blue colour indicates that the asset index is a net receiver of shock
Heatmap visualization of the net total directional connectedness of across time. Notes: in the heatmap we present the net connectedness behaviour of the market where dark blue (net taker) and dark red (net sender). Note: The red colour indicates that the asset is a net transmitter of shock and the blue colour indicates that the asset index is a net receiver of shock
4.4 Quantile time–frequency analysis
Now, let's analyse the quantile frequency dynamic connectedness. We emphasize the spillovers between frequencies to show that each asset has a different role in the short and long term. Tables 6–8 report connectedness metrics and capture spillover effects across our assets crosswise different horizons. Each shock is decomposed into short-term (1-5 days, Table 7) and long-term (5 +, Table 8) spillovers.
Dynamic total connectedness: total
| Bitcoin | Gold | WTI | SP500 | FTSE | Nikkei | DAX.40 | CAC.40 | FTSE.MIB | S.P.TSX | WHEAT | GAS | FROM | |
|---|---|---|---|---|---|---|---|---|---|---|---|---|---|
| Bitcoin | 69.56 | 3.09 | 1.62 | 5.09 | 2.50 | 2.17 | 2.90 | 2.80 | 2.85 | 4.39 | 1.38 | 1.65 | 30.44 |
| Gold | 3.05 | 63.40 | 3.03 | 4.23 | 2.97 | 2.22 | 4.47 | 4.30 | 3.84 | 4.84 | 2.00 | 1.65 | 36.60 |
| WTI | 2.02 | 2.84 | 60.08 | 3.62 | 4.51 | 1.92 | 3.97 | 4.57 | 4.43 | 7.86 | 2.23 | 1.95 | 39.92 |
| SP500 | 3.29 | 2.32 | 2.23 | 41.16 | 6.48 | 2.29 | 8.96 | 8.34 | 7.39 | 15.11 | 0.89 | 1.54 | 58.84 |
| FTSE | 1.93 | 1.54 | 2.21 | 7.51 | 37.66 | 2.44 | 12.17 | 13.80 | 10.84 | 7.65 | 1.21 | 1.05 | 62.34 |
| Nikkei | 2.46 | 2.97 | 2.47 | 9.87 | 4.97 | 44.29 | 8.00 | 7.80 | 6.85 | 7.32 | 1.30 | 1.70 | 55.71 |
| DAX.40 | 1.53 | 2.09 | 1.79 | 7.46 | 10.46 | 2.39 | 27.33 | 20.37 | 16.98 | 7.85 | 0.98 | 0.75 | 72.67 |
| CAC.40 | 1.51 | 1.97 | 2.13 | 6.91 | 11.53 | 2.41 | 19.85 | 26.57 | 17.27 | 8.17 | 0.92 | 0.74 | 73.43 |
| FTSE.MIB | 1.60 | 1.99 | 2.22 | 6.31 | 9.77 | 2.08 | 18.07 | 18.91 | 29.59 | 7.73 | 0.98 | 0.76 | 70.41 |
| S.P.TSX | 2.75 | 2.68 | 4.66 | 14.09 | 7.56 | 2.17 | 9.44 | 10.20 | 8.92 | 35.30 | 1.03 | 1.22 | 64.70 |
| WHEAT | 2.25 | 2.24 | 3.25 | 2.14 | 2.87 | 1.67 | 2.52 | 2.42 | 2.57 | 2.47 | 73.52 | 2.07 | 26.48 |
| GAS | 1.88 | 2.18 | 2.50 | 2.99 | 2.07 | 1.62 | 2.24 | 2.36 | 2.23 | 2.84 | 2.08 | 75.02 | 24.98 |
| TO | 24.28 | 25.90 | 28.11 | 70.21 | 65.70 | 23.38 | 92.58 | 95.88 | 84.17 | 76.23 | 15.01 | 15.06 | 616.52 |
| Inc.Own | 93.84 | 89.31 | 88.19 | 111.36 | 103.36 | 67.68 | 119.91 | 122.45 | 113.77 | 111.53 | 88.53 | 90.08 | cTCI/TCI |
| Net | −6.16 | −10.69 | −11.81 | 11.36 | 3.36 | −32.32 | 19.91 | 22.45 | 13.77 | 11.53 | −11.47 | −9.92 | 56.05/51.38 |
| NPDC | 4.00 | 4.00 | 4.00 | 7.00 | 6.00 | 1.00 | 10.00 | 11.00 | 9.00 | 8.00 | 1.00 | 1.00 |
Dynamic total connectedness: short-term 1–5
| Bitcoin | Gold | WTI | SP500 | FTSE | Nikkei | DAX.40 | CAC.40 | FTSE.MIB | S.P.TSX | WHEAT | GAS | FROM | |
|---|---|---|---|---|---|---|---|---|---|---|---|---|---|
| Bitcoin | 63.96 | 2.83 | 1.48 | 4.72 | 2.30 | 1.99 | 2.69 | 2.61 | 2.63 | 4.07 | 1.26 | 1.53 | 28.11 |
| Gold | 2.79 | 57.64 | 2.69 | 3.88 | 2.70 | 1.98 | 4.06 | 3.92 | 3.48 | 4.33 | 1.82 | 1.48 | 33.12 |
| WTI | 1.83 | 2.59 | 54.63 | 3.26 | 4.01 | 1.71 | 3.61 | 4.09 | 3.98 | 6.94 | 2.00 | 1.74 | 35.76 |
| SP500 | 2.99 | 2.18 | 2.08 | 37.43 | 5.95 | 2.10 | 8.21 | 7.63 | 6.74 | 13.78 | 0.81 | 1.37 | 53.83 |
| FTSE | 1.77 | 1.39 | 2.05 | 6.53 | 34.35 | 2.18 | 10.98 | 12.48 | 9.80 | 6.63 | 1.09 | 0.96 | 55.87 |
| Nikkei | 2.20 | 2.63 | 2.23 | 8.57 | 4.36 | 40.09 | 6.93 | 6.77 | 5.96 | 6.35 | 1.21 | 1.55 | 48.77 |
| DAX.40 | 1.37 | 1.88 | 1.66 | 6.54 | 9.54 | 2.12 | 24.92 | 18.60 | 15.55 | 6.90 | 0.90 | 0.68 | 65.74 |
| CAC.40 | 1.36 | 1.76 | 1.98 | 6.11 | 10.51 | 2.14 | 18.19 | 24.22 | 15.77 | 7.19 | 0.84 | 0.67 | 66.53 |
| FTSE.MIB | 1.46 | 1.80 | 2.06 | 5.63 | 8.89 | 1.83 | 16.45 | 17.19 | 26.99 | 6.83 | 0.87 | 0.69 | 63.71 |
| S.P.TSX | 2.41 | 2.43 | 4.31 | 12.58 | 6.86 | 1.92 | 8.50 | 9.16 | 8.01 | 31.57 | 0.91 | 1.09 | 58.18 |
| WHEAT | 2.07 | 2.09 | 2.92 | 1.95 | 2.60 | 1.52 | 2.22 | 2.19 | 2.31 | 2.20 | 66.59 | 1.84 | 23.90 |
| GAS | 1.72 | 2.00 | 2.32 | 2.72 | 1.91 | 1.44 | 2.07 | 2.19 | 2.08 | 2.57 | 1.91 | 68.61 | 22.93 |
| TO | 21.97 | 23.59 | 25.79 | 62.50 | 59.64 | 20.93 | 83.90 | 86.83 | 76.31 | 67.79 | 13.62 | 13.58 | 556.44 |
| Inc.Own | 85.93 | 81.23 | 80.42 | 99.93 | 94.00 | 61.02 | 108.82 | 111.05 | 103.30 | 99.36 | 80.21 | 82.19 | cTCI/TCI |
| Net | −6.14 | −9.53 | −9.97 | 8.66 | 3.78 | −27.84 | 18.16 | 20.30 | 12.60 | 9.61 | −10.28 | −9.35 | 50.59/46.37 |
| NPDC | 4.00 | 4.00 | 4.00 | 7.00 | 7.00 | 1.00 | 10.00 | 11.00 | 9.00 | 7.00 | 1.00 | 1.00 |
Dynamic total connectedness: long-term 5-Inf
| Bitcoin | Gold | WTI | SP500 | FTSE | Nikkei | DAX.40 | CAC.40 | FTSE.MIB | S.P.TSX | WHEAT | GAS | FROM | |
|---|---|---|---|---|---|---|---|---|---|---|---|---|---|
| Bitcoin | 5.59 | 0.25 | 0.14 | 0.37 | 0.19 | 0.18 | 0.21 | 0.20 | 0.22 | 0.32 | 0.13 | 0.12 | 2.33 |
| Gold | 0.26 | 5.76 | 0.33 | 0.35 | 0.27 | 0.24 | 0.41 | 0.39 | 0.36 | 0.51 | 0.18 | 0.17 | 3.48 |
| WTI | 0.19 | 0.25 | 5.45 | 0.36 | 0.49 | 0.21 | 0.36 | 0.49 | 0.45 | 0.92 | 0.23 | 0.21 | 4.16 |
| SP500 | 0.30 | 0.15 | 0.15 | 3.72 | 0.53 | 0.19 | 0.75 | 0.71 | 0.65 | 1.33 | 0.08 | 0.17 | 5.01 |
| FTSE | 0.16 | 0.15 | 0.16 | 0.97 | 3.31 | 0.26 | 1.18 | 1.32 | 1.04 | 1.02 | 0.12 | 0.09 | 6.47 |
| Nikkei | 0.26 | 0.34 | 0.24 | 1.29 | 0.61 | 4.20 | 1.06 | 1.03 | 0.90 | 0.97 | 0.09 | 0.15 | 6.94 |
| DAX.40 | 0.16 | 0.21 | 0.14 | 0.92 | 0.93 | 0.27 | 2.41 | 1.77 | 1.43 | 0.95 | 0.08 | 0.07 | 6.93 |
| CAC.40 | 0.15 | 0.20 | 0.15 | 0.80 | 1.03 | 0.27 | 1.67 | 2.35 | 1.50 | 0.98 | 0.08 | 0.07 | 6.90 |
| FTSE.MIB | 0.14 | 0.19 | 0.16 | 0.68 | 0.87 | 0.25 | 1.61 | 1.72 | 2.60 | 0.90 | 0.11 | 0.07 | 6.70 |
| S.P.TSX | 0.34 | 0.25 | 0.35 | 1.51 | 0.70 | 0.25 | 0.94 | 1.04 | 0.91 | 3.73 | 0.12 | 0.13 | 6.53 |
| WHEAT | 0.18 | 0.16 | 0.33 | 0.19 | 0.27 | 0.15 | 0.30 | 0.23 | 0.27 | 0.27 | 6.92 | 0.24 | 2.58 |
| GAS | 0.16 | 0.17 | 0.17 | 0.27 | 0.17 | 0.18 | 0.17 | 0.17 | 0.15 | 0.27 | 0.17 | 6.41 | 2.05 |
| TO | 2.31 | 2.32 | 2.32 | 7.71 | 6.06 | 2.46 | 8.68 | 9.05 | 7.86 | 8.45 | 1.39 | 1.48 | 60.08 |
| Inc.Own | 7.90 | 8.08 | 7.77 | 11.43 | 9.36 | 6.65 | 11.09 | 11.40 | 10.47 | 12.17 | 8.32 | 7.89 | cTCI/TCI |
| Net | −0.02 | −1.16 | −1.84 | 2.70 | −0.42 | −4.49 | 1.75 | 2.15 | 1.16 | 1.92 | −1.19 | −0.57 | 5.46/5.01 |
| NPDC | 6.00 | 2.00 | 3.00 | 11.00 | 6.00 | 2.00 | 8.00 | 10.00 | 8.00 | 7.00 | 1.00 | 2.00 |
Figure 8 distinguishes short- and long-term connectedness, where red shades represent short-term spillover and green indicates long-term effects. Red area predominant (TCI = 46.37%) compared to long-term movement (TCI = 5.01), suggesting that volatility transmission occurs rapidly, mainly within five days, and is largely driven by CAC40 (86.83%) and DAX40 (83.90%). This strong short-term interconnectedness may reduce diversification benefits during the volatile periods. Conversely, the weaker long-term spillovers (5.01%) suggests that shocks dissipate over time, with bitcoin, gold, WTI, wheat and gas revealing lower total connectedness, suggesting potential diversification value.
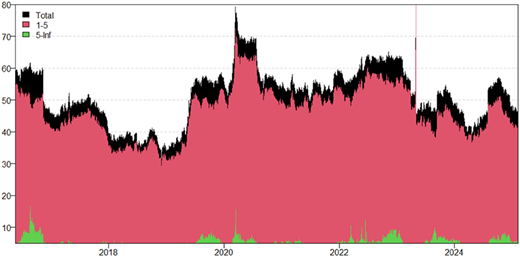
Figure 9 presents the results concerning the net transmission power of each series. Time–frequency analysis offers valuable insights into an asset's role as a diversifier, safe haven or hedging asset by capturing how dependencies between assets evolve across different market conditions (quantiles) and time horizons (frequency domain). Well, assets may behave differently in the short-term (high-frequency movements) vs the long-term (low-frequency cycles).
Short-term, long-term and overall net total directional connectedness for each asset. Note: The net total directional connectedness is decomposed into short-term (high frequency reactions: speculative, panic-driven) and long-term dynamics (persistent, fundamental-driven spillovers). We note that positive values indicate shock's transmitters, while negative values correspond to net receivers
Short-term, long-term and overall net total directional connectedness for each asset. Note: The net total directional connectedness is decomposed into short-term (high frequency reactions: speculative, panic-driven) and long-term dynamics (persistent, fundamental-driven spillovers). We note that positive values indicate shock's transmitters, while negative values correspond to net receivers
To define the roles played by assets, we use Baur and Lucey (2010) work and findings of Kyriazis et al. (2024). Assets like S&P500, CAC40, DAX40, FTSE and FTSE MIB are clearly identified as net transmitters that propagate volatility across markets so they don't provide hedging or safe haven features, functioning more as speculative assets. Bitcoin, Gold, Nikkei, Wheat and Gas mainly act as net receivers during both turbulent and normal periods, meaning they absorb rather than propagate shocks. These assets can serve not only as safe havens during crises but also as hedging assets during stable conditions. Given their consistent role of net receiver, they can be overweighted as a hedge against market downturns. Investors might need to adjust their portfolios to mitigate risks associated with WTI crude oil. Short-term connectedness dominates, suggesting that portfolios need rapid adjustments during crisis period.
Here is a summary of asset roles (Table 9) in short-term vs long-term period based on net spillovers and variance shares.
Summary of behaviour of different assets in short- and long-term period
| Asset: Net spillover | Stable conditions | Short-term role (1-5 Days) | Long-term role |
|---|---|---|---|
| Bitcoin −6,16 | Hedging behaviour. Conditional diversifier. Speculative asset | Net receiver of shocks: safe haven role | Higher volatility: speculative asset. Can also play a hedging role |
| Gold −10,69 | Dual role as hedge and safe haven due to moderate connectedness and negative net spillover. Can be used as a diversifier to reduce overall portfolio volatility | Strong safe-haven, absorbing shocks effectively | Hedging behaviour: Stable store of value Decoupling from other assets over time |
| WTI (Oil) −11,81 | Cyclical risk receiver and transmitter | Net receiver; driven by demand/supply shocks | Adjust portfolios to mitigate risks associated with WTI |
| SP500 +11,36 | Risk Amplifier (High TO: 70.21%) drives returns but increases risk | Net transmitter; drives global equity contagion | Essential but high-risk equity exposure |
| DAX/CAC +19,91/+22,45: higher spillover transmitter | Risk amplifiers, driving returns but increasing exposure. Limited diversification potential | Net transmitter: regional shock amplifiers. Highly sensitive to European market conditions Risky in downturns | Persistent amplifiers, sustaining risk transmission. Requires diversification to mitigate spillovers |
| FTSE +3,36 | Risk amplifier | Volatile, risk-reactive | transmits at lower intensity |
| FTSE.MIB +13,77 | Risk amplifier (high to: 84.17). Ties to European equity risk | Behaves as a strong net transmitter: Pair FTSE.MIB with short-term hedges (Gold) | High correlation with stocks necessitates proactive hedging strategies |
| Nikkei −32,32 | Moderate diversifier | Low global spillovers. Safe-haven equity | Hedging behaviour |
| Wheat −11,47 | Diversifier with traditional assets, hedging behaviour | Isolated (73.52% own variance); spikes during supply crises | Long-term inflation/food-security hedge |
| Gas −9,92 | Diversifier with traditional assets, hedging behaviour | Minimal spillovers; short-term price volatility | Energy market stabilizer |
4.5 Discussion
Our research shows a dynamic and crisis-driven connectedness among G7 equities, commodities and Bitcoin. Spillovers peak in late 2019, early-2020 (COVID onset) and early-2022 (Ukraine war), validating hypothesis 1: extreme events amplify volatility transmission (Umar et al., 2021; Wen et al., 2022).
Regarding asset roles, G7 indices (except Nikkei) consistently send volatility, while commodities and bitcoin absorb shocks, confirming hypothesis 2. This aligns with (Khalfaoui et al., 2023; Lang et al., 2024). Ben Salem and El Aoun (2025) demonstrate G7 dominance in transmitting volatility, except for Japan. We also confirm prior studies (Chkili et al., 2021; Mokni et al., 2021) that bitcoin often acts as a safe haven. However, WTI defies H2 during the Ukraine war. Instead of taking risks, WTI becomes a dominant transmitter in the conflict. Thus, while H2 holds qualitatively, energy commodities may invert their role under severe geopolitical tension.
Ozcelebi and Kang (2024) show S&P500 and WTI as transmitters at lower and median quantiles, with extreme quantiles producing high connectedness. We similarly observe event-dependent asymmetry; however, unlike their findings, S&P500's role changes across crises, becoming a net receiver during the Ukraine war. Conversely, WTI emerges as a major transmitter in the war, reflecting how geopolitical risk can alter energy market roles. The war induced sharp spillovers from oil to gas, agricultural commodities and equities, supporting hypothesis 3, that geopolitical disruptions reshape commodity linkages through export restrictions and energy shocks.
Short-term connectedness dominates under normal conditions, whereas extreme states sharply increase linkage. We similarly find that short-run (high-frequency) spillovers greatly exceed long-term effects. This confirms Hypothesis 4, as most shocks propagate quickly through the system and then dissipate, meaning portfolios must adjust rapidly in crises.
Overall, our results largely follow the literature: crises heighten spillovers, stock indices usually drive risks and assets like gold, wheat and Bitcoin tend to hedge them. At the same time, we extend previous work by showing how different crises can change asset roles. These findings reinforce the conclusions of Ozcelebi et al. (2025) on the value of dynamic strategies in highly connected markets.
4.6 Robustness check: quantile wavelet coherence (QWC) analysis
To strengthen the robustness of our empirical findings, we apply the quadruple wavelet coherence (QWC) approach. This technique allows us to assess multi-dimensional, time–frequency interdependencies among multiple asset classes and to capture both nonlinear dependence and temporal heterogeneity. In particular, we test the joint effects of G7 equities (except Nikkei) on the commodities. Each commodity serves as the dependent variable, while the selected equity indices represent the potential transmitters of shocks across regions (set y = commodity, and x = a set of equity indices).
We use eight representative quadruples as presented in Figure 10. The red zones indicate high coherence values (close to 1) and reveal strong connectedness between assets. In contrast, the blue areas represent weak coherence, where asset movements are largely decoupled, reflecting diversification potential.
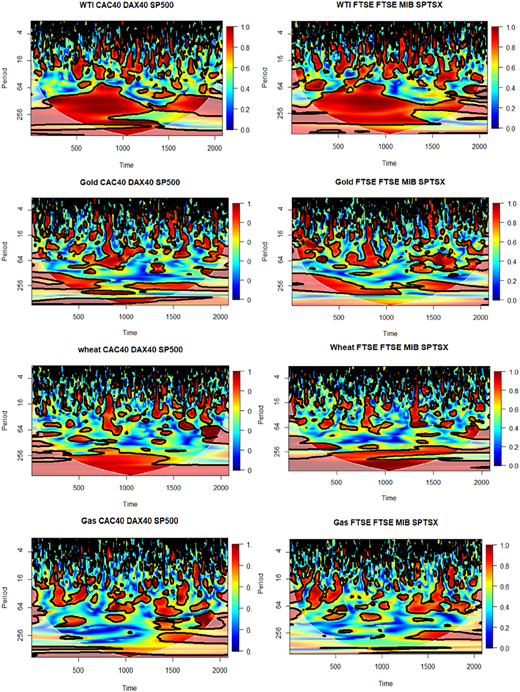
The QWC results align closely with and corroborate the conclusions of our multi-method frameworks. Across nearly all assets, we detect peaks within the two major crisis episodes, which means that correlation coefficients intensify. This is visualized by the prominent vertical bands of red and yellow during these periods. This provides evidence for Hypothesis 1, confirming that crises amplify cross-market connectedness and risk transmission.
The strongest correlations are concentrated in the upper and middle areas of the graphs corresponding to short-term and medium-term bands (periods 4–64 days). This high-frequency co-movement reflects rapid contagion and investor overreaction during turbulent times. This aligns with our time-frequency results that showed short-term spillovers are dominant. This offers strong support for Hypothesis 4. In contrast, at long-term horizons (periods>128 days), coherence weakens, resulting in more stable and often more persistent correlation. This suggests that the long-term driven co-movements are less affected, and the strong short-term contagion does not necessarily translate into permanent integration.
High coherence (red zones) concentrated in the short- and medium-term horizons confirms globally that commodity prices and equity indices moved closely together during crisis regimes, which identified commodities as a net receiver of spillovers from G7 equities in those periods. This is consistent with our TVP-VAR results and supports our Hypothesis 2. Coherence peaks are clustered around major geopolitical crises, which confirm our Hypothesis 3. In addition, the wavelet spectrum highlights short-term episodes of intense interdependencies between gas, WTI and equities, consistent with the time–frequency analysis, where European indices (in particular) amplified connectedness in the energy block. Hence, the QWC results confirm the robustness of our earlier inference: energy connectedness is crisis-sensitive, short-term and geographically asymmetric.
Gas, wheat and gold reveal heterogeneous coherence structure. Meanwhile, the partial decoupling of these commodities from the considered equities (blue area) at different scales supports a weaker correlation. They show isolated patches underscoring their behaviour of net receivers of shocks and their roles as potential diversifiers.
Across all four commodities, the QWC evidence supports the key conclusions derived from our study. Moreover, the asymmetric coherence patterns across quantiles confirm the nonlinear and state-dependent nature of these relationships, thus reinforcing the validity of the quantile-based connectedness analysis. In sum, the QWC robustness test demonstrates that the multi-method approach (TVP-VAR, QVAR and time–frequency decomposition) provides consistent and complementary evidence of cross-market spillovers under crisis conditions.
5. Conclusion
This study provides new insights into the dynamic quantile and time–frequency connectedness among G7 stock markets, major commodities (gold, WTI, wheat and gas) and bitcoin across different crisis regimes. The empirical results demonstrate that volatility spillovers exhibit nonlinear, time-varying and frequency-dependent characteristics and intensify sharply during the COVID-19 pandemic and the Russia–Ukraine war. The findings reveal that G7 stock indices, except Nikkei, consistently act as net transmitters of shocks, amplifying risk across markets. In contrast, commodities and bitcoin primarily behave as receivers, demonstrating their potential safe-haven and hedging roles under stress. WTI's transition from a risk receiver to a dominant transmitter during the war emphasizes the strong effect geopolitical tensions have on energy market volatility and systemic risk. Moreover, the dominance of short-term spillovers implies that shocks propagate rapidly across markets and fade over longer horizons, highlighting the requirement of dynamic, high-frequency risk management.
In the three areas, gold and bitcoin receive in the same way and the magnitude of correlation varies over time. In the period of stable events, bitcoin and gold exhibit weak net pairwise directional connectedness (except with CAC40). The evidence of this weakness suggests a potential diversification advantage based on bitcoin or gold, and other assets except CAC40. Well, they are influenced by variation in French market indices. We can say that they have the same behaviour in terms of the role played when introduced in a portfolio. Furthermore, the findings suggest that Bitcoin and gold are more impacted in pandemic period than in times of war conflict. In fact, in the period of pandemic, the use of Internet and virtual payment exploded so bitcoin was sensitive to fluctuations in other markets.
We can also notice that bitcoin same to acts more like commodity than like market G7 indices (except Nikkei). Being a receiver as well as wheat and gas (especially in the pandemic period) means that assets were affected by uncertainty related to the health crisis in the same way (panic, sentiment, fake news, media reporting). So cryptocurrency reacts like raw materials that represent strategic natural resources and frequently offer a store value.
Concerning gold, it is used as a safe-haven asset in a period of crisis. Well, it is a precious metal.
In all circumstances, the Japanese market behaves like bitcoin and commodities considered. So, these assets can be represented similarly in terms of portfolio strategy. In addition, Nikkei presents the most sensitive receiver of shocks, especially in the Ukraine–Russia war. Well, it was a robust economic relationship between Japan and both Russia and Ukraine. So, geopolitical tensions impact Japanese enterprises and their stock values which lead to volatility in Nikkei.
Our study contributes to the existing literature both theoretically and empirically by offering more understanding of financial connectedness during crises.
5.1 Theoretical and empirical contributions
Theoretically, we move beyond the question of if markets are connected to investigate how these connections behave under different market states and investment horizons. We test and confirm the presence of asymmetric spillovers, where the transmission of risk is not uniform but is significantly more intense during extreme market conditions. Furthermore, we provide evidence of regime changes in the roles of key assets, demonstrating that an asset's function as a net transmitter or receiver of shocks is not fixed and depends on the nature of crisis.
Empirically, our research extends the literature on financial contagion by integrating three complementary advanced methodologies: TVP-VAR, quantile VAR and time–frequency connectedness, to apprehend nonlinear, asymmetric and horizon-specific interactions. This multidimensional approach contributes to the theoretical understanding of market connectedness by highlighting how crisis-specific factors can reverse the transmitter–receiver roles of assets (e.g. WTI oil during the Ukraine war). The study also aligns with and enriches recent works (Ozcelebi and Kang, 2024; Ozcelebi et al., 2025) showing that extreme market conditions amplify short-run co-movements, thereby refining theories of systemic risk and asset interdependence under stress.
5.2 Practical and policy implications
Given the dominant short-term connectedness that characterizes crisis periods, Investors should adopt tactical and dynamic portfolio strategies to mitigate risks effectively. Gold, bitcoin, wheat and gas can be prioritized for hedging and safe-haven instruments, while energy commodities and major stock indices require careful monitoring due to their role as volatility transmitters in crises. For policymakers, the evidence of short-term contagion emphasizes the importance of timely market surveillance, early-warning systems and frequently adjusting portfolios to mitigate systemic risk during health or geopolitical crises. The energy market requires close monitoring and dynamic exposure control. In addition, our findings reveal a weak interconnection between the commodities themselves, especially outside of oil. This indicates that maintaining diversified portfolio of commodities (including gold, wheat, gas) can reduce risk, since these markets do not move in perfect synchrony. Thus, diversification across heterogeneous commodities remains beneficial. Finally, given the evidence of regime-dependent spillovers, regulators and risk managers should incorporate extreme event stress scenarios in systemic risk assessments and capital allocation.
5.3 Limitations and future research
Despite its contributions, our research is subject to certain limitations that also present opportunities for future investigations. First, it focuses on a specific set of assets: a certain group of commodities, one cryptocurrency and G7 equity indices; expanding to wider asset classes (e.g. bonds, blue assets, green assets or volatility indices) could offer a more complete view of connectedness network. Second, the analysis is limited to daily frequency data, including intraday data may capture even faster spillover channels. Third, while our study considers stress periods qualitatively, future research could formally integrate macroeconomic variables or uncertainty indices (such as geopolitical risk indicators, or VIX, EPU, GPR) to quantify the propagation mechanisms. It would be fruitful to explore nonlinear causality, machine-learning-based connectedness models and high-dimensional network analytics; this further strengthens the theoretical and empirical thought of dynamic market interconnection.
Note
The table of BDS test is available upon request.
