Recycling concrete is essential for reducing the environmental impact of the construction sector, yet the reuse of recycled cement fines remains limited due to challenges in separation. The Smart Crusher applies to a selective mechanical process designed to separate cement paste from natural aggregates during processing. Its performance depends strongly on the mechanical configuration, particularly the jaw angle. This study investigates two configurations of the moving jaw (90° and 85°) and their influence on the amount and composition of fines obtained from laboratory-made CEM I and CEM III concrete. Results show that the 85° jaw angle produced more fines due to stronger size reduction, but these fines presented higher SiO2, indicating increased quartz contamination and reduced selectivity. Conversely, the 90° configuration generated fewer fines, reflected by lower available SiO2 and higher CaO content, suggesting improved preservation of cement paste and reduced aggregate crushing. This result was confirmed through X-ray diffraction analysis, showing lower quartz and higher portlandite peaks for the 90° angle. Overall, the study highlights a clear trade-off: a narrower jaw angle increases yield but decreases selectivity, while the wider angle improves cement paste recovery at the expense of quantity.
1. Introduction
Concrete is the most widely used construction material worldwide and is essential for infrastructure due to its practicality and cost-effectiveness. However, the growing global demand for concrete, and consequently Portland cement, has raised significant concerns regarding natural resource consumption and environmental sustainability. In particular, cement manufacturing alone accounts for up to 8% of global anthropogenic carbon dioxide (CO2) emissions, highlighting the substantial environmental impact associated with its production (Miller, Jiang and Myers, 2022; Snellings et al., 2018). In response, the cement and concrete industries are exploring alternative raw materials and circular strategies to reduce environmental impact. Recycling construction and demolition waste has become a valuable and abundantly recycled materials in the European Union (Cramer, 2023; World Green Building Council, 2019). To address rising sustainability requirements and mitigate carbon dioxide emissions, concrete manufacturing processes must be adapted. In this context, concrete recycling represents a critical pathway towards more sustainable production (Brabandere et al., 2025).
Selective recovery in concrete recycling is a technique to separate the different components of concrete, like aggregates and cement paste. Selective comminution is a commonly used technique to enhance mineral concentration in specific size fractions (Hesse, Popov and Lieberwirth, 2017). Various techniques have been explored to remove adhered cement paste from concrete waste to improve the reuse of fractioned aggregates. Mechanical, thermomechanical and mechanochemical treatments have proven effective, although they are associated with high carbon dioxide emissions (Huang et al., 2025; Shima et al., 2005).
While recycled coarse aggregates are already reused to some extent in new concrete production (Wang et al., 2024), the fine fraction, known as recycled concrete fines (RCFs) – particles smaller than 4 mm – remains significantly underutilised. Cement–aggregate separation is an emerging field of research focused on utilising recycled cement paste (RCP) in high-value applications by leveraging its calcium content (Andre et al., 2017). Improving the composition and morphology of RCP and optimising its replacement level can enhance the performance of new concrete while increasing sustainability. The use of higher-quality RCF may enable Portland cement replacement levels exceeding 10% without significantly compromising mechanical properties.
The main barrier to the use of RCF lies in their inferior physical and chemical properties compared to natural sand, primarily due to high porosity and larger amount of residual hydrated cement paste. These defects lead to poorer workability, increased shrinkage and weaker transport properties in concrete mixtures (Galvín et al., 2014; López-Uceda et al., 2016). As a result, RCFs are often ‘downcycled’ as road base or filler material, rather than reintegrated into structural concrete (Poon et al., 2023). Moreover, current recycling practices primarily focus on crushing waste concrete for coarse aggregate recovery, with limited emphasis on recovering fine cementitious components.
Recent research has attempted to address this by reactivating the hydraulic or pozzolanic potential of RCFs, with studies investigating mechanical, hydrothermal and chemical treatments (Sousa et al., 2024; Teune and Schollbach, 2024; van de Wouw et al., 2019). These processes, however, are often energy- or time-intensive. Therefore, if CaO-high cement fines could be extracted directly during the crushing process, the need for extensive post-processing could be greatly reduced.
One promising solution is the Smart Crusher, a modified jaw crushing technology designed to selectively separate hydrated cement pastes from aggregates by applying a crushing force between the average compressive strengths of the cement paste and aggregates. Compared to conventional jaw crushers, the Smart Crusher has been shown to generate a significantly higher amount of fine cement paste particles (up to 7.5 times more) while minimising damage to aggregates and reducing quartz content (Florea and Brouwers, 2013).
While some studies have examined the effect of the crusher setting parameters, the jaw angle, a key mechanical parameter influencing separation efficiency, remains largely unexplored. Since the mechanical configuration of the crusher strongly affects both the quantity and quality of recovered RCFs, this gap warrants investigation. A steeper jaw angle is expected to promote higher impact energy and enhance the detachment of adhered cement paste, resulting in improved selective liberation.
This study aims to evaluate the effect of the jaw angle configuration in a modified jaw crusher on the recovery of RCFs from laboratory-made CEM I and CEM III concrete. Two jaw angles (90° and 85°) were tested, while other parameters such as jaw distance and crusher speed were kept constant. To assess the performance of each configuration, a comprehensive material characterisation was conducted using sieve analysis, ultrasonic particle size distribution (PSD), thermogravimetric analysis (TGA), X-ray fluorescence (XRF) and X-ray diffraction (XRD).
2. Methodology
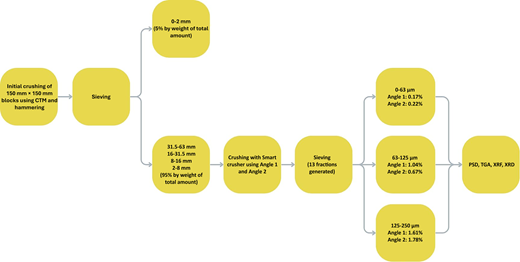
The flowchart in Figure 1 summarises the methodology adopted. Firstly, it shows the process for CEM I concrete blocks.
2.1 Preparation of the samples
Cubic concrete block (150 × 150 × 150 mm³) samples were used with a strength of 38.8 MPa and age of 4 years (made in the laboratory). The original mix of the CEM I concrete was composed of 11.23% of CEM I 52.5 R, 39.48% sand and 49.28% gravel by mass. The CEM III concrete was composed of 13.37% of CEM III/B, 36.45% sand and 50.18% gravel. The aggregates used consisted of quartz-based sand and gravel.
The concrete was prepared with a water-to-cement ratio (w/c) of 0.5. After mixing, the fresh concrete was cast into cubic moulds and covered with a plastic film to prevent moisture loss. The specimens were demoulded after approximately 24 h and subsequently cured in water at 20°C. Compressive strength tests were conducted after 28 days in accordance with EN 12390-3 (CEN, 2009). Following mechanical testing, the material was stored in sealed containers under ambient conditions for approximately four years prior to crushing. Before testing the samples in the smart crusher, specimens that were mechanically fragmented using a splitting tensile test setup. Controlled splitting was performed on a Form + Test Prüfsysteme machine in accordance with EN 12390-6 (CEN, 2023). The fragmentation process was continued until the material reached a particle size below 63 mm. This maximum size was chosen regarding the inlet gap distance of the laboratory smart crusher used for subsequent processing. The primary purpose of this procedure was to obtain suitably sized material for crushing. The fragmentation method and associated parameters were kept consistent and were not considered variables within the scope of this study.
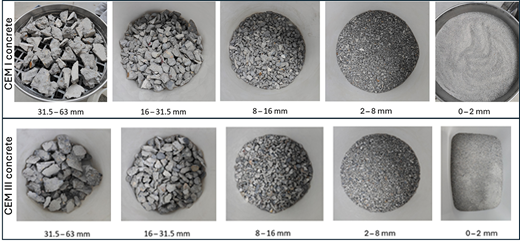
In this research, a packing fraction consisting of particle sizes between 31.5 and 63 mm, 16 and 31.5 mm, 8 and 16 mm, and 2 and 8 mm was used in the smart crusher. The selected size fractions are representative of the fragments generated during the pre-breaking of the concrete blocks prior to crushing. The initial sieving fractions of the CEM I and CEM III concrete samples prior to the crushing process are presented in Figure 2. These size ranges were chosen to reflect realistic feed conditions and to assess the influence of initial particle size on crushing efficiency and selective comminution behaviour. A higher packing fraction helps in retaining the material in the crusher, without which it would all pass directly without getting crushed. All the fractions from 2 to 63 mm were then crushed with two different settings of the moving jaw angle.
2.2 Crushing
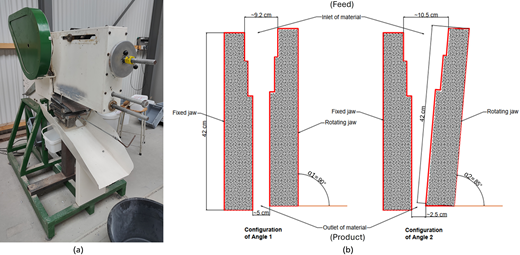
The optimised smart crusher (Figures 3(a)) can change the angle of its jaws. Also, the direction and rotational speed of the jaws can be altered. In combination with these settings, the crushing can be more precise. For this study, speed of the crusher and distance between the two jaws were fixed at 140 rpm and 9.2 cm, respectively. The two angles of the moving jaw selected for the study were α1 = 90°, where the moving jaw was kept perpendicular, and α2 = 85°. In both cases, the fixed jaw was perpendicular to the horizontal. The resulting configuration of both jaw angles can be seen in Figure 3(b). As the angle of the jaw is changed, the inlet and outlet distances also change. In case of α2, the material would stay for longer between the two jaws due to smaller outlet distance. Even though in case of α1 the jaws are parallel to each other, they have different distances at their inlet and outlet. The parameters are described in Table 1. This is due to the protrusions in the surface of the jaws which reduce the distance between the jaws from inlet to outlet. There is also a level difference between the jaws, where the rotating jaw is slightly higher than the fixed jaw. The flow rate of the material crushed with α2 was more than with α1. The observed difference in flow rates (80.5 vs 13 kg/h) is a direct consequence of the variation in crushing jaw angle and distance, which influence material throughput. Therefore, the flow rate was not an independently controlled parameter but rather an inherent outcome of the system configuration. The results should thus be interpreted as reflecting the combined effect of geometric parameters on both flow behaviour and crushing performance.
Sieve analysis: The crushed samples were sieved to determine the PSD.
The sieving process was done according to the European Standard EN 933-1. It was adopted in this study to ensure a consistent and standardised sieving procedure across all samples. For the finer fractions, the sieves were chosen based on ISO 3310, as they provide well-defined and widely accepted mesh sizes suitable for particle size classification. The sieves used were: 63 µm, 125 µm, 250 µm, 355 µm, 500 µm, 1 mm, 2 mm, 4 mm, 5.6 mm, 8 mm, 11.2 mm, 16 mm and 22.4 mm, which generated 13 fractions for each sample. The sieved fractions were weighed and stored in buckets. The last three sample fractions, that is, 0–63, 63–125 and 125–250 µm, were considered as RCFs and chosen for all the further experiments.
Particle size distribution: Fritsch Analysette 22 NeXT ultrasonic machine was used to determine the PSD of the fractions 0–63, 63–125 and 125–250 µm. Isopropanol was used as a dispersion medium since all the samples were cementitious. A total of six samples were tested, three samples for each angle. Based on the ISO standard 13320:2020 (‘ISO, 2020 Particle size analysis – Laser diffraction methods’, 2020), the measurements were quantified using the Mie scattering model.
Milling: The Fritsch Planetary Mill, Pulverisette 5/4 was used to reduce the size of the fraction 125–250 µm before testing for XRD, XRF and TGA. The balls used for milling have a diameter of 10 mm. The milling procedure consisted of 10 min at 260 rpm followed by 10 min at 200 rpm. These parameters were selected based on preliminary trials to ensure sufficient particle size reduction below 100 µm, as required for XRF sample preparation, while avoiding excessive overgrinding and alteration of the material.
Thermogravimetric Analysis: TGA/Differential thermogravimetric analysis (DTG) was performed on the samples using a TG 209 F3 Tarsus (Netzsch) with a heating of 25°C/min under an N2 environment up to 1000°C. TGA was performed on three fractions of each angle.
X-ray fluorescence:XRF was used to identify the oxide concentration of elements in the sample. PANalytical Epsilon 3XLE X-Ray Spectrometer was used. The samples for XRF were prepared using the pressed powder method, in which 20% by weight of wax (EBS) was added to the powdered samples. It is acknowledged that the presence of an organic binder may influence the detection of light elements due to dilution and matrix effects. However, as the primary objective of this study is to evaluate trends in major components (CaO and SiO2), which are less sensitive to such effects, the influence of the binder is considered negligible for comparative analysis.
This powder was thoroughly mixed and vibrated on the Fisher Scientific TopMix FB 15024 for 1 min to get a homogenous mixture. It was then pressed in a Maassen Pellet Press MP250D, which is a manual hydraulic press.
Due to limited material availability, XRF measurements were conducted on a single representative sample for each condition. Prior to analysis, the samples were thoroughly homogenised to ensure representativeness of the bulk material. While this limits the ability to assess variability, the results provide indicative trends in composition.
X-ray diffraction:XRD was carried to determine the crystalline phases of the samples (Stanić, 2022). The machine used for this analysis was the Bruker-AXS D2 Phaser. First, 4 ml of sample was measured and weighed. For quantitative XRD analysis, 10 wt% silicon powder was added to each sample as an internal standard. The sample and silicon powder were homogenised using an XRD mill, with small milling balls added to the milling cup to enhance mixing efficiency. Milling was performed for 5 min at a rotational speed of three units (instrument setting), ensuring a uniform distribution of the internal standard within the sample. This procedure was applied consistently to all samples. After milling, the mixed sample was then put into the specimen holder for the XRD machine. The 2θ angle was set from 5° to 90°. The step size was set to 0.02°. The XRD machine provided results in the form of a graph with peaks over the 2θ angles. The patterns were identified using Bruker software plus EVA and quantified via Bruker software Topas (Coelho, 2018) using the Rietveld method (Gualtieri, 2000). For the quantification of the minerals, the TOPAS 5 software from Bruker was used on the smallest fraction (0–63 µm) for each angle. Statistical criteria Rwp (R – weighted-profile) and GOF (goodness-of-fit) (Post and Bish, 1989; Toby, 2006) used to verify the quality of the of the XRD refinement measurements are listed in Table S1 (Appendix A). According to these statistical indicators, the refinement is optimised when the GOF values are below 5.
3. Results
3.1 Sieve analysis particle size distribution
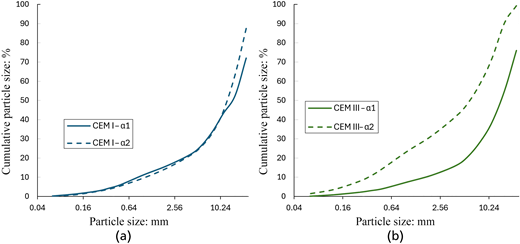
The PSD of the output material for each angle (α1 = 90° and α2 = 85°) after smart crushing is shown in Figure 4. For the CEM I concrete (Figure 4(a)), the amount of the highest fraction (>22.4 mm) has reduced when crushing with α2. For α1, this fraction is approximately 28% of the total crushed material, whereas, for α2 it is 12.6%. A smaller nip angle (steeper angle between the jaws) can improve the crushing efficiency by increasing the shear force applied to the material. In this research, the steeper angle between the jaws also helped the material to stay in the crusher chamber for a longer time than for α1. Similarly, the amount of the smallest fraction size (0–63 µm) has increased for α2. For α1, out of the total crushed material this fraction was 0.17%, whereas for α2 it was 0.22%. It indicates an increase of 30% in the quantity of fines generated. After crushing the CEM III concrete (Figure 4(b)), α2 clearly shows a higher cumulative percentage passing at all particle sizes. For α2, only 0.72% of the material was retained on the 22.4 mm sieve size, whereas for α1 it was 24%, showing a 97% reduction in large size particles. As for the smallest fraction (0–63 µm), it has increased from 0.13% for α1 to 1.46% for α2. Other fine fractions such as 63–125 and 125–250 µm have also increased by approximately 184% and 234% when crushed with α2. The gap between the curves for both the angles is clearly visible for CEM III than CEM I.
During the smart crushing process, especially with α2, some of the aggregates were further broken. The process can clean the aggregates, but cannot avoid some breakage of aggregates, which contribute to the quartz content in the cement fines.
3.2 Chemical composition
To analyse the performance of both angles, it is important to analyse how much CaO and SiO2 content was present in the crushed samples. The chemical composition of the fractions 0–63, 63–125 and 125–250 µm were analysed for both angles (Table 2). A higher content of CaO in the fines represents that the crusher was effective in separating the cement from the aggregates. The oxide composition is primarily dominated by SiO2 and CaO, which are the main contributors to cementitious behaviour. However, minor oxides such as Al2O3 and Fe2O3 are also present and can influence hydration processes through the formation of aluminate and ferrite phases. These phases may affect early-age reactions and microstructural development, although their impact is considered secondary in the present study due to their relatively low concentrations.
For fraction 0–63 µm in CEM I concrete the SiO2 content has increased from 29.6% in α1 to 31.1% in α2 as seen from Figure 4, which is an increase of 5%. For 63–125 and 125–250 µm fraction sizes, the SiO2 content remains the same. On the other hand, the CaO content in the 0–63 µm fraction is also higher in the sample crushed with α1 compared to α2, showing a decrease of 5.7%. For both types of concrete, SiO2 content is the highest in 125–250 µm fraction and CaO is the lowest. This is because cement fines usually have a particle size of 63 µm, hence as the particle size increases, CaO content reduces. For CEM III concrete, the silica content has increased in all the three fractions for α2. There is an increase of approximately 15% across all the three fractions which is quite significant. This implies that even though the quantity of fines increased with α2, the quality deteriorated, since a high CaO content is expected for future use of RCF. A higher silica content indicates that aggregates got crushed which is undesirable. For CEM III samples there is a considerable decrease in the CaO content across the fractions of 6.5%, 22.2% and 11.5% after adjusting angle from α1 to α2.
3.3 Mineralogy
Further analysis was carried out by powder quantitative X-ray diffraction of the fraction 0–63 µm samples for each angle (Table 3). The mineral phases belonging to natural aggregates identified are quartz (low), anorthoclase, albite, serpentine and phlogopite. The phases larnite (β-C2S), portlandite (Ca(OH)2) and ettringite are from cement clinker and hydration products. The quartz content is higher in α1 than in α2 by 1% which is very insignificant. However, calcite is present in greater quantities in α2 which is an increase of 43% from α1. Portlandite, on the other hand, is higher in α1. Amorphous content that could come from phases such as C-S-H which are not crystalline is higher in α1. Due to their amorphous nature, XRD cannot identify them, hence they are analysed with DTG. CEM III fines exhibit different behaviour than CEM I. The quartz content is higher in α2 by 27%. Calcite, unlike CEM I, is present in higher quantities in α1 by 13%. The Portlandite content in CEM III is much lower than in CEM I due to addition of ground granulated blast furnace slag (GGBFS). For both angles the Portlandite content is almost equal. Albite is higher in CEM III samples than CEM I. The higher quartz content observed in the α2 fraction for CEM III is unlikely to be due to intrinsic differences in quartz content between cement types. Instead, it may result from differences in matrix composition and phase liberation during crushing, as the slag-rich binder can influence fragmentation behaviour and the distribution of harder phases such as quartz. Angle α1 produced RCFs richer in CaO, but α2 can generate higher number of fine fractions. The reduced distance between the jaws at the outlet for α2 retained the material for a longer duration but also led to the crushing of the aggregates.
3.4 Thermogravimetric analysis
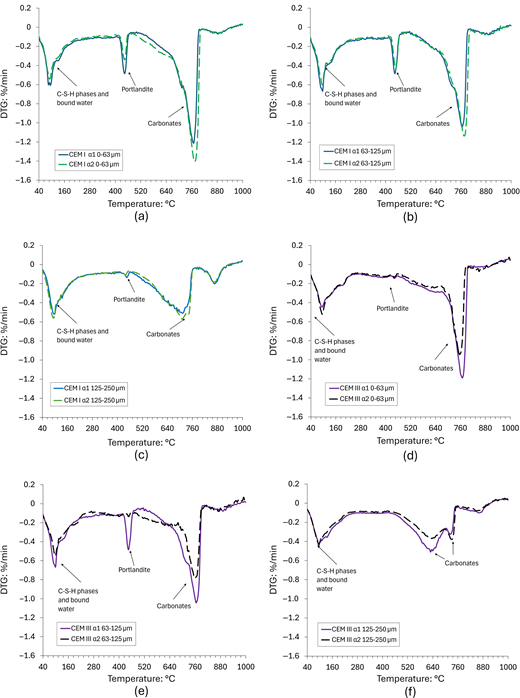
DTG analysis was used for the comparison among the RCFs using the two different angles. From Figure 5, it can be observed that peaks around 100°C indicate the loss of free and physically bonded water/volatiles and the dehydration of C-S-H phases. The peak between 400°C and 500°C indicates the decomposition of Portlandite (Ca(OH)2). The peak at around 800°C represents the decomposition of calcite (CaCO3) (Sousa et al., 2024), due to the decomposition of polymorphs of calcium carbonate such as vaterite and aragonite. These polymorphs are formed from the carbonation of hydration products such as C-S-H and ettringite and transform into secondary calcite during the heating process. The transformed CaCO3 decomposes at a lower temperature due to its less ordered crystalline structure and high degree of dispersity (Cheng et al., 2024).
In CEM I concrete, for the 0–63 µm fraction, α1 has higher loss of water and more decomposition of C-S-H phases and Portlandite than α2. However, calcite is present in higher quantities in the sample crushed with α2. A similar trend is observed in the fraction size of 63–125 µm as well. Portlandite and initial peaks in the 40–180°C range are higher for α1 and the peak for carbonates is greater for α2. These results agree with the XRD analysis where calcite is present in higher quantity in α2, whereas Portlandite and ettringite are higher in α1. For fraction sizes of 125–250 µm, the C-S-H phases of α2 are higher than α1. Portlandite remains higher in α1 as in the case of the previous two fractions. Carbonate phase is present in greater quantity in α2 than in α1 (Lothenbach et al., 2016).
For CEM III concrete, the Portlandite peaks are much smaller and less pronounced than for CEM I due to addition of GGBFS. For the fraction size 0–63 µm, α1 has had a greater mass loss of C-S-H phases and carbonates than α2 and Portlandite is similar in both angles. A similar trend is observed in case of 63–125 µm for Portlandite as well. Carbonate mass loss is higher for α1 than for α2 as observed for the previous fraction. Mass loss in the initial temperatures of around 100°C of C-S-H phases is similar for both the angles. This is observed for the fraction size of 125–250 µm as well. However, for this fraction, the Portlandite loss is slightly higher for α1, whereas the calcite loss is higher for α2.
4. Conclusions
In this research, the performance of the jaw angle of the smart crusher was evaluated by studying two different angles: α1 = 90° and α2 = 85° to crush four-year-old concrete made in the laboratory with CEM I 42.5-R and CEM III/B focusing on the influence of the angle on the recycled fines:
From sieve analysis, it was found that α2 (85°) generated higher quantity of fines than α1 (90°). The highest fraction (>22.4 mm) reduced from 28% for α1 to 12.6% for α2 and the smallest fraction (0–63 µm) increased from 0.17% for α1 to 0.22% for α2. Similarly, for CEM III, the highest fraction reduced by 97% for α2 and the smallest fraction increased 0.13% for α1 to 1.46% for α2.
Thermogravimetric analysis showed that for the fraction 0–63 and 63–125 µm, the α1 sample had a higher quantity of C-S-H phases and Portlandite as compared to α2. In both fraction sizes, carbonate was present in higher quantity in α2. For the third fraction of 125–250 µm, α1 had higher Portlandite and α2 contained a greater amount of C-S-H and calcite. For CEM III concrete, the fraction size of 0–63 µm, α1 contained a greater quantity of CSH and calcite. Portlandite was equal for both the angles. For the 63–125 µm fraction size, Portlandite and C-S-H were present in equal amounts for both angles and carbonate was higher for α1. In the next fraction, Portlandite loss was higher in α1, whereas calcite loss was higher for α2 and mass loss of C-S-H was equal.
The XRF results for CEM I and CEM III concrete show that α1 clearly produced lower quartz-content fines even though fewer were generated. There was a 5% increase in SiO2 content and a 5.7% decrease in CaO content in CEM I fraction size 0–63 µm, from α1 to α2. Both SiO2 and CaO are present in equal quantities in the other two fractions. In the case of CEM III concrete, the silica content increased by 15% across all fractions, whereas the CaO content decreased by 6.5%, 22.2% and 11.5%, respectively.
Regarding the mineral phases, calcite content increased by 43% when comparing α1 to α2. Portlandite and amorphous content was higher for α1. For CEM III, quartz was higher for α2 by 27%, and calcite was higher in α1 by 13%, whereas Portlandite was equal for both. These results are in line with the DTG findings. Overall, it can be concluded that α1 produced RCFs richer in CaO, but α2 can generate a higher number of fine fractions. The reduced distance between the jaws at the outlet for α2 retained the material for a longer duration but also led to the crushing of the aggregates. The choice of the angle depends on the purpose of the crushing (i.e. if the purpose is acquiring a higher quality of RCFs to use the crushed concrete as a binder) since α1 would be beneficial since it produces fines with less SiO2. These fines can then be post treated to be used in fresh concrete. On the other hand, to acquire cleaner recycled concrete aggregates to be used as sand and gravels, then α2 would prove to be useful, since it would not matter if the fines contained CaO or SiO2.
For further research, increasing the quantity of fines with α1 could involve multiple passes of the material through the crusher. To prevent aggregate crushing, only materials above a specific sieve size should be processed. Moreover, scaling this approach to an industrial level pose challenges. As it involves an extra step of sieving and then reintroducing the material into the crusher, it becomes time consuming. This process also increases the crusher time and requires extra equipment, which makes it more expensive. Additional research could also focus on evaluating the performance of angles of the rotating jaw, as this study was limited to examining only two angles.