

This study investigated the impacts of the environment, social and governance (ESG) and its components on global bank profitability considering the COVID-19 outbreak.
This study used a system generalized method of moments (GMM) proposed by Arellano and Bover (1995) to investigate the relationship between ESG and bank profitability using an unbalanced sample of 487 banks from 51 countries from 2006 to 2021.
The findings generally found that ESG activities may reduce bank profitability, thus supporting the trade-off hypothesis that adopting ESG standards could increase bank costs while lowering profitability. In addition, there is a U-shaped relationship between ESG and bank profitability, suggesting that ESG activities can help improve bank performance in the long term. Such an effect is the first time observed in the global banking sector. This study’s results are robust across different models and settings (e.g., developed vs. developing countries, different levels of profitability, and samples with vs without US banks).
This study provides empirical evidence to support many countries' sustainable development policies. It also provides empirical incentives for bank managers to be more ESG-oriented.
This study provides a better understanding of the roles of ESG activity and its components in the global banking system, considering the recent crises.
1. Introduction
Sustainability development has attracted much attention from practitioners, investors and policymakers. According to the report of CFA Institute (2019), more than 2,300 investment firms with total assets of $US 86 trillion committed to disclosing environment, social and governance (ESG) integrated into their investment decisions, supporting the call from the United Nations (2018). Once the global economy is increasingly interconnected, the concerns about what needs to be disclosed to domestic and international stakeholders and authorities worldwide become critical. Wulf et al. (2014) alerted that financial accounting is insufficient to satisfy the needs of shareholders and suggested further reports such as sustainability reports (e.g., ESG disclosure) and value reporting. If shareholder maximization is considered the objective of the firm, increasing engagement in ESG activities should improve shareholder value (Azmi et al., 2021). Indeed, the resource-based theory proposes that firms may achieve superior performance if they reveal more information about their financial and non-financial resources. These resources assist firms in strengthening their competencies and capabilities, which are crucial for accomplishing sustainable competitive advantage (Gaur et al., 2011).
However, the empirical evidence on the effect of ESG is mixed. The positive relationship between ESG activities and bank performance is documented by several studies such as Wu and Shen (2013), Shen et al. (2016) and Buallay (2019). The positive effect of ESG activities only holds up to the certain level of ESG investments (Azmi et al., 2021; El Khoury et al., 2021). Others show no relationship between ESG activities and bank performance (Soana, 2011).
Furthermore, the lessons from the global financial crisis of 2008 and the LIBOR scandal demonstrated the importance of understanding how ESG activities impact bank value (Hurley et al., 2014). Additionally, disrupted commodities and uncertainty created by the COVID-19 pandemic have challenged the global banking system more toward their ESG activities (El Khoury et al., 2021). Notably, the Sustainable Markets Initiative’s Financial Service Taskforce formed by the Prince of Wales and 40 global banks aims to understand the relationship between the banking industry and global sustainability efforts [1]. Additionally, Net-Zero Banking Alliance was also established by banks worldwide that forces bank members to align their financing and investment strategies using existing and new technologies and policies with net-zero emissions by 2030 [2]. All in all, there is evidence that ESG (and its pillars) can influence bank profitability, and that the recent COVID-19 pandemic may affect such a relationship; however, this issue has not been examined. It motivated us to revisit the impact of ESG activities and its components on bank profitability, especially at a global scale, considering the COVID-19 outbreak.
Our findings show the negative impact of ESG activities on bank profitability. The U-shaped relationship between ESG activities and bank profitability is also found. The same results are still obtained when observing ESG components. More importantly, our findings suggest that ESG activities are more likely to alleviate the negative impact of the COVID-19 pandemic on bank profitability. To be specific, our findings also document that environment and social pillars play critical roles in explaining the relationship between the COVID-19 turmoil and bank profitability. The same results still hold when several robustness checks are performed.
This paper contributes to the literature in several ways. First, limited studies on ESG in the context of COVID-19 were primarily conducted in developed countries (Koutoupis et al., 2021). We further examine the relationship between ESG activities and bank profitability during the COVID-19 pandemic using banks in both developed and developing countries because banks engaged in the level of ESG activities may differ among these two groups. In contrast to Danisman (2022), who examined the impact of ESG activities on bank stock return in European countries, we investigate this correlation in the global context by using both financial measures (return on assets and returns on equity) and a market measure (Tobin’s Q) as a robustness check. Second, we investigate whether ESG pillars contribute to mitigating the negative impact of the COVID-19 pandemic on bank profitability. Therefore, this would provide important implications for bank managers and policymakers in promoting ESG activities in the banking system. Last, using a longer period allows us to study further the critical role of ESG activities in explaining bank profitability during the past crises, including the global financial crisis 2008 and the health crisis. To the best of our knowledge, this is the first attempt to do so. Nonetheless, our findings will add more evidence of ESG activities in two recent crises to the existing literature on the banking system.
2. Literature review
2.1 ESG activities and bank performance
Environmental, social, and governance are abbreviated as ESG (Bătae et al., 2021). First and foremost, the environmental obligations of a bank can be examined from three angles: internal resource efficiency, financing environmentally conscious industrial ventures and reducing the risk of providing funds to dirty businesses (Horváthová, 2010; Jacobs et al., 2010; Gangi et al., 2019). Meanwhile, financial inclusion for broader segments of society, financing of non-governmental organizations, ethical investment funds, risk expertise for clients, cost-effective e-payments and financial education for the general public are referred to all examples of a bank’s social responsibility (Esteban-Sanchez et al., 2017; Galant and Cadez, 2017; Siueia et al., 2019). Lastly, governance excellence is influenced by board size, director competence, directors’ knowledge and independence, cultural diversity and gender equality within the board, chief executive officer (CEO)–chairman duality, executive remuneration, and risk governance. In the global economy, a bank must disseminate its sustainability goals via ESG to its customers and business partners to gain customer confidence, solid reputation and profitability (Esteban-Sanchez et al., 2017; Gangi et al., 2019). Accordingly, the best ideal situation is when the bank would adopt the highest quality corporate governance requirements while reducing environmental consequences and participating in social responsibility activities.
Conflicting stakeholder and management interests, on the other hand, may jeopardize the improvement of ESG policies and bank performance. For instance, profitability pursuit in riskier investments may prevent banks from fulfilling the adoption of better ESG policies. This argument leads to a growing interest in assessing the relationship between ESG performance and financial performance in the banking sector globally (Friede et al., 2015; Buallay, 2020; Azmi et al., 2021; El Khoury et al., 2021). However, these results are mixed and inconclusive due to omitted variable bias, small sample size and inconsistent primary variable measurement (Horváthová, 2010).
On the one hand, Friede et al. (2015) complied with more than 2,000 pieces of research that looked at the association between ESG factors and the financial performance of firms. The findings revealed that over 90% of studies demonstrated a favourable link between environmental, social, and governance criteria and business successes. In the light of the recent financial crisis, Cornett et al. (2016) claimed that the financial success of US banks from 2003 to 2013 is favourably and strongly related to ESG scores implying that banks are rewarded for being socially responsible in general. Bischof et al. (2021) explained that incorporating ESG into a business model enables banks to better understand and engage with clients on their climate risks and sustainable transformations, hence securing client relationships. As a result, especially during the health crisis, this has become a competitive advantage and a source of new revenue streams. All lends credence to the idea that ESG has a positive impact on financial performance, even in the non-financial sector (Wang et al., 2015; Broadstock et al., 2021; El Khoury et al., 2021; Yoo et al., 2021; Lööf et al., 2022; Zhang et al., 2022).
On the other hand, Galant and Cadez (2017) argued that the adoption of ESG standards forces banks to spend more money to meet social and environmental goals (i.e., investing in lower-emission projects or pollution reduction, raising employee wages and bonuses, and participating in community activities such as donations and sponsorship), resulting in higher costs and lower profitability. Further, Di Tommaso and Thornton (2020), using European banks, concluded that high ESG scores are linked to a moderate reduction in risk-taking for both high and low risk-takers and that the impact is dependent on executive board characteristics. The findings agree with various theories, including the stakeholder view, the shared value, the legitimacy theory and the resource-based view on ESG initiatives. Nonetheless, ESG scores also drop bank value, which is consistent with the overinvestment hypothesis of ESG, in which scarce resources are diverted from investment as presented in trade-off theory.
Considering the above observations, we take a step forward in unravelling such complicated linkages by examining whether ESG scores impact the financial performance of the banking sector. Further, there is a need for a comprehensive global examination in the same period. Thus, the first hypothesis is as follows.
There is no relationship between ESG activities and bank performance.
Interestingly, Nollet et al. (2016), as one of the pioneers, found a non-linear relationship between corporate social responsibility (CSR) and financial performance when examining S&P500 firms in the period 2007–2011. While the linear model suggested that CSR and return on capital have a substantial negative connection, the non-linear model showed a U-shaped relationship and implied a positive effect in the long run. Contrarily, Azmi et al. (2021), studying 44 emerging economies over the next period from 2011 to 2017, found that low levels of ESG have a beneficial influence on bank value; however, this is a diseconomy of scale phenomenon. Then, further analysis of the study indicated that ESG activity has a positive link with both cash flows and efficiency, negatively affects the cost of equity, but has no effect on the cost of debt. Again, the results support both stakeholder theory and trade-off theory. Similarly, El Khoury et al. (2021) supported the existence of a non-linear ESG–financial performance relationship, in which ESG incremental investments are advantageous until they reach a tipping point. Therefore, our second hypothesis is:
There is no non-linear relationship between ESG activities and bank performance.
2.2 ESG and bank performance under COVID-19
The impacts of the COVID-19 pandemic have been examined in the banking (Wang et al., 2021; Borri and Giorgio, 2022; Boubaker et al., 2022; Le et al., 2022a) as well as in the non-bank sector (Narayan, 2020; Haroon et al., 2021). Studies on the ESG–performance relationship under COVID-19, however, are still limited. Tampakoudis et al. (2021), throughout the sample period from 2018 to 2020 of US firms, found a considerable negative effect of ESG on firm performance. However, under the COVID-19 pandemic, this adverse impact may appear to be stronger, implying that the costs of pursuing sustainability initiatives surpass any potential returns during pandemic-induced economic instability, supporting the overinvestment hypothesis. However, El Khoury et al. (2021), using the cross-sectional data of G20 countries in 2020, showed that ESG is advantageous during the COVID-19 outbreak though the benefit appears to be linked to certain features of ESG, income level and firm-specific characteristics. The benefit of ESG during the COVID-19 outbreak is also found by Broadstock et al. (2021).
Regarding the impact of ESG on the banking system, Danisman (2022) revealed that ESG scores had a beneficial effect on bank stock returns in the initial wave (from February to April 2020), but the impact faded in the second wave (February to April 2021). Likewise, the responses of the S&P 1500 stocks to fiscal and monetary policy are found to differ according to E, S and G scores by kind of legislation. During the pandemic, non-financial firms that managed environmental and governance risks fared better. The reason was partly due to their excellent environmental and governance rankings, which allowed them to mitigate the negative consequences of fiscal policy announcements during the pandemic.
The controversial relationships between ESG scores and financial performance during the COVID-19 pandemic motivate us to explore this study further. As a result, our third hypothesis is:
ESG activities are likely to alleviate the adverse effects of the COVID-19 pandemic on bank performance.
3. Methodology and data
3.1 Methodology
Following Azmi et al. (2021) and Le et al. (2022a), the system generalized method of moments (GMM) is used in this study to provide consistent and efficient estimates of parameters. García-Herrero et al. (2009) demonstrated that system GMM could address the endogeneity issues caused by omitted variables and unobserved heterogeneity and account for the profitability persistence. Azmi et al. (2021) further argued that the dynamic modeling of system GMM could account for any unobserved factors or effects via the lagged variables and thus, it is more efficient than other methods such as the fixed-effects modeling (FEM), the random-effects modeling (REM) or the least squares dummy variable corrected (LSDVC).
Several studies have argued the non-linear relationship between ESG activities and bank performance (Nollet et al., 2016; Azmi et al., 2021), our general model is formed as follows:
where bank profitability () is measured by the pre-tax return on assets () to mitigate the issue of tax incentives across countries. We also use pre-tax return on equity () and a market measure Tobin’s Q (as the sum of the total market value of equity and total book value of liabilities over total assets) for our robustness checks (El Khoury et al., 2021).
In Equation (1), is the environmental, social and governance score, while is the squared term of ESG score to account for non-linear relationship between ESG activities and bank profitability. ESG components include the environment pillar score (), the social pillar score () and the governance score (). is calculated based on three dimensions, including resource use, emissions and waste reduction and environmental innovation. is estimated based on four aspects of human rights, workforce, productivity responsibility and community. Meanwhile, is based on three dimensions: CSR strategy, shareholder rights, and management and oversight. ESG and its pillars range between 0 and 100. We include ESG and its components in a separate model to avoid multicollinearity.
is a vector of bank control variables, including lending specialization (, the ratio of loans to total assets), banking intermediation (, the ratio of total deposits to total loans), credit risk (, the ratio of non-performing loans to total loans), capitalization (, the ratio of total equity to total assets), bank size (, the natural logarithm of total assets).
For macroeconomic variables, , our study attempts to investigate the impact of ESG activities on bank profitability during the COVID-19 pandemic. However, most of macroeconomic variables are unavailable. For example, the data on GDP and inflation was only available until the year 2020. Therefore, we will run equation (1) using two different sets of macroeconomic variables. The first set includes banking openness ( the openness index of the banking system), the economic growth ( the annual growth rate of the economy) and the inflation ( the annual inflation rate). The second set consists of banking openness and crises such as the COVID-19 pandemic ( a dummy variable that equals 1 for a period of the COVID-19 outbreak 2020–2021 and 0 otherwise) [3] and the global financial crisis (GFC, a dummy variable that equals 1 for the GFC period 2007–09 and 0 otherwise) [4]. It is worth noting that banks have recently focused on ESG activities, especially those in emerging markets. Therefore, few studies in this field used a sample after the global financial crisis. For example, Azmi et al. (2021) used a sample of 44 emerging banks from 2011 to 2017. El Khoury et al. (2021) employed a sample of 46 listed banks in MENA between 2007 and 2019, but the impact of GFC is not considered, perhaps because of a small sample size and substantial missing data on ESG score on banks. In the same vein, Cornett et al. (2016) also examined the effect of ESG on bank performance in the US in pre-crisis and post-crisis periods. Again, the present study primarily focuses on the impact of the COVID-19 pandemic on bank performance. Nonetheless, we include both crises in the same model for robustness checks.
For examples of potential endogeneity problems, large banks are more flexible in taking more high-risk investments (e.g. loans and advances) and lower their capital ratios, thus may increase bank profitability. However, Le (2020) demonstrated the bi-directional relationship among bank risk, profitability and loan growth. In addition, one may also argue that banks engaging more in ESG activities may generate higher/lower profits (Buallay et al., 2021). This effect may go the opposite direction, for example, where more profitable and larger banks are willing to adopt ESG requirements (Friede et al., 2015).
We also perform the heteroscedasticity test if endogeneity issues between one or more regressors may exist. The results of Breusch–Pagan/Cook–Weisberg heteroskedasticity test indicate the low p-values of both models controlling for two different sets of macroeconomic variables [5]. This implies that the null hypothesis of homoscedasticity is rejected; thus, the system GMM is an appropriate method for our study.
3.2 Data
We first collected data from the Thomson Reuter Eikon database for all commercial banks in 63 countries with ESG and financial information. We then filtered for banks that have at least four consecutive years covering the COVID-19 pandemic period (i.e., two years 2020–2021, and at least another two years before that period) to remain in our sample, since our key point is about the ESG–profitability relationship under COVID-19. Data on macroeconomic variables were extracted from the World Bank database, while data on banking openness were gathered from the Heritage Foundation database. After matching these databases, an unbalanced sample of 487 banks from 51 countries for the 2006–2021 period was obtained (please see also Appendix 1). As presented in Table 1, one can see that the average bank in our sample was not very profitable (with the average ROA and ROE values of 1.293 and 13.486, respectively) – that may be due to the negative effects of the GFC and COVID-19. On the other hand, their ESG was at a satisfactory level of around 40–50 scores (Thomson Reuters Eikon, 2022), but there is room for improvement. The other bank-level characteristics (e.g., NPL or CAP) are also moderate, while the country-level environment is stable (e.g., GDP and INF are average, following each other at around 1.7–1.8%). The high (average) value of OPEN at 67.546 suggests that most banks operate in a free and open environment which chained them together, thus, making the impacts of global events such as the GFC or COVID-19 stronger for the examined banks.
Descriptive statistics of variables and their definitions
| Variable | Definition | Mean | STD | Min | Max |
|---|---|---|---|---|---|
| ROA | Pre-tax return on assets | 1.293 | 0.838 | −1.527 | 4.153 |
| ROE | Pre-tax return on equity | 13.486 | 7.965 | −21.738 | 34.936 |
| ESG | ESG combined score | 44.337 | 20.608 | 1.922 | 94.500 |
| E | The environmental pillar score | 44.321 | 28.909 | 0.081 | 97.538 |
| S | The social pillar score | 43.399 | 23.670 | 0.959 | 97.110 |
| G | The governance pillar score | 52.817 | 22.049 | 1.884 | 99.376 |
| LA | The ratio of total loans to total assets | 62.600 | 13.903 | 21.679 | 89.123 |
| DEPO | The ratio of total deposits to total loans | 121.839 | 33.361 | 52.303 | 278.521 |
| NPL | The ratio of non-performing loans to total loans | 2.798 | 4.764 | 0.060 | 39.127 |
| CAP | The ratio of total equity to total assets | 9.621 | 3.436 | 3.342 | 20.100 |
| LNTA | The natural logarithm of total assets | 25.844 | 3.136 | 20.757 | 33.725 |
| OPEN | The banking freedom index | 67.546 | 15.494 | 20.000 | 90.000 |
| GDP | The growth rate of GDP | 1.711 | 3.317 | −11.149 | 25.176 |
| INF | The inflation rate | 1.791 | 3.438 | −25.958 | 32.053 |
Note(s): Our bank-specific variables are winsorized at 1st and 99th percentiles to eliminate outliers
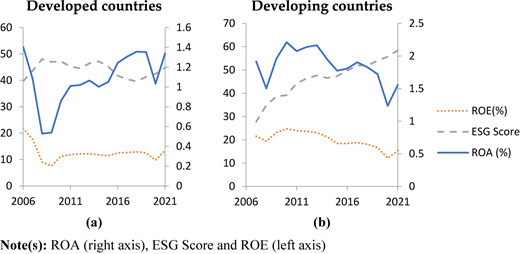
Figure 1 further shows the relatively opposite trend in ESG activities. There was a steadily increasing trend in ESG engagement of banks in developing countries, where there was a slight fluctuation in developed countries before starting to increase again in 2021. Also, there was a reduction in bank profitability in 2020 because of the COVID-19 pandemic. It is understandable that the governments worldwide implemented the social distancing policy and lockdown measures. This thus will affect households’ income and firms’ revenue, thus impacting their ability to pay their debts (Elnahass et al., 2021; Boubaker et al., 2022; Le et al., 2022a). However, the profitability of the global banking system increased in 2021, which signalled a recovery phase. Because the implementation of stricter policies measures such as social distancing and lockdown was perceived as ineffective and costly in the long run, policymakers worldwide have gradually removed it and started to reactivate economic activities under new normal.
4. Empirical findings
4.1 Our baseline models
Table 2 indicates that ROA is negatively associated with ESG and its components. Also, there are no high correlations among independent variables. As argued above, the system GMM is recommended to overcome the endogeneity issues.
Correlation matrix
| ROA | |||||||||||||
| 0.805 | ROE | ||||||||||||
| −0.108 | 0.061 | ESG | |||||||||||
| −0.198 | 0.049 | 0.790 | E | ||||||||||
| −0.087 | 0.060 | 0.925 | 0.638 | S | |||||||||
| −0.031 | 0.066 | 0.761 | 0.432 | 0.486 | G | ||||||||
| 0.057 | −0.058 | −0.282 | −0.379 | −0.234 | −0.184 | LA | |||||||
| 0.032 | 0.076 | −0.086 | −0.026 | −0.123 | −0.021 | −0.689 | DEPO | ||||||
| −0.144 | −0.207 | 0.103 | 0.162 | 0.127 | −0.003 | −0.047 | 0.047 | NPL | |||||
| 0.511 | 0.003 | −0.300 | −0.455 | −0.245 | −0.172 | 0.255 | −0.108 | 0.031 | CAP | ||||
| −0.088 | 0.106 | 0.411 | 0.580 | 0.361 | 0.237 | −0.378 | 0.123 | 0.031 | −0.424 | LNTA | |||
| −0.057 | −0.126 | 0.043 | −0.142 | 0.066 | 0.053 | 0.251 | −0.294 | −0.160 | 0.120 | −0.513 | OPEN | ||
| 0.236 | 0.324 | −0.026 | 0.058 | −0.028 | −0.010 | −0.042 | 0.063 | −0.034 | −0.023 | 0.118 | −0.284 | GDP | |
| 0.206 | 0.217 | 0.080 | 0.067 | 0.126 | −0.010 | −0.049 | 0.006 | 0.060 | 0.029 | 0.022 | −0.041 | 0.194 | INF |
Note(s): ROA, pre-tax return on assets; ROE, pre-tax return on assets; ROE, pre-tax return on equity; ESG, the ESG combined score; E, the environmental pillar score; S, the social pillar score; G, the governance pillar score; LA, the ratio of total loans to total assets; DEPO, the ratio of total deposits to total loans; NPL, the ratio of non-performing loans to total loans; CAP, the ratio of total equity to total assets; LNTA, the natural logarithm of total assets; OPEN, the banking freedom index; GDP, the growth rate of GDP; INF, the inflation rate
Before interpreting our main interest variable, we need to look at the results of several tests to check the validity of our dynamic panel model. The insignificant p-values of the Hansen test indicates that overidentifying restrictions are not detected [6]. In other words, all moment conditions are met, and the instruments should be accepted. Although the hypothesis of the first-order autocorrelation (AR1) is rejected, the insignificant p-values of AR2 still demonstrate the satisfaction of the moment conditions of our model [7]. These findings confirm that our diagnostic tests are met.
As can be seen in Table 3, the negative coefficients on in all models imply that ESG activities may reduce bank profitability, thus supporting the trade-off hypothesis. The adoption of ESG standards requires banks to spend additional resources to achieve social and environmental targets (e.g., investment in fewer emission projects or pollution reduction, increasing staff wages and bonuses, engagement in community activities including donations and sponsorship), thus suffering higher costs, lowering profitability (Galant and Cadez, 2017). Nonetheless, this finding is in line with Di Tommaso and Thornton (2020), who demonstrated that ESG activities tend to reduce bank value in Europe or other studies in non-financial firms such as Tampakoudis et al. (2021). Furthermore, the positive coefficients on in all models suggest the existence of U-shaped relationship between ESG and bank profitability. Our findings argue that ESG activities may reduce bank performance in the early phase because costs of adopting ESG framework may outweigh benefits, whereas this impact of ESG becomes positive at a later phase. Nonetheless, this finding somewhat supports the early suggestion in other sectors of Han et al. (2016) in Korea and Nollet et al. (2016) in the US. The results of and still hold regardless of considering different macroeconomic factors [8].
The results of our baseline model
| Profitt | ROA | ROE | ||||
|---|---|---|---|---|---|---|
| Profitt−1 | 0.148*** (0.041) | 0.368*** (0.11) | 0.335*** (0.112) | 0.445*** (0.032) | 0.279** (0.142) | 0.342*** (0.077) |
| ESG | −0.028*** (0.008) | −0.049*** (0.019) | −0.05*** (0.017) | −0.237*** (0.07) | −0.562* (0.31) | −0.424*** (0.149) |
| SQESG | 0.0001** (0.0001) | 0.0005** (0.0002) | 0.0005** (0.0002) | 0.001** (0.0006) | 0.006** (0.003) | 0.003** (0.002) |
| LA | 0.017** (0.007) | 0.0001 (0.016) | 0.0006 (0.016) | 0.04 (0.056) | 0.21 (0.167) | −0.166 (0.13) |
| DEPO | −0.003 (0.002) | 0.008 (0.006) | 0.009* (0.005) | −0.01 (0.02) | 0.088 (0.097) | 0.056 (0.049) |
| NPL | −0.006 (0.007) | −0.026 (0.023) | −0.024 (0.022) | −0.185*** (0.056) | −0.432 (0.278) | −0.094 (0.184) |
| CAP | 0.056** (0.023) | 0.13** (0.051) | 0.147*** (0.046) | 0.23 (0.171) | 0.79 (0.9) | 0.899** (0.436) |
| LNTA | 0.183*** (0.034) | 0.064 (0.081) | 0.062 (0.077) | 1.332*** (0.302) | 0.023 (0.717) | 1.227*** (0.466) |
| OPEN | 0.012*** (0.003) | 0.006 (0.008) | 0.006 (0.008) | 0.105*** (0.034) | −0.03 (0.083) | 0.152*** (0.056) |
| GDP | 0.038*** (0.003) | 0.458*** (0.024) | ||||
| INF | 0.035*** (0.006) | 0.134*** (0.036) | ||||
| COV | −0.187*** (0.068) | −0.206*** (0.057) | −2.311** (1.08) | −1.696*** (0.496) | ||
| GFC | −0.265* (0.159) | −4.299*** (1.639) | ||||
| CONST | −4.96*** (1.267) | −2.429 (3.405) | −2.517 (3.211) | −31.13*** (10.84) | 2.893 (35.145) | −26.353 (17.963) |
| Observations | 2,773 | 3,376 | 3,376 | 2,773 | 3,376 | 3,376 |
| AR1 (p-value) | 0.000 | 0.000 | 0.000 | 0.000 | 0.001 | 0.000 |
| AR2 (p-value) | 0.190 | 0.071 | 0.113 | 0.415 | 0.105 | 0.201 |
| Hansen test (p-value) | 0.170 | 0.265 | 0.179 | 0.086 | 0.546 | 0.142 |
Note(s): ROA, pre-tax return on assets; ROE, pre-tax return on assets; ROE, pre-tax return on equity; ESG, the ESG combined score; SQESG, the squared value of ESG; LA, the ratio of total loans to total assets; DEPO, the ratio of total deposits to total loans; NPL, the ratio of non-performing loans to total loans; CAP, the ratio of total equity to total assets; LNTA, the natural logarithm of total assets; OPEN, the banking freedom index; GDP, the growth rate of GDP; INF, the inflation rate; COV, dummy variable for the COVID-19 period of 2020–2021; GFC, dummy variable for the global financial crisis period of 2007–2009. Variables in italics are instrumented through the GMM procedure following Arellano and Bover (1995). Robust standard errors are in parentheses. *, **, and *** denote significance at the 10%, 5%, and 1% levels, respectively
For bank characteristics, bank profitability is positively affected by bank capitalization ( (Le and Ngo, 2020; Le and Nguyen, 2020), bank size () (Maudos and Solís, 2009). When controlling for the economic growth and the inflation, the findings show that and affect bank profitability positively. This, thus, is comparable with the findings of Le et al. (2020), and Le and Nguyen (2020). Interesting, the positive coefficients on demonstrate that the openness of the banking system may enhance bank profitability. This finding is consistent with cross-country studies such as Le and Ngo (2020), Mercieca et al. (2007), and Le et al. (2020).
Furthermore, the negative coefficients on reemphasize the adverse impact of the COVID-19 pandemic on the global banking system. Again, this finding is in line with prior studies such as Miah et al. (2021), Elnahass et al. (2021), Demirgüç-Kunt et al. (2021). When including the impact of the global financial crisis in the original model, the negative impact of the health crisis remains and the negative impact of GFC is also found. The adverse impact of GFC is well-documented in the literature (Le and Ngo, 2020; Le and Nguyen, 2021). Unlike the global financial crisis of 2007–2009, this coronavirus crisis indirectly impacted the global banking system by disrupting the demand and supply sides of the entire economy and the supply chain worldwide. In response, the global authorities took several policy measures, notably community lockdowns, social distancing measures, business closings. This will affect households’ income, firms’ operations and profits, thus affecting their ability to pay their debts (Elnahass et al., 2021; Le et al., 2022a).
4.2 ESG activities and bank performance during the crises
Because ROA is our main interest variables, we only report the results of ROA as a dependent variable. The tables of results using different measures of bank profitability are available upon the request.
Nonetheless the same findings are still obtained (see Table 4). Given the convex-shaped correlation between ESG and bank profitability and the negative impact of the COVID-19 pandemic as explained above, we further examine whether the long-term benefits of ESG activities on bank profitability would be present during the COVID-19 outbreak.
The result with the interaction terms
| Profitt | ROA | ROA | ROE | ROE |
|---|---|---|---|---|
| Profitt−1 | 0.468*** (0.123) | 0.554*** (0.163) | 0.539*** (0.082) | 0.51*** (0.084) |
| ESG | −0.021 (0.015) | −0.015 (0.016) | −0.193 (0.211) | 0.107 (0.269) |
| SQESG | 0.0001 (0.0001) | −0.00003 (0.0001) | 0.0004 (0.002) | −0.003 (0.003) |
| LA | −0.009 (0.013) | −0.012 (0.014) | −0.166 (0.153) | −0.254 (0.147) |
| DEPO | −0.006 (0.006) | −0.004 (0.006) | 0.004 (0.053) | 0.011 (0.061) |
| NPL | 0.016 (0.019) | 0.028 (0.022) | 0.026 (0.178) | 0.171 (0.228) |
| CAP | 0.032 (0.044) | 0.071 (0.045) | 0.635 (0.446) | 0.908* (0.521) |
| LNTA | 0.133** (0.057) | 0.14** (0.059) | 1.446*** (0.484) | 1.142** (0.496) |
| OPEN | 0.014** (0.006) | 0.029*** (0.011) | 0.175*** (0.055) | 0.177*** (0.057) |
| COV | −0.377** (0.174) | −0.525*** (0.186) | −5.813*** (1.724) | −8.379*** (2.133) |
| GFC | 17.431 (11.66) | −0.689 (9.742) | ||
| ESG*COV | 0.009** (0.004) | 0.01*** (0.004) | 0.119*** (0.037) | 0.162*** (0.046) |
| ESG*GFC | −0.369 (0.238) | −0.086 (0.177) | ||
| CONST | −1.994 (2.327) | −3.972 (2.85) | −31.606 (19.656) | −26.99 (22.784) |
| Observations | 3,376 | 3,376 | 3,376 | 3,376 |
| AR1 (p-value) | 0.000 | 0.014 | 0.000 | 0.000 |
| AR2 (p-value) | 0.103 | 0.296 | 0.167 | 0.278 |
| Hansen test (p-value) | 0.343 | 0.367 | 0.389 | 0.458 |
Note(s): ROA, pre-tax return on assets; ROE, pre-tax return on assets; ROE, pre-tax return on equity; ESG, the ESG combined score; SQESG, the squared value of ESG; LA, the ratio of total loans to total assets; DEPO, the ratio of total deposits to total loans; NPL, the ratio of non-performing loans to total loans; CAP, the ratio of total equity to total assets; LNTA, the natural logarithm of total assets; OPEN, the banking freedom index; GDP, the growth rate of GDP; INF, the inflation rate; COV, dummy variable for the COVID-19 period of 2020–2021; GFC, dummy variable for the global financial crisis period of 2007–2009. Variables in italics are instrumented through the GMM procedure following Arellano and Bover (1995). Robust standard errors are in parentheses. *, **, and *** denote significance at the 10%, 5%, and 1% levels, respectively
We include as the interaction term between and in the baseline model. Table 4 shows that the coefficients of are positive and statistically significant across the models, implying that banks associated with high ESG scores outperform those with lower ESG during the COVID-19 outbreak. Nonetheless, this somewhat supports the early suggestion of Danisman (2022), who found a positive impact of ESG scores on bank stock returns in the first wave (February–April 2020) and the impact becomes insignificant in the extended wave (February 2020–April 2021). Our findings further support the view of the European Union in committing to the European Green Deal during the pandemic to become carbon neutral by 2050 (Danisman, 2022). As financial intermediaries, banks provide a substantial source of financing for non-financial corporations. Banks play a critical role in reallocating the capital to low-carbon activities and facilitating transition activities. The emergence of the COVID-19 pandemic and climate change necessitates speeding up the transition towards a low-carbon and more sustainable development. ESG commitments are thus one of critical factors to drive potential consumers, customers’ loyalty and staff engagement, especially during the COVID-19 turmoil (PwC, 2021). Bischof et al. (2021) demonstrated that the implementation of ESG to business model helps banks to understand and engage with clients better on their own climate risks and sustainable transformations, which in turn secures their client relationship. This thus becomes a competitive advantage and a source of new revenue streams, especially during the health crisis. This somehow supports the view of the positive effect of ESG in the non-financial sector (Broadstock et al., 2021; El Khoury et al., 2021; Yoo et al., 2021; Lööf et al., 2022; Zhang et al., 2022).
When observing the joint effect of ESG and GFC, the coefficients of are statistically not significant. Again this somewhat supports the argument of Cornett et al. (2016) that banks were blamed for the trigger of the global financial crisis, so they must change many things, including CRS activities during the GFC period. Therefore, ESG may significantly mitigate the negative impact of GFC on the global banking system.
4.3 Robustness analyses
First, we examine whether the contribution of each ESG component (, , and ) to banks’ profitability are different (Díaz et al., 2021; El Khoury et al., 2021; Gregory, 2022). Second, since it is suggested that ESG may mitigate the negative impact of the COVID-19 pandemic on bank profitability (i.e., ROA) differently across subsamples [9], we, therefore, divide our sample into developed markets and emerging markets. Third, we, follow Harjoto and Jo (2015) and Di Tommaso and Thornton (2020) to investigate whether the relationship between ESG and bank performance may differ at a different level of bank profitability. Accordingly, our sample is divided into ones above and below the median of bank profitability. Fourth, we also follow Azmi et al. (2021) and El Khoury et al. (2021) in using the Tobin’s Q as an alternative market-based measure of bank profitability, and also control for US versus non-US banks by excluding 250 banks from the US (40.90% of the total observations) to ensure our main findings are not driven solely by those in this country. Lastly, one may argue that large banks tend to engage more in ESG activities (Waddock and Graves, 1997); we further classify large and small banks as ones with above and below the median of total assets (Le, 2019; Le and Pham, 2021). Our results show that our main findings are consistent across different settings of measurements, ESG components, markets, and samples (see Appendixes 2-5).
5. Conclusions
This paper revisited the impacts of the ESG and its components on the global bank profitability considering the COVID-19 outbreak. We generally found that ESG activities may reduce bank profitability, thus supporting the trade-off hypothesis that the adoption of ESG standards could increase the costs while lowering profitability (Galant and Cadez, 2017; Di Tommaso and Thornton, 2020; Tampakoudis et al., 2021). In addition, there is a U-shaped relationship between ESG and bank profitability, suggesting that in the long term, ESG activities can help improve bank performance. Such effects have been found in the non-bank financial sector in South Korea (Han et al., 2016) and in the US (Nollet et al., 2016), but this is the first time observed in the global banking sector. Our study, therefore, provides empirical evidence to support the sustainable development policy that many countries implement (United Nations, 2018; Whelan and Atz, 2021; Ngo et al., 2022).
In line with other early findings from the literature (Demirgüç-Kunt et al., 2021; Elnahass et al., 2021; Miah et al., 2021; Le et al., 2022a), we also found evidence of the adverse impacts of the COVID-19 pandemic on the global banking system. More importantly, our findings further suggest that banks associated with higher ESG scores outperform those with lower ESG during the COVID-19 outbreak. It is because ESG banks can attract more responsible investors and customers (Amel-Zadeh and Serafeim, 2018; Pedersen et al., 2021). It thus supports the argument that in the recent years, the COVID-19 and climate change have necessitated speeding up the transition of the global economy towards a low-carbon and more sustainable development (Bischof et al., 2021; PwC, 2021; Yoo et al., 2021; Lööf et al., 2022; Zhang et al., 2022). As a result, our study provides empirical incentives for bank managers to be more ESG-oriented in their activities.
We also examined the impact of other factors such as bank capitalization, bank size, economic growth, inflation and openness. Our findings are consistent with cross-country studies such as Le and Ngo (2020), Mercieca et al. (2007), and Le et al. (2020). Our results are robust across different models and settings (e.g. developed versus developing countries, different levels of profitability, and samples with versus without US banks).
Since the COVID-19 is an ongoing issue, and because of the data availability constraint (e.g., we could not collect data on bank ownership, or data on GDP and inflation were not available after 2020), we expect that future research could provide a more comprehensive analysis to strengthen our findings. One may also extend our study to a larger sample (e.g., using the BankScope database), different profitability and performance measurements such as technical or cost efficiency (Boubaker et al., 2022; Le et al., 2022b), and other advanced methodologies such as the auto-regressive distributed lag (ARDL) with structural break, Bayesian or machine learning (Haans et al., 2016; Preciado Arreola et al., 2020; Zhao et al., 2020; Thaker et al., 2021). We look forward to such studies contributing to the literature on ESG and bank performance amid the COVID-19 pandemic.
| Country | Banks | Country | Banks | Country | Banks |
|---|---|---|---|---|---|
| Australia | 7 | Hungary | 1 | Poland | 4 |
| Austria | 1 | Indonesia | 5 | Portugal | 2 |
| Bahrain | 1 | Ireland | 3 | Qatar | 7 |
| Brazil | 4 | Israel | 4 | Russia | 2 |
| Canada | 9 | Japan | 36 | Saudi Arabia | 6 |
| Chile | 1 | Jordan | 1 | Singapore | 3 |
| China | 25 | Kuwait | 3 | South Africa | 5 |
| Colombia | 3 | Malaysia | 8 | South Korea | 5 |
| Cyprus | 1 | Mexico | 3 | Spain | 8 |
| Czech Republic | 1 | Morocco | 1 | Sweden | 3 |
| Denmark | 4 | The Netherlands | 2 | Switzerland | 6 |
| Egypt | 1 | New Zealand | 1 | Taiwan | 10 |
| Finland | 1 | Norway | 1 | Thailand | 6 |
| France | 3 | Oman | 5 | Turkey | 6 |
| Germany | 2 | Pakistan | 1 | United Arab Emirates | 4 |
| Greece | 4 | Peru | 3 | United Kingdom | 9 |
| Hong Kong | 1 | Philippines | 4 | United States | 250 |
| ROAt | E | S | G | |||
|---|---|---|---|---|---|---|
| ROAt−1 | 0.586*** (0.202) | 0.455*** (0.096) | 0.378*** (0.103) | 0.608*** (0.106) | 0.372*** (0.125) | 0.43*** (0.141) |
| ESG | −0.063** (0.031) | 0.0004 (0.009) | −0.058*** (0.021) | −0.031 (0.025) | −0.484** (0.021) | −0.0004 (0.029) |
| SQSESG | 0.0006* (0.0003) | −0.0001 (0.0001) | 0.0005*** (0.0002) | 0.0002 (0.0002) | 0.0004** (0.0002) | −0.00005 (0.0003) |
| OPEN | 0.013 (0.011) | 0.006 (0.004) | 0.008 (0.005) | 0.013* (0.007) | 0.014** (0.007) | 0.007 (0.006) |
| COV | −0.337*** (0.086) | −0.263*** (0.058) | −0.133** (0.064) | −0.426** (0.193) | −0.251*** (0.062) | −0.933*** (0.347) |
| ESG*COV | 0.005*** (0.001) | 0.006* (0.004) | 0.016** (0.007) | |||
| CONST | −3.631 (4.239) | −0.456 (1.668) | −3.18 (2.361) | −2.307 (2.849) | −2.091 (3.323) | 0.173 (4.67) |
| Control variables | Yes | Yes | Yes | Yes | Yes | Yes |
| Observations | 3,376 | 3,376 | 3,376 | 3,376 | 3,376 | 3,376 |
| AR1 (p-value) | 0.001 | 0.000 | 0.000 | 0.000 | 0.000 | 0.000 |
| AR2 (p-value) | 0.078 | 0.098 | 0.089 | 0.114 | 0.053 | 0.090 |
| Hansen test (p-value) | 0.567 | 0.394 | 0.198 | 0.294 | 0.130 | 0.422 |
Note(s): ROA, pre-tax return on assets; ESG, the ESG pillar being examined; SQESG, the squared value of the ESG pillar; E, the environmental pillar score; S, the social pillar score; G, the governance pillar score; OPEN, the banking freedom index; COV, dummy variable for the COVID-19 period of 2020–2021. Variables in italics and control variables are instrumented through the GMM procedure following Arellano and Bover (1995). Robust standard errors are in parentheses. *, **, and *** denote significance at the 10%, 5%, and 1% levels, respectively
| Developed countries | Developing countries | |||||||
|---|---|---|---|---|---|---|---|---|
| ROAt | ESG | E | S | G | ESG | E | S | G |
| ROAt−1 | 0.383*** (0.142) | 0.438*** (0.138) | 0.485*** (0.157) | 0.464*** (0.155) | 0.258*** (0.071) | 0.244*** (0.067) | 0.411*** (0.105) | 0.333*** (0.114) |
| ESG | −0.007 (0.012) | 0.007 (0.012) | 0.011 (0.026) | 0.005 (0.03) | −0.057** (0.024) | −0.001 (0.005) | 0.016 (0.012) | −0.78*** (0.024) |
| SQESG | 0.0001 (0.0001) | −0.0001 (0.0001) | −0.0002 (0.0003) | −0.00004 (0.0003) | 0.0005** (0.0002) | 0.00002 (0.00005) | −0.0002 (0.0001) | 0.0008*** (0.000) |
| COV | −0.36*** (0.122) | −0.187*** (0.064) | −0.463*** (0.158) | −0.698** (0.311) | −0.917*** (0.242) | −0.717*** (0.075) | −1.376*** (0.466) | −0.116 (0.304) |
| ESG*COV | 0.006** (0.003) | 0.003* (0.001) | 0.009** (0.004) | 0.011* (0.006) | 0.009** (0.004) | 0.008*** (0.001) | 0.018** (0.007) | −0.004 (0.006) |
| CONST | −2.85* (1.504) | −1.055 (2.139) | −3.401* (2.03) | −0.342 (3.502) | 0.154 (1.92) | 0.204 (1.166) | −0.456 (4.705) | −1.69 (2.748) |
| Control variables | Yes | Yes | Yes | Yes | Yes | Yes | Yes | Yes |
| Observations | 2,768 | 2,768 | 2,768 | 2,768 | 608 | 608 | 608 | 608 |
| AR1 (p-value) | 0.000 | 0.000 | 0.000 | 0.000 | 0.000 | 0.000 | 0.000 | 0.000 |
| AR2 (p-value) | 0.133 | 0.200 | 0.136 | 0.195 | 0.060 | 0.061 | 0.065 | 0.124 |
| Hansen test (p-value) | 0.237 | 0.327 | 0.417 | 0.080 | 0.484 | 0.166 | 0.152 | 0.288 |
Note(s): ROA, pre-tax return on assets; ESG, the ESG variable being examined; SQESG, the squared value of ESG variables E, the environmental pillar score; S, the social pillar score; G, the governance pillar score; COV, dummy variable for the COVID-19 period of 2020–2021. Variables in italics and control variables are instrumented through the GMM procedure following Arellano and Bover (1995). Robust standard errors are in parentheses. *, **, and *** denote significance at the 10%, 5%, and 1% levels, respectively
Notes
For further reading, please see https://www.sustainable-markets.org/taskforces/financial-services-taskforce/
Please see https://www.unepfi.org/net-zero-banking/commitment/
Please see Le et al. (2022a) and Boubaker et al. (2022).
The period of 2007–2009 is seen as the acute crisis period (Bank for International Settlements, 2010). This dummy variable is used in several studies such as Le (2019), Fu et al. (2015), Le and Ngo (2020).
These result tables are omitted to save some space but are available upon request.
The instrument variables are not correlated with the residuals if the p-value of Hansen test for overidentifying restrictions should be greater than 0.05 (Cameron and Pravin, 2010).
Note that if the p-value of AR2 is greater than 0.05, instruments are still valid (Arellano and Bond, 1991).
As suggested by an anonymous referee, it would be interesting to extend the research to examine how the tipping point of the U-shape can be moved, or if the banks can stiffen or flatten their U-shape curve. We leave these tasks for future studies.
Results using ROE and Tobin’s Q are consistent with those reported here and thus are omitted.
References
Appendix 1
Number of banks per country used in the analysis
Appendix 2
The results of ESG components
Appendix 3
The results in developed countries vs. developing countries
Appendix 4 The result of a different level of bank profitability
| ROAt | Above the median | Below the median |
|---|---|---|
| ROAt−1 | 0.235** (0.093) | 0.204** (0.092) |
| ESG | 0.026 (0.018) | −0.031*** (0.011) |
| SQESG | −0.0003 (0.0002) | 0.0003** (0.0001) |
| COV | −0.574** (0.215) | −0.215** (0.09) |
| ESG*COV | 0.011** (0.005) | 0.004** (0.017) |
| CONST | 2.762 (2.073) | 0.696 (1.433) |
| Control variables | Yes | Yes |
| Observations | 1,375 | 1,442 |
| AR1 (p-value) | 0.000 | 0.002 |
| AR2 (p-value) | 0.284 | 0.831 |
| Hansen test (p-value) | 0.114 | 0.533 |
Note(s): ROA, pre-tax return on assets; ESG, the ESG combined score; SQESG, the squared value of ESG; COV, dummy variable for the COVID-19 period of 2020–2021. Variables in italics and control variables are instrumented through the GMM procedure following Arellano and Bover (1995). Robust standard errors are in parentheses. *, **, and *** denote significance at the 10%, 5%, and 1% levels, respectively
Appendix 5 The result of using alternative measure of bank profitability and different subsample
| Profitt | Tobin’s Q (full sample) | ROA (non-US banks only) |
|---|---|---|
| Profitt−1 | 0.525** (0.218) | 0.309** (0.127) |
| ESG | 0.018 (0.012) | −0.009 (0.029) |
| SQESG | −0.0002 (0.0001) | 0.0001 (0.0003) |
| COV | −0.115** (0.052) | −0.715*** (0.233) |
| ESG*COV | 0.002* (0.001) | 0.009* (0.005) |
| CONST | −0.777** (0.825) | −3.641 (3.752) |
| Control variables | Yes | Yes |
| Observations | 3,347 | 2035 |
| AR1 (p-value) | 0.008 | 0.000 |
| AR2 (p-value) | 0.727 | 0.199 |
| Hansen test (p-value) | 0.536 | 0.493 |
Note(s): ROA, pre-tax return on assets; ESG, the ESG combined score; SQESG, the squared value of ESG; COV, dummy variable for the COVID-19 period of 2020–2021. Variables in italics and control variables are instrumented through the GMM procedure following Arellano and Bover (1995). Robust standard errors are in parentheses. *, **, and *** denote significance at the 10%, 5%, and 1% levels, respectively
