

The utilisation of building information modelling (BIM) technology is rapidly increasing among construction professionals across the world. Notwithstanding, recent studies revealed a low level of BIM implementation in the context of the Nigerian construction sector. Moreover, previous studies have established that BIM application comes with its share of various barriers. Therefore, this study aims to carry out an on-site survey on barriers to the application of BIM on construction sites in the Nigerian construction industry.
An extensive review of literature on BIM barriers was conducted, from where 33 factors were identified as significant BIM barriers peculiar to the developing countries. A questionnaire was developed and distributed to the targeted respondents, who are practicing professionals in the Nigerian construction industry, based on the identified barriers. The data collected were analysed by using both descriptive and inferential statistics.
The principal component analysis revealed that 27 barriers were peculiar to the Nigerian construction industry. The “lack of familiarity with BIM capacity, habitual resistance to change from the traditional style of design and build, and poor awareness of BIM benefit” were identified as the three most critical barriers hindering BIM application on construction sites in the Nigerian construction industry.
This study reveals key information on the peculiar barriers to BIM application in the Nigerian construction industry. The avoidance of these barriers will not only assist various construction stakeholders in the successful implementation of BIM application on a construction project but also promote information management systems and productivity within the construction industry to a great extent. These will further improve post-construction activities.
This study provides a substantial understanding of BIM state of the art in the context of barriers hindering BIM application on construction sites in the Nigerian construction industry.
1. Introduction
The importance of building information modelling (BIM) technology since its advent cannot be over-emphasised. Professor Chuck Eastman originally proposed the BIM prototype in 1975. He proposed to “build a computer-based description of a building”, which transformed into the BIM technology that the construction professionals are enjoying its simplicity to date (Yongliang et al., 2020). BIM represents a fundamental change to the traditional ways construction professionals function and communicate. It allows for collaboration and ease of data sharing among construction professionals (Eastman et al., 2011). “BIM has been defined as a digital representation of a facility’s physical and functional characteristics” [National Building Information Modeling Standards (NBIMS, 2010)]. This definition is in line with Azhar et al. (2012). According to the authors, “BIM is a shared knowledge resource for information about a facility forming a reliable basis for decisions during its life cycle, from earliest conception to demolition”. Similarly, Succar (2009) sees BIM as the technology capable of handling the entire data, in its whole application, considering the different stages of a building’s life sequence, which can be held on a sole mutual technological setting. This idea is the foundation on which BIM technology operates from inception to date.
The research conducted by Stanford University’s Center for Integrated Facilities Engineering, reported by Yongliang et al. (2020), indicates that proper BIM use on building projects is set to minimise 40% of the unbudgeted changes. Additionally, it produces about a 7% reduction in the project’s expected duration, leads to an 80% timesaving used within project costing valuation, creates almost a 10% increase in contract value savings and produces a 3% profit margin for the whole project. Puolitaival and Forsythe (2016) noted that BIM has now become a standard technological tool used in the life cycle of a construction project. In addition, it has been proven to function as a managerial instrument for construction works (Adam et al., 2021). Presently, built environment professionals have shown a growing interest in realising BIM benefits in the construction industry (Succar and Kassem, 2015). However, certain barriers are limiting the application of BIM in the construction industry and, as such, blocking the realisation of BIM’s full benefit in construction. BIM implementation barriers are the factors that disturb the successful application of BIM in a construction project. The presence of these barriers implies that certain elements which are required for the successful application of BIM are not in place. The unavailability of these elements in the construction industry is a signal that the adoption of BIM will be reduced in the construction industry (Olugboyega and Windapo, 2021). Migilinskas et al. (2013) concluded that “practically, construction project teams consist of professionals with different levels of BIM methodological knowledge”. Therefore, the BIM application process must break some borders and overcome barriers of different nature. Previous studies have shown that certain barriers are peculiar to the region where BIM technology has not been fully adopted (Toyin and Mewomo, 2021). Consequently, this paper examines the BIM barriers peculiar to regions yet to fully adopt BIM with specific reference to the Nigerian construction industry as a case study.
2. Literature review
Although there have been a series of research and practical evidence which prove that BIM can enhance the production, operation and maintenance of building construction works (Azhar, 2011; Arayici, 2015; Charef et al., 2019; Gamil and Rahman, 2019; Van Roy and Firdaus, 2020). It also has been stated by several authors, including Sun et al. (2017), Saka and Chan (2020), Wu et al. (2021), that BIM technology implementation faces so many barriers that slowdown its wider application on construction sites. BIM is considerably more difficult to adopt and implement. Seeing as a modern phenomenon that tends to disrupt the methods that built professional and construction industries have been using to perform their activities. Whereas “traditional design and construction management technologies cannot provide the accuracy demanded by the growing complexity of modern structures” (Alemayehu et al., 2021). The construction industry has been focusing on BIM for decades, and several research studies have been undertaken to examine BIM acceptance and implementation barriers. This shows that the industry wants to quickly change present practices (Alemayehu et al., 2021). Notwithstanding, there is the need to document the barriers hindering BIM application in the construction phase of the building project. Ahmed (2018) conducted a general review on BIM implementation barriers. The author identified 37 barriers. According to the author, the major barriers are “Social and habitual resistance to change, traditional methods of contracting, Training expenses and the learning curve is too expensive, High cost of software purchasing and Lack of awareness about BIM”. These findings are an eye-opener to the BIM barriers in the construction industry. However, this research is limited to barriers facing the application of BIM on building construction sites. The results from the reviewed literature on barriers to BIM application were first grouped under the developing and developed countries. The grouping criteria were based on: low- and middle-income economies (developing countries), whereas the upper middle income and the high income are referred to as developed countries (IMF, 2021). This study species on those barriers that are peculiar and critical to the successful application of BIM on construction sites in the Nigerian construction industry.
2.1 Developed countries
Decades ago Khosrowshahi and Arayici (2012) researched in the UK, the authors identified 8 barriers facing the UK construction industry, namely, “firms lack of familiarity with BIM use; reluctance to initiate new workflows or train staff; cost effects of BIM application; perceived low benefits; low financial gain; lacks the capital to invest in having started with hardware and software; high risk involved; resistance to culture change; and no demand for BIM use”. Eadie et al. (2014) researched in the UK; their findings discovered that “Lack of Flexibility and Lack of supply chain Buy-in, were the most critical barriers facing the top 74 UK-based main construction contractors”. Halttula et al. (2015) researched in Finland; they were able to identify the following as the major barriers slowing down the adoption of BIM: “organisational and common process-based barriers, change resistance-related barriers and interoperability problems”. However, recent research by Lesniak et al. (2021) in Poland focused on architecture, construction and engineering projects. Their findings show that “lack of knowledge and reluctance to change” were the major barriers slowing down the full adoption of BIM. Charef et al. (2019) researched the European Union (EU), and through their findings, six barriers were recognised as the critical barriers in the region which are as follows: “Cultural change required, resistance to change (cultural/staff); lack of in-house expertise/skilled personnel shortage; lack of training/education in universities; lack of guidance for BIM implementation and utilisation; lack of new or amended form of construction contracts.”, Their study covers 11 EU countries. A total of 81% of the respondents in all the countries acknowledged those six barriers. Ullah et al. (2019) researched Estonia; their focus was on BIM benefits and barriers in the construction industry. Wherein, 18 barriers were documented. Thereafter, three barriers were identified as the critical barriers: “lack of awareness about BIM benefits; inadequate training on the use of BIM; resistance to change current construction industry culture”. Belay et al. (2021), studied the Ethiopian construction sector. The authors identified 17 BIM adoption barriers. Wherein, “insufficient IT Infrastructure”, “Poor Government Help“, “Lack of BIM Researches and Courses in Universities” are the critical barriers found hindering BIM adoption on infrastructure projects.
2.2 Developing country
El Hajj et al. (2021) conducted research in the North and Middle East African developing countries. The authors identified 16 critical barriers across the countries. The first, five identified critical barriers: “Lack of knowledge and BIM awareness, Commercial issues and investment cost, lack of skills, and BIM specialist, Interoperability, Lack of client demand”. Alemayehu et al. (2021) research in Ethiopia. The authors were able to identify six critical barriers: “inadequate national standard; lack of information sharing in BIM; the high initial cost of software; high implementation cost; lack of professionals; and high cost of training and education”, it was concluded by the authors through findings that those are the critical BIM barriers facing Ethiopia construction industry. The recent studies conducted in China identified the following as critical barriers facing China’s construction industry: the high cost of BIM application (Wu et al., 2021; Deng et al., 2020; Zhou and Yang, 2019), lack of support from the government or the client (Wu et al., 2021; Zhou and Yang, 2019), management related issues (Deng et al., 2020; Zhou and Yang, 2019; Tan et al., 2019; Chan et al., 2019b); legal issue (Zhou and Yang, 2019; Deng et al., 2020); lack of research about BIM (Tan et al., 2019; Chan et al., 2019b); inherent resistance to BIM change (Chan et al., 2019b). In addition, Deng et al. (2020) identified 23 barriers. Out of which, 19 were gotten from the literature review. Additional four were obtained through an interview with BIM experts: “Project-level managers are reluctant to risk using BIM”, “Lack of reasonable performance evaluation standards in enterprises”, “Long payback period for building BIM team”, “BIM consulting market is chaotic”. These 23 BIM application barriers were classified by spindle coding and were grouped into 5 clusters: technical, management, environment, financial and legal. Furthermore, the Delphi method was used to check the interactions among them. Kekana et al. (2014) researched in South African construction industry, and they were able to identify: the inability to use BIM, lack of professional responsibility, insurability, lack of BIM required skill, lack of collaborative working process and software-related issues as the major barriers facing South Africa construction industry. Durdyev et al. (2021) researched in Cambodian focused on the construction industry and concluded that the most critical barriers are “issues related to strong industry resistance to change, especially reluctance to change from 2 D drafting to 3 D modeling, the high initial cost of the software and the shortage of professionals with BIM skills”; this is also in line with the findings of Nguyen and Nguyen (2021) conducted in Vietnam Asia. In the Indonesia construction industry content, VA Roy and Firdaus (2020) researched and found five critical barriers hindering the implementation of BIM: “lack of BIM training, lack of BIM experience and capability, no client demand, high cost in software and hardware acquisition, and inadequate information technology (IT) facilities”. Saka and Chan (2021) researched to seek the barriers facing BIM implementation, focusing on small- and medium-sized enterprises (SMEs) and large firms and between developed and developing countries. The author identified 20 barriers, from which “Resistance to change” was ranked 1st across the two categories of firms, “Lack of staff training and development” and “Lack of expertise” were ranked second by large and SMEs, respectively. In addition, “BIM is not relevant to the projects that we work on” was ranked 20th among the identified barriers by both firm categories. Olanrewaju et al. (2020) conducted their research in Nigeria; findings show a series of barriers: “few studies available on BIM and lack of knowledge, inexistence or inadequate government policies, and high cost of implementation as critical barriers”. Saka and Chan’s (2020) research focus on SMEs in the Nigerian construction industry; their findings identified: the “complex process associated with BIM adoption in the system, which was traced to the sociotechnical and technology context as the main barriers. Babatunde and Adekunle (2020) focused on the Nigerian AEC firms, where the most critical barriers were: lack of management support and BIM environment-related issues; cost of BIM software and training issues; and incompatibility, legal, contractual, and culture related issues”. Based on the available studies in Nigeria, there has not been any study that seeks to check the barriers to BIM application on construction sites by considering the opinion of on-site practicing registered built professionals across the country. This study, therefore, aims to fill that void. This research, consequently, focused mainly on construction sites in Lagos, thereby eliciting information from the professionals present on-site. BIM barriers peculiar to developing regions shows the identified barriers, and Table 1 shows the details of the reviewed articles.
Details of reviewed articles on BIM barriers
| S/N | Title | Author(s)/Year |
|---|---|---|
| 1 | Key barriers to the implementation of energy management strategies in building construction | Adnan (2018) |
| 2 | Barriers to implementation of Building Information Modelling (BIM) to the Construction Industry: a review | Ahmed (2018) |
| 3 | BIM benefits and its influence on the BIM implementation in Malaysia | Al-Ashmoria et al. (2020) |
| 4 | BIM and Construction Management: Proven Tools, Methods, and Workflows | Alemayehu et al. (2021) |
| 5 | BIM and Construction Management: Proven Tools, Methods, and Workflows | Alsaeedi et al., 2020) |
| 6 | Building information modeling | Arayici (2015) |
| 7 | Barriers to BIM adoption in Brazil | Arrotela et al. (2021) |
| 8 | Building Information Modeling (BIM): trends, benefits, risks, and challenges for the AEC industry | Azhar (2011) |
| 9 | Building Information Modeling (BIM): now and beyond | Azhar et al. (2012) |
| 10 | Barriers to BIM implementation and ways forward to improve its adoption in the Nigerian AEC firms | Babatunde and Adekunle (2020) |
| 11 | Enhancing BIM implementation in the Ethiopian public construction sector: An empirical study | Belay et al. (2021) |
| 12 | Building Information Modelling (BIM) barriers in Africa versuus global challenges | Bouhmoud, and Loudyi (2020) |
| 13 | The key drivers and barriers to the sustainable development of commercial property in New Zealand | Bond, and Perrett (2012) |
| 14 | Perceived benefits of and barriers to Building Information Modelling (BIM) implementation in construction: The case of Hong Kong | Chan et al. (2019a) |
| 15 | Building Information Modelling adoption in the European Union: An overview | Charef et al., 2019 |
| 16 | Bridging BIM and building: from a literature review to an integrated conceptual framework | Chen et al., 2015 |
| 17 | Challenges with BIM Implementation: A review of literature | Criminale and Langar (2017) |
| 18 | BIM adoption in the Cambodian construction industry: key drivers and barriers | Durdyev et al. (2021) |
| 19 | Using network theory to explore BIM application barriers for BIM sustainable development in China | Deng et al. (2020) |
| 20 | Building Information Modelling Adoption: An Analysis of the Barriers to Implementation | Eadie et al. (2014) |
| 21 | An overview of BIM adoption barriers in the Middle East and North Africa developing countries | El Hajji et al. (2021) |
| 22 | Awareness and challenges of building information modelling (BIM) implementation in the Yemen construction industry | Gamil, and Rahman (2019) |
| 23 | Barriers to achieving the benefits of BIM | Hattula et al. (2015) |
| 24 | Building Information Modeling and integration project delivery in the commercial construction industry: A conceptual study | Ilozor and Kelly (2012). |
| 25 | BIM investment, returns, and risks in China's AEC industries | Jin et al. (2017) |
| 26 | Roadmap for implementation of BIM in the UK construction industry | Khosrowshahi and Arayici (2012 |
| 27 | Roadmap for implementation of BIM in the UK construction industry | Kekana et al. (2014) |
| 28 | Barriers to BIM implementation in Architecture | Lesniak et al. (2021) |
| 29 | Implementing building information modelling in public works project in ireland | McAuley et al. (2012) |
| 30 | Building Information Modellng: Transforming design and construction to achieve greater industry productivity | McGraw-Hill (2008) |
| 31 | The benefits, obstacles, and problems of practical BIM Implementation | Migilinskas et al. (2013) |
| 32 | Barriers to BIM Adoption and the Legal Considerations in Vietnam | Nguyen and Nguyen (2021) |
| 33 | Investigating the barriers to Building information within the Nigeria construction industry | Olanrewaju et al. (2020) |
| 34 | Modelling the indicators of a reduction in BIM adoption barriers in a developing country | Olugboyega and Windapo (2021) |
| 35 | Critical Success factors of Building Information Modelling implementation | Ozorhon and Karahan (2016) |
| 36 | Practical challenges of BIM Education | Puolitaival and Forsythe (2016) |
| 37 | Past, Present and Future of information and knowledge sharing in the construction industry: Towards sematic service-based e-construction | Rezgui et al. (2011) |
| 38 | Barriers to and drivers for energy efficiency in the Swedish construction industry | Rohdin et al. (2007) |
| 39 | A review of Building Information Modelling protocols, guides, and standards for large construction clients | Sacks et al. (2016) |
| 40 | Profound Barriers to building information modelling (BIM) adoption in construction small and medium-sized enterprises (SMEs) | Saka and Chan (2020) |
| 41 | BIM divide: an international comparative analysis of perceived barriers to implementation of BIM in the construction industry | Saka and Chan (2021) |
| 42 | Understanding barriers to BIM implementation: Their impact across organisational levels in relation to BIM maturity | Siebelink et al. (2021) |
| 43 | A theoretical framework of a BIM-based multi-disciplinary collaboration platform | Singh et al. (2011 |
| 44 | Macro-BIM adoption: Conceptual structures | Succar and Kassem (2015) |
| 45 | Building information modeling framework: A research and delivery foundation for industry stakeholders | Succar (2009) |
| 46 | A literature review of the factors limiting the application of BIM in the construction industry | SUN et al. (2017) |
| 47 | Barriers to Building Information Modeling (BIM) implementation in China's prefabricated construction: An interpretive structural modeling (ISM) approach | Tan et al. (2019) |
| 48 | Barriers to successful BIM applications: A literature review | Toyin and Mewomo (2021) |
| 49 | An Overview of BIM adoption in the construction industry: benefits and barriers | Ullah et al. (2019) |
| 50 | Building Information Modelling in Indonesia: knowledge, implementation, and barriers | Van Roy and Firdaus (2020). |
| 51 | The analysis of barriers to BIM implementation for industrialized building construction: A China Study | WU et al. (2012) |
| 52 | Using network theory to explore BIM application barriers for BIM sustainable development in China | Yongliang et al. (2020) |
| 53 | SmartMarket report on Building Information Modeling (BIM): Transforming design and construction to achieve greater industry productivity | Young et al. (2008) |
| 54 | Study on barriers to implementing BIM in the engineering design industry in china | Zhang (2010) |
| 55 | Barriers to BIM implementation strategies in China | Zhou and Yang (2019) |
2.3 Summary of the literature review findings
Based on the literature review, 33 barriers were discovered to be peculiar to the developing countries, as shown in BIM barriers peculiar to developing regions:
Types of barriers peculiar to the region yet/ about to adopt BIM (Africa etc.)/Barrier code (BC):
Low computer skills among some of the professionals (BC1); Lack of familiarity with BIM capacity (BC2); Habitual resistance to change from the traditional style of design and build. (BC3); Poor awareness of BIM benefits. (BC4); Misunderstanding of BIM concept. (BC5); Lack of support from senior leaders of the construction industry from the traditional contracting system to embrace the use of BIM technology. (BC6); Lack of well-develop practical strategies and standards. (BC7); Project risks caused by BIM. (BC8); Lack of support from owners and managers due to inadequate knowledge of BIM concepts (BC9); Negative Attitude towards Working Collaborative. (BC10); Lack of a Stable BIM tool Working environment. (BC11); Lack of motivation to implement BIM in projects. (BC12); Inaccessibility to genuine BIM tools. (BC13); Absence of adequate quantifiable digital design information. (BC14); Difficulties with required training time. (BC15); Inadequate BIM data. (BC16); Complex process of learning BIM technology. (BC17); Complexity in getting used to BIM technology and procedure. (BC18); Lack of BIM experts. (BC19); Reluctancy/lack of knowledge sharing by firms that have successfully implemented BIM (BC20); Lack of organised BIM studying means (BC21); BIM consulting market is confused. (BC22); High costs related to the BIM software, hardware, and training (BC23); Project planning costs increased (BC24); Cost of BIM experts and Time required for training (BC25); Government’s unwillingness to support BIM use. (BC26); Missing insurance framework for BIM application (BC27); Lack of protocols in line with market demand (BC28); Unclear sole ownership right of BIM tool data. (BC29); Contractual BIM environment (BC30); Absence of insurance applicable to BIM application. (BC31); Low knowledge about the harsh BIM application principles and guidelines for certain project professionals. (BC32) Absence of support from policymakers (BC33).
Source: Authors’ findings DII 2021 conference.
The identified factors were subjected to further analysis.
3. Research methodology
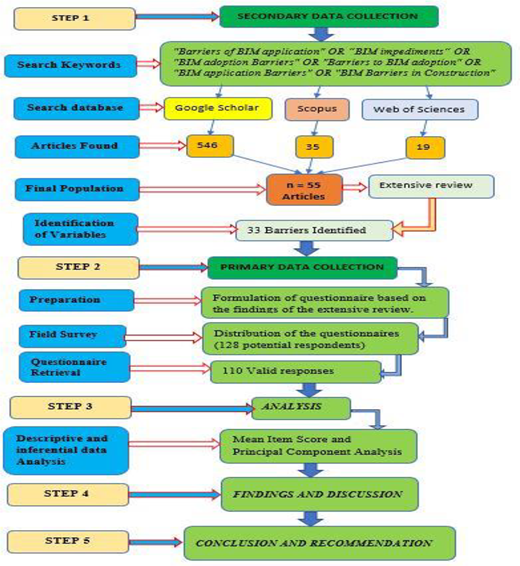
This research follows the designed framework in Figure 1, which is sub-divided into five sections. Section 1 Entails the process of obtaining secondary data. This comprises of identification of keywords; the selected keywords are: “Barriers of BIM application” or “BIM impediments” or “BIM adoption Barriers” or “Barriers to BIM adoption” or “BIM application Barriers” or “BIM Barriers in Construction”. This wide range of keywords was used to select every related article. These keywords were repeated in selected academic databases of Google Scholar, Scopus and Web of Science (WoS). In a critical review, Toyin and Mewomo (2022) adopted this method. Scopus and WoS are among the toped and most reliable academic databases that house millions of scholarly articles. Google Scholar gives access to the most article download link. The search was first conducted between July and early August 2021 and was presented during the DII 2021 conference. These focused on data indexed by Google Scholar, Scopus and WoSs, later update after the conference in October 2021, thus, generated n = 546, 35 and 19, respectively. Exclusion criteria such as duplicate articles, articles in-press, not related and articles not written in English were adopted. Also, the inclusion criteria are related to double-blind reviewed journal articles, conference papers and book chapters, generating n = 55. An extensive review was conducted using the 55 articles. These generated 33 barriers variable. Thus, the identified variables were based on barriers that have received significant consideration in the earlier studies performed in different countries. Similar methods were adopted by Chan et al. (2018). The authors submit that it is “more appropriate to use well-known factors for a research study, as that would allow respondents to respond easily”. Section 2 presents primary data collection. This encompasses the formulation of the questionnaire, distribution and retrieval of the questionnaire. Section 3 presents data analysis, and descriptive and inferential analysis: mean item score (MIS) and principal component analysis (PCA) were used to analyse the data. Section 4 presents findings and discussion and Section 5presents conclusion and recommendation.
3.1 Building information modelling barriers identification and data collection
During the survey in Lagos state, the target population for this study consisted of various registered built professionals who are currently engaged in building production (construction stage of the project). The key barriers hindering BIM application in Nigerian construction were identified in this study. From the viewpoints of practicing construction professionals in Lagos state. Babatunde and Adekunle (2020) adopted a similar approach in their research. Furthermore, this research was similar to a recent study conducted by Chan et al. (2019a) in Hong Kong on critical success factors for BIM implementation.
3.2 Literature review
This study conducted an extensive literature review using the content analysis method to discover various barriers hindering BIM adoption, application on construction sites and implementation in construction projects. The reviewed articles were selected from high-impact journals ranked by SCImago. Criminale and Langar (2017) and Hsieh and Shannon (2005) linked content analysis to literature as a flexible method that can be adopted to analyse text data. The review outcome produces 33 barriers, which are peculiar to developing countries. This section follows the schematic steps in Figure 1. Consequently, the development of the research questionnaire was based on these 33 variables. The questionnaires were administered to on-site relevant built professionals in Lagos.
The rationales for selecting the registered built professionals are as follows:
They are statutorily qualified to carry out building production in the country.
They have a certified professional body that monitors their mode of conduct.
They are currently engaged in building production within the country.
3.3 Survey questionnaire
The researcher first confirmed the membership status of the professionals before administering the on-site survey questionnaire to determine the right targeted participant: built professionals involved in the construction stage of the projects. The data for the study was gathered by sending a questionnaire to all registered practicing professionals in Lagos. Lagos was chosen because of its high concentration in building construction work for decades compared to other states. In addition, the researcher was physically present in Lagos during this study to get information from the professionals directly working on-site, whereas others were contacted via emails and WhatsApp. The data generated during this survey covers the mainland and island in the state. The purpose of such range sampling was to grant a realistic way of collecting data and analysing the study components (Kothari, 2004). Recent research conducted by Shurrab et al. (2019) and Olanrewaju et al. (2020) likewise used a questionnaire to collect information from their respondents and used this similar sampling strategy. Tan (2011) affirmed that a questionnaire survey is an organised technique used for data collection based on a sample. The questionnaires were distributed to the target respondents via on-site, e-mail invitations and WhatsApp sharing, inviting them to complete and submit a Web-based survey questionnaire (Google Forms). Overall, 128 questionnaires were distributed, of which 110 were completed and submitted. The obtained results culminated in a response rate of 85.93%, thus providing valuable data for analysis based on Collins (2010) and as agreed and used by Olanrewaju et al. (2020). The study used a structured, multiple-choice questionnaire. The questions were on a five-point Likert scale, with five being the highest possible score.
Moreover, the five-point Likert rating scale is often used to evaluate attitudes. It demands respondents to select the choices that best reflect their attitude or view about each question phrase. (Holt, 2014; Nunayon et al., 2020). Some scientific researchers have used a Likert scale with points below and above five. (Nunayon et al., 2020; Bond and Perrett, 2012; Rohdin et al., 2007The Likert scale, on the other hand, is most accurate when it is less than seven points (Lee, 2006), but it becomes much less accurate whether it is less than five or more than seven scale points (Johns, 2010). The five-point Likert scale has become widely accepted because it is easier for responders to manage their point choices. (Nunayon et al., 2020).
3.4 Data analysis
The importance of assessing the reliability of the scales adopted in research cannot be over-emphasised. In this study, Cronbach’s alpha was used to determine the reliability and the internal consistency among factors in the survey questionnaire. Using the SPSS statistical software version 27.0, the computed alpha value was 0.916, indicating that measuring using the five-point Likert scale was reliable at a 5% significance level. The alpha value of 0.916 justifies the further factor analysis, PCA and ranking analysis that were carried out (Aluko, Idoro and Mewomo, 2021). Factor analysis identifies the underline group BIM barriers; mean item score was conducted to determine the relative ranking of the identified 33 BIM barriers factors.
4. Results and discussion
4.1 Questionnaire survey findings discussion
4.1.1 Demographic information of respondents.
The result shown in Table 2 presents respondents’ data according to their gender 78.2% male and 21.8% female, position on the project, academic qualification, current organisation type, area of specialisation and working experience.
Demographic information of respondents
| Respondent demographic data | Respondents | % | Cumulative (%) |
|---|---|---|---|
| Gender | |||
| Male | 86 | 78.2 | 78.2 |
| Female | 24 | 21.8 | 100 |
| Position on project | |||
| Builder | 53 | 48.2 | 42.2 |
| Construction manager | 17 | 15.5 | 63.7 |
| Project manager | 16 | 14.5 | 78.2 |
| Building facility/maintenance manager | 8 | 7.3 | 85.5 |
| Others | 16 | 14.5 | 100 |
| Academic qualification | |||
| Ordinary national diploma | 4 | 3.6 | 3.6 |
| Higher national diploma | 3 | 2.7 | 6.3 |
| Bachelor’s degree (B. tech and BSc) | 78 | 70.9 | 77.2 |
| Master’s degree | 16 | 14.6 | 91.8 |
| Doctorate degree | 5 | 4.6 | 96.4 |
| Others | 4 | 3.6 | 100 |
| Current organisation | |||
| Main contractor | 46 | 41.8 | 41.8 |
| Sub-contractor | 21 | 19.1 | 60.9 |
| Consultant | 21 | 19.1 | 80 |
| Client | 3 | 2.7 | 82.7 |
| Government agency developer | 7 | 6.4 | 89.1 |
| Others | 12 | 10.9 | 100 |
| Area of specialisation | |||
| Builder | 73 | 66.4 | 66.4 |
| Quantity surveyor | 8 | 7.3 | 73.7 |
| Consultant manager | 5 | 4.6 | 78.3 |
| Architect | 4 | 3.6 | 81.9 |
| Engineer | 16 | 14.5 | 96.4 |
| Others | 4 | 3.6 | 100 |
| Working experience | |||
| Less than 5 years | 56 | 50.9 | 50.9 |
| 5–10 years | 40 | 36.4 | 87.3 |
| 11–15 years | 6 | 5.5 | 92.8 |
| 16–20 years | 4 | 3.6 | 96.4 |
| More than 20 years | 4 | 3.6 | 100 |
4.1.2 Cronbach’s alpha test.
Table 3 shows Cronbach’s alpha test. Cronbach’s alpha ranges from 0 to 1. According to Mane and Nagesha (2014) and Chan et al. (2019a), the larger the α-value, the higher the reliability of the generated result or scale will be. If the α-value ≥ 0.7, the measurement scale is reliable. Cronbach’s alpha greater than or equal to 0.7 means the scale has relatively good internal reliability. The result shows that the α-value is 0.916 at a 5% significance level. Therefore, as Cronbach’s alpha coefficient of all the 33 variables (barriers) is 0.916, above 0.7, As Pallant (2005) stated this meant that all items had high internal consistency and reliability.
4.1.3 Ranking of building information modelling adoption barriers using descriptive statistics (mean item score).
Table 4 lists the result of the 33 barriers in descending order based on their mean score. Using the one-sample t-test result of 3.50, most of the BIM barriers, 30 (90.91%), are deemed statistically significant (p < 0.05) by the respondents. Table 4 also shows the mean scores of the barriers to BIM adoption ranging between 2.82 and 4.16. As a result, a minimum limit of 3.50 was set based on the mean score to determine the most important barriers to BIM adoption in the Nigerian built environment. The same limit approach was adopted by Olanrewaju et al. (2020) and Okorie and Olanrewaju (2019) in their study. However, just three of the BIM implementation barriers were below the set limit, whereas the remainder were rated as significant.
Descriptive statistics (mean item score)
| Barrier Code | N | Mean | Std. deviation |
|---|---|---|---|
| BC2 | 110 | 4.16 | 0.991 |
| BC3 | 110 | 4.03 | 0.981 |
| BC4 | 110 | 4.00 | 1.117 |
| BC13 | 110 | 4.00 | 1.084 |
| BC6 | 110 | 3.99 | 1.079 |
| BC12 | 110 | 3.94 | 1.043 |
| BC9 | 110 | 3.93 | 1.029 |
| BC21 | 110 | 3.92 | 1.033 |
| BC19 | 110 | 3.85 | 1.107 |
| BC33 | 110 | 3.85 | 1.030 |
| BC5 | 110 | 3.83 | 1.124 |
| BC23 | 110 | 3.82 | 1.051 |
| BC11 | 110 | 3.79 | 1.150 |
| BC10 | 110 | 3.78 | 1.035 |
| BC20 | 110 | 3.77 | 0.983 |
| BC7 | 110 | 3.75 | 1.110 |
| BC26 | 110 | 3.75 | 1.161 |
| BC32 | 110 | 3.75 | 1.051 |
| BC16 | 110 | 3.74 | 1.123 |
| BC14 | 110 | 3.72 | 1.182 |
| BC25 | 110 | 3.72 | 1.102 |
| BC1 | 110 | 3.67 | 1.101 |
| BC17 | 110 | 3.64 | 1.139 |
| BC15 | 110 | 3.63 | 1.156 |
| BC18 | 110 | 3.63 | 1.108 |
| BC24 | 110 | 3.63 | 1.091 |
| BC28 | 110 | 3.58 | 1.017 |
| BC31 | 110 | 3.57 | 1.079 |
| BC27 | 110 | 3.56 | 1.063 |
| BC29 | 110 | 3.55 | 1.037 |
| BC30 | 110 | 3.49 | 1.047 |
| BC22 | 110 | 3.09 | 1.170 |
| BC8 | 110 | 2.82 | 1.077 |
Table 4 shows the result of the mean ranking score from the perspective of the respondents who are construction professionals working on building production on site. Using mean score ranking to select the critical barriers, four barriers with a value greater than or equal to a 4.00 mean score were identified as the critical barriers. The first ranked by the professionals is “lack of familiarity with BIM capacity” BC2 (mean = 4.16), which is therefore considered the most critical barrier hindering the adoption of BIM in Nigeria’s construction industrysecondnd, “habitual resistance to change from the traditional style of design and build” BC3 (mean = 4.08). According to Darko et al. (2017) if two variables had the same mean score value, the one with the highest SD will be ranked first. Therefore, “poor awareness of BIM benefit” BC4 and “Inaccessibility to genuine BIM tools” BC13 have the same mean = 4.00. BC4 and BC13 SD were 1.117 and 1.084, respectively. BC4 was then ranked third, having a higher SD and BC13 was ranked fourth with SD of 1.084. Therefore, based on the viewpoints of the professionals, those four are regarded as the most critical barriers restricting the adoption of BIM in the Nigerian construction sector.
4.2 Factor analysis
Malhotra and Birks (2006) reported that in factor analysis, Bartlett’s test of sphericity and the Kaiser–Meyer–Olkin (KMO) test are commonly used in measuring sample adequacy. “When Bartlett’s test of sphericity significant is (P ≤ 0.05) and the KMO index is > 0.5, the dataset is generally acceptable for factor analysis” (Mane and Nagesha, 2014). The KMO test provided a value of 0.826, and Barlett’s test of sphericity yielded a statistically significant result (chi-square = 1678.969, p = 0.000) based on the results in Table 5. Therefore, this meets the application of factor analysis.
4.2.1 Eigenvalues variance explanation.
Table 6 shows that the analysis revealed eight components with eigenvalues greater than one, and only items with a factor loading of ≥0.5 were included in each component (factor). The whole variation in 33 barriers to BIM adoption in developing countries was explained by this eight-factor solution, which accounted for 64.47% of the overall variance.
Total variance explanation
| Component | Initial eigenvalues | Extraction sums of squared loadings | Rotation sums of squared loadings | ||||||
|---|---|---|---|---|---|---|---|---|---|
| Total | % of variance | Cumulative % | Total | % of variance | Cumulative % | Total | % of variance | Cumulative % | |
| 1 | 9.494 | 28.768 | 28.768 | 9.494 | 28.768 | 28.768 | 4.447 | 13.476 | 13.476 |
| 2 | 3.245 | 9.835 | 38.603 | 3.245 | 9.835 | 38.603 | 3.811 | 11.547 | 25.023 |
| 3 | 2.024 | 6.133 | 44.736 | 2.024 | 6.133 | 44.736 | 3.368 | 10.206 | 35.229 |
| 4 | 1.698 | 5.147 | 49.883 | 1.698 | 5.147 | 49.883 | 2.568 | 7.781 | 43.010 |
| 5 | 1.378 | 4.175 | 54.058 | 1.378 | 4.175 | 54.058 | 2.562 | 7.765 | 50.775 |
| 6 | 1.232 | 3.733 | 57.791 | 1.232 | 3.733 | 57.791 | 1.717 | 5.202 | 55.976 |
| 7 | 1.177 | 3.567 | 61.358 | 1.177 | 3.567 | 61.358 | 1.449 | 4.392 | 60.368 |
| 8 | 1.027 | 3.112 | 64.470 | 1.027 | 3.112 | 64.470 | 1.354 | 4.102 | 64.470 |
| 9 | 0.997 | 3.021 | 67.492 | ||||||
| 10 | 0.891 | 2.700 | 70.192 | ||||||
| 11 | 0.848 | 2.570 | 72.762 | ||||||
| 12 | 0.790 | 2.395 | 75.157 | ||||||
| 13 | 0.709 | 2.148 | 77.305 | ||||||
| 14 | 0.678 | 2.054 | 79.359 | ||||||
| 15 | 0.648 | 1.963 | 81.322 | ||||||
| 16 | 0.596 | 1.805 | 83.127 | ||||||
| 17 | 0.552 | 1.674 | 84.801 | ||||||
| 18 | 0.512 | 1.552 | 86.353 | ||||||
| 19 | 0.511 | 1.548 | 87.901 | ||||||
| 20 | 0.476 | 1.443 | 89.344 | ||||||
| 21 | 0.420 | 1.271 | 90.616 | ||||||
| 22 | 0.394 | 1.193 | 91.809 | ||||||
| 23 | 0.348 | 1.055 | 92.863 | ||||||
| 24 | 0.343 | 1.041 | 93.904 | ||||||
| 25 | 0.318 | 0.964 | 94.868 | ||||||
| 26 | 0.291 | 0.882 | 95.750 | ||||||
| 27 | 0.279 | 0.846 | 96.596 | ||||||
| 28 | 0.242 | 0.733 | 97.329 | ||||||
| 29 | 0.231 | 0.699 | 98.027 | ||||||
| 30 | 0.193 | 0.586 | 98.613 | ||||||
| 31 | 0.177 | 0.535 | 99.148 | ||||||
| 32 | 0.156 | 0.473 | 99.621 | ||||||
| 33 | 0.125 | 0.379 | 100.000 | ||||||
Meyers et al. (2006) advocated that an acceptable percentage of commutative variance allowable should not be less than 50%, as this is deemed required for practical importance. Furthermore, Malhotra and Birks (2017) proposed: that “the variability should be higher than 60%”. Therefore, it may be concluded that the model’s reliability is acceptable. Table 5 shows that the eight-component solution described the total of the variance, with the first component (factor) accounting for 28.768% of the variance involving seven items, the second component involving six items and contributing 9.835%, the third component involving five items and contributing 6.133% and three items was in the fourth component which contributes to 5.147%, the fifth component having three items contributing 4.175%, the sixth component involving one item and contributing 3.733%, the seventh component involving one item and contributing 3.567%, and the eighth component involving one item and contributing 1.027%. The result in Table 5 displays the 33 remaining variables (barriers) in the eight factors, as well as their associated factor loadings, explained variances and eigenvalues of the eight factors.
“The most feasible way to verify the results of the factor analysis is the scree plot” (Nunayon et al., 2020). The eigenvalues for each barrier are displayed in the scree plot. According to Malhotra and Birks (2006), the authors noted that starting from the first eigenvalue explains the most significant variation to the last eigenvalue, which explains the slightest variance. Furthermore, Pallant (2005) noted that it is of importance to closely look at the scree plot and the component matrix to figure out which elements to keep. As the amount of variation described by each eigenvalue steadily diminishes, the slope of the scree plot in Figure 2 flattens out. The graph was thoroughly examined to determine the breaking point where the slope levels out. The number of variables required to be retrieved was the same as the number of data points above the breakpoint line, as shown in Figure 2.
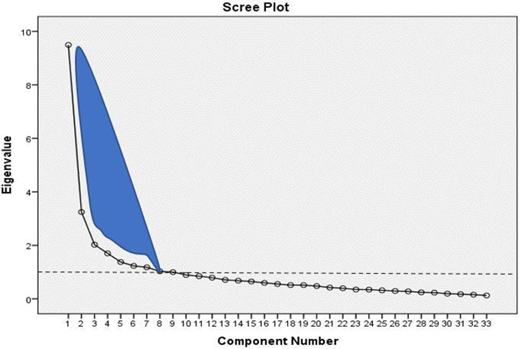
The analysis omitted data points that landed squarely on the broken line. There are a few difficult cases when data points are clumped up and cannot be identified (DeVaus, 2002; Malhotra and Birks, 2006; Hair et al., 2010). In the current study, such a scenario did not occur. Because eigenvalue is a common method for extracting factors, it was mainly used in this study for the same reason. K’Akumu et al. (2013) noted that they help define criteria for keeping the most critical elements examined in the analysis in factor analysis. An eigenvalue larger than one was used as a criterion for considering significant factors.
4.2.2 Component matrix.
According to Yong and Pearce (2013), a correlation matrix would show if the 33 variables have a patterned relationship. It is valid to continue with the analysis of the correlations are over 0.3 and none are greater than 0.9 (Tabachnick and Fidell, 2007; Field, 2009). As a result, looking at the correlation matrix for the 33 barriers in Table 7, it is clear that the correlation coefficients between these variables met this criterion. The correlation matrix findings revealed that each of these variables has a correlation coefficient greater than 0.3 with other variables. The correlation coefficients for the barriers to BIM adoption showed a strong relationship between several of these variables.
Component matrix
| Barriers Code (BC) | Component | |||||||
|---|---|---|---|---|---|---|---|---|
| 1 | 2 | 3 | 4 | 5 | 6 | 7 | 8 | |
| BC1 | 0.235 | 0.291 | 0.493 | 0.119 | −0.043 | 0.444 | 0.087 | 0.324 |
| BC2 | 0.175 | 0.612 | 0.380 | 0.365 | 0.066 | 0.182 | −0.002 | −0.087 |
| BC4 | 0.216 | 0.617 | 0.120 | 0.351 | −0.034 | −0.120 | 0.020 | −0.182 |
| BC3 | 0.330 | 0.503 | −0.157 | 0.323 | −0.182 | 0.299 | −0.171 | 0.132 |
| BC5 | 0.456 | 0.509 | −0.156 | 0.090 | −0.352 | −0.070 | 0.262 | −0.108 |
| BC6 | 0.381 | 0.498 | −0.015 | −0.179 | −0.188 | −0.057 | 0.312 | −0.044 |
| BC7 | 0.545 | 0.391 | −0.270 | −0.001 | −0.007 | 0.103 | −0.005 | 0.166 |
| BC8 | 0.272 | −0.012 | −0.359 | −0.113 | 0.677 | 0.311 | 0.186 | −0.057 |
| BC9 | 0.574 | 0.290 | −0.391 | −0.103 | 0.089 | −0.085 | −0.016 | −0.066 |
| BC10 | 0.517 | 0.197 | −0.254 | −0.208 | −0.069 | 0.221 | 0.052 | 0.318 |
| BC11 | 0.571 | 0.292 | −0.164 | −0.224 | 0.196 | 0.000 | −0.144 | −0.009 |
| BC12 | 0.457 | 0.293 | −0.396 | −0.049 | 0.079 | −0.374 | −0.201 | −0.165 |
| BC13 | 0.542 | 0.260 | 0.147 | −0.302 | 0.190 | 0.016 | −0.126 | 0.140 |
| BC14 | 0.546 | 0.221 | 0.094 | −0.416 | 0.166 | −0.167 | 0.174 | 0.153 |
| BC15 | 0.570 | 0.008 | 0.142 | −0.238 | 0.001 | 0.044 | 0.197 | −0.205 |
| BC16 | 0.641 | −0.016 | 0.258 | −0.253 | −0.186 | −0.164 | 0.143 | −0.221 |
| BC17 | 0.609 | 0.024 | 0.131 | −0.106 | −0.030 | 0.121 | −0.490 | −0.040 |
| BC18 | 0.706 | 0.076 | 0.134 | −0.172 | 0.009 | 0.158 | −0.351 | −0.279 |
| BC19 | 0.663 | −0.079 | 0.405 | 0.016 | 0.266 | −0.122 | 0.078 | 0.044 |
| BC20 | 0.566 | −0.076 | 0.468 | 0.165 | 0.124 | −0.043 | 0.085 | −0.076 |
| BC21 | 0.601 | −0.111 | 0.371 | 0.030 | 0.202 | −0.244 | 0.232 | 0.063 |
| BC22 | 0.425 | −0.574 | 0.072 | −0.106 | 0.088 | 0.302 | −0.014 | 0.075 |
| BC23 | 0.625 | −0.291 | 0.239 | 0.022 | −0.124 | −0.047 | −0.310 | −0.060 |
| BC24 | 0.530 | −0.356 | −0.143 | −0.186 | −0.352 | 0.203 | 0.162 | −0.152 |
| BC25 | 0.698 | −0.258 | 0.042 | −0.114 | −0.188 | 0.068 | 0.024 | −0.058 |
| BC26 | 0.498 | −0.188 | −0.215 | 0.373 | 0.279 | −0.075 | 0.238 | 0.090 |
| BC27 | 0.607 | −0.105 | −0.189 | 0.435 | 0.133 | 0.045 | −0.114 | −0.109 |
| BC28 | 0.563 | −0.319 | −0.241 | 0.264 | 0.029 | 0.165 | 0.192 | −0.218 |
| BC29 | 0.562 | −0.309 | −0.027 | 0.265 | −0.197 | −0.002 | 0.170 | −0.108 |
| BC30 | 0.699 | −0.256 | −0.187 | −0.003 | −0.111 | 0.057 | −0.162 | −0.005 |
| BC31 | 0.657 | −0.306 | −0.170 | 0.243 | −0.140 | 0.035 | 0.082 | 0.189 |
| BC32 | 0.544 | −0.155 | −0.080 | −0.043 | −0.263 | −0.277 | −0.010 | 0.522 |
| BC33 | 0.524 | −0.128 | 0.024 | 0.349 | 0.132 | −0.398 | −0.217 | 0.197 |
4.2.3 Rotated component matrix.
Table 8 discusses and interprets the factors extracted. This was performed using the varimax method. The correlation coefficient between the factor score and variable is called factor loading (Nunayon et al., 2020), and this is applied to compute the eigenvalues for each factor and the commonalities of each variable (Mane and Nagesha, 2014). “For the interpretation of the factor, the factor loading matrix is rotated with the core purpose of bringing the smallest loadings close to zero and its largest loading towards unity” (Enshassi et al., 2018). Pallant (2005) “purported that an obvious component structure is usually revealed when the factor loading of a variable is significant (loading > 0.5) on one component only. This was corroborated by Enshassi et al. (2018), who adopted a factor loading > 0.5 for items included in each component (factor) using a sample size of 76”. In the study of Brown (2009), the “key drivers having factor loadings close to 1 are important in the interpretation of the factor, while the key drivers with factor loadings near 0 are unimportant”. However, the variables with a loading of 0.5 and above were collected and used to suitably name the factor. Furthermore, Table 9 shows the interpretation of the required data generated from Table 8.
Rotated component matrixa
| Component | ||||||||
|---|---|---|---|---|---|---|---|---|
| Barrier Codes (BC) | 1 | 2 | 3 | 4 | 5 | 6 | 7 | 8 |
| BC28 | 0.745 | |||||||
| BC29 | 0.694 | |||||||
| BC31 | 0.687 | |||||||
| BC24 | 0.675 | |||||||
| BC30 | 0.574 | |||||||
| BC25 | 0.563 | |||||||
| BC27 | 0.549 | |||||||
| BC26 | ||||||||
| BC22 | ||||||||
| BC10 | 0.681 | |||||||
| BC7 | 0.637 | |||||||
| BC9 | 0.590 | |||||||
| BC6 | 0.546 | |||||||
| BC11 | 0.538 | |||||||
| BC5 | 0.526 | 0.524 | ||||||
| BC13 | ||||||||
| BC21 | 0.721 | |||||||
| BC19 | 0.692 | |||||||
| BC16 | 0.613 | |||||||
| BC20 | 0.602 | |||||||
| BC14 | 0.555 | 0.556 | ||||||
| BC15 | ||||||||
| BC2 | 0.759 | |||||||
| BC4 | 0.749 | |||||||
| BC3 | 0.544 | |||||||
| BC17 | 0.724 | |||||||
| BC18 | 0.723 | |||||||
| BC23 | 0.555 | |||||||
| BC33 | 0.697 | |||||||
| BC32 | ||||||||
| BC8 | 0.841 | |||||||
| BC1 | 0.736 | |||||||
| BC12 | ||||||||
Notes:
Extraction method: principal component analysis.
Rotation method: varimax with Kaiser Normalization.
aRotation converged in 20 iterations
Rotated component factor interpretation of the 27 peculiar barriers
| Component | Factor naming | Barriers | Barrier code | Factor loading |
|---|---|---|---|---|
| 1 | Financial and legal reasons | Project planning costs increased. Cost of BIM experts and time required for training Missing insurance framework for BIM application Lack of protocols in line with market demand The unclear sole ownership right of BIM tool data Contractual BIM environment Absence of insurance applicable to the BIM application | BC24 BC25 BC27 BC28 BC29 BC30 BC31 | 0.675 0.563 0.549 0.745 0.694 0.574 0.687 |
| 2 | Construction management circumstances | Misunderstanding of BIM concept Lack of support from senior leaders of the construction industry from the traditional method of contracting to embrace the use of BIM technology Lack of well-develop practical strategies and standards Lack of support from owners and managers due to inadequate knowledge of BIM concepts Negative attitude towards working collaboratively Lack of a stable BIM tool working environment | BC5 BC6 BC7 BC9 BC10 BC11 | 0.526 0.546 0.637 0.590 0.681 0.538 |
| 3 | Technological and environmental influence | Absence of adequate quantifiable digital design information Insufficient available BIM data Lack of BIM experts Reluctancy/lack of knowledge sharing by firms that have successfully implemented BIM Lack of organised BIM studying means | BC14 BC16 BC19 BC20 BC21 | 0.556 0.613 0.692 0.602 0.721 |
| 4 | Personnel factors | Lack of familiarity with BIM capacity Habitual resistance to change from the traditional mode of design and build Poor awareness of BIM benefits | BC2 BC3 BC4 | 0.759 0.544 0.749 |
| 5 | Technical and economic factor | Complex process of learning BIM technology Complexity in getting used to BIM technology and procedures High costs related to the BIM software, hardware, and training | BC17 BC18 BC23 | 0.724 0.723 0.555 |
| 6 | Leadership factors | Absence of support from policymakers | BC33 | 0.697 |
| 7 | Management factor | Project risks caused by BIM | BC8 | 0.841 |
| 8 | Professional workforce influences | Low computer skills among some construction professionals | BC1 | 0.736 |
From the results presented in Table 9, it indicated that 27 out of the identified 33 barriers were peculiar to the Nigeria construction industry, from which seven falls under financial and legal reason, six fall under construction management circumstances, five falls under technological and environmental influence, three falls under personal factor, three technical and economic factor, one leadership factors, one management factor, one professional workforce influences.
4.2.4 Component 1 and Component 6: financial and legal reason.
Financial and legal reasons are the barriers hindering BIM application in developing regions such as Nigeria. These are major cost-incurred to implement BIM technology in a construction project, issues restricting factors initiated by the lack of maturity of the regulatory/contractual environment. This comprises project planning costs increased; cost of BIM experts and time required for training; missing insurance framework for BIM application; lack of protocols in line with market demand; the unclear sole ownership right of BIM tool data, contractual BIM environment; absence of insurance applicable to BIM application with the following factor loadings, respectively, 0.675, 0.563, 0.549, 0.745, 0.694, 0.574, 0.687.
Research carried out in 2008, as reported by McGraw-Hill, shows that the major obstacle to a successful BIM application is related to costs and training problems (Young et al., 2008; Sun et al., 2017). In addition, a report published by the US National Institute for Standards and Technology (NIST) in 2004 shows that construction firm wastes close to $16bn yearly due to poor interoperability in software. Barak et al. (2009) made it known that the result of legal and insurance complications typically caused by defective software can result in a court case. There are numerous BIM software, and multiple professionals regularly form BIM models with the software packages they are familiar with and used by different participants. Suppose a document relating to the design gets lost along the line of sharing among the concerned professionals; due to improper usage or lack of proper understanding of the BIM models, tracing and confirmation may become very difficult due to the obscure responsibility. Furthermore, the following limitations highlighted by scholars must also be resolved; Méndez (2006) noted the control of entry and the safety of building information in BIM models. McAdam (2010) also included ownership and protection of data, whereas Yongliang et al. (2020) highlighted the lack of insurance and lack of standard form of contract in their research. Migilinskas et al. (2013) also included a lack of contractual protocols, among others.
4.2.5 Component 2: construction management circumstances.
Construction management circumstances refer to the coordination and administration process of BIM barriers. The barriers are “misunderstanding of the BIM concept; lack of support from senior leaders of the construction industry from the traditional method of contracting to embrace the use of BIM technology; lack of well-develop practical strategies and standards, lack of support from owners and managers due to inadequate knowledge of BIM concepts; negative attitude towards working collaboratively; lack of a stable BIM tool working environment” with the following factor loadings, respectively, 0.526, 0.546, 0.637, 0.590, 0.681, 0.538. Sun et al. (2017) believed that construction professionals prefer to adopt BIM technology, which was basically due to the fragmented status of construction procedure, which makes each project sole unique and not reproducible.
4.2.6 Component 3: technological and environmental influence.
The BIM technology-based software program is also referred to as BIM tools. BIM tool-related technology issues that limit BIM implementation are referred to as technological factors. These BIM tool-related barriers include the absence of adequate quantifiable digital design information; insufficient available BIM data; lack of BIM experts; reluctancy/lack of knowledge sharing by firms that have successfully implemented BIM; lack of organised BIM studying means; with the following factors loading respectively: 0.556, 0.613, 0.692, 0.602, 0.721. The confined capability of BIM software is the critical issue preventing its application in the construction industry (Sun et al., 2017). Furthermore, the main constraints are absence of interoperability, scalability and assistance used for true collaboration, its incompatibility aimed for the construction forming of cast-in-place-reinforced concrete constructions. These are regarded as significant restrictions on the conventional implementation of BIM (Sun et al., 2017). According to the institute of electrical and electronics engineers (1990) definition, interoperability is the ability of two or more systems or components to share information and use that information. The ranges of software used might cause parallel disintegration amongst construction team members during a specific project phase (e.g. planning, building production or operation), which can obstruct interoperability (Howard et al., 1989). According to Nisbet and Dinesen (2010), the NIST estimates the general cost of insufficient interoperability to the tune $15.8bn yearly. This has been a great challenge facing the application of BIM. Young et al. (2008) found that BIM software managers are set to improve on interoperability. In addition, numerous global standards to find a solution to the interoperability problems have been established.
In the later year, McAuley et al. (2012), Rezgui et al. (2011) and Azhar et al. (2011) discovered that there are still some inadequacies in the use of BIM, despite the increased awareness of BIM technology. According to Rezgui et al. (2011), the affirmed statistical depiction of the building and its environment are still crucial barriers to BIM technology application. The study of synchronisation of data linking BIM technology and the progress of work done on-sit in day-to-day activities is another pressing challenge over the years. Chen et al.’s (2015) research indicated increased development in technologies, processes and methods of synchronising BIM technology, with updated daily site activities, such as laser scanning, camera, global positioning system, geographic information system, augmented reality, radio frequency identification, among others. The application of such technologies has made acquiring and managing these complex data possible to bridge the constrain of BIM and daily construction work.
Environmental influence refers to the limiting factors generated within the geographical area of the construction site. BIM implementation demands expert active interactivity all through the life cycle of the project. Nevertheless, a lack of professional collaboration was a predominant barrier (Tan et al., 2019; Jin et al., 2017; Ozorhon and Karahan, 2016). This obstacle could hinder the application of BIM implementation in a construction project.
4.2.7 Component 4: personnel factors.
Personnel factors refer to the barriers attributed to the act which the professional portrayed towards BIM technology. These barriers include lack of familiarity with BIM capacity, habitual resistance to change from the traditional design and build style and poor awareness of BIM benefits, with the following factor loadings: 0.759, 0.544, 0.749. BIM technology disintegrates the traditional restrictions among various industry stakeholders and allows the sharing of project information in a single model in some collaborative environments (Yongliang et al., 2020). This means that stakeholders will have to understand their primary role in the project team and transform the company workflow to meet the requirements of the BIM application. This will cause changes to the working process from design to file organisation to customer charge and final results. Therefore, the construction firm will need adequate time to adapt to these changes (Sun et al., 2017).
4.2.8 Component 5: technical and economic factors.
Technical and economic factors include the complex process of learning BIM technology, the complexity of getting used to BIM technology and procedures and high costs related to the BIM software, hardware and training, with the following factor loadings:, respectively, 0.759, 0.544, 0.749. Musa et al. (2019) regarded BIM as an advanced technology linked with human interactions. Nevertheless, the pursuit of BIM adoption is regularly hindered by leaders’ reluctance to embrace BIM technology due to economic factors (Saka and Chan, 2019).
4.2.9 Component 7: management factor.
The management factor is the barriers emanated due to the negligence of the professionals in charge of BIM application on the project, which leads to the risk of losing vital information along the project’s life cycle during documentation. BIM disintegrates the traditional restrictions among various construction industry stakeholders and allows the sharing of project information in a single model in some collaborative environments (Yongliang et al., 2020). This means that stakeholders will have to understand their basic role in the project team and transform the work process of their companies in line with the requirements of the BIM application (Toyin and Mewomo, 2021). This will motivate the application of BIM on construction sites. Therefore, the construction firm will need adequate time to adapt to those changes (Sun et al., 2017). The factor enlisted in this section is project risks caused by BIM with a factor loading of 0.841.
4.2.10 Component 8: professional workforce influences.
Professional workforce influence is the limiting factor associated with the computer literacy of the professionals. For instance, low computer skills among some construction professionals have a factor loading of 0.736. The lack of experienced professionals that are much conversant with the process of BIM technology application, and who have adequate knowledge in managing BIM tools is an additional crucial restricting issue. Adequate knowledge about BIM education and the teaching of professional stakeholders is necessary. This will enhance the comprehensive and perfect implementation of the BIM technology. Zhang (2010) reported that most design companies (architectural, structural, mechanical and electrical) “find it challenging to use BIM because of the low productivity understanding, customary struggle to change, and heavy work demands encountered during the preliminary period of setting up BIM tools”. This poses a great challenge to the successful adoption of BIM.
4.3 Study implications
The application of BIM in the design stage has gained considerable attention in the Nigerian construction industry (Babatunde et al., 2020). Notwithstanding, its realization in the construction stage is still at an infant stage (Olanrewaju et al., 2020). While some earlier studies (Babatunde et al., 2020; Olanrewaju et al., 2020; Saka and Chan, 2020) have contributed to the improvement of BIM adoption in Nigeria, no study has sought to check what hinders BIM fast application in the construction phase. This study filled this gap. Despite the Nigerian built environment professionals’ willingness to take up BIM application, they are still far behind in its utilisation. As revealed in this study, the low application is linked to a lack of familiarity with BIM capacity, the lack of BIM experts and the high costs related to the BIM software, hardware and training. The avoidance of these barriers will not only assist various construction stakeholders in the successful implementation of BIM application on a construction project but will to a great extent promote information management systems and productivity within the Nigerian construction industry and beyond.
5. Conclusions, recommendations and future research
This survey provides empirical evidence on the barriers hindering BIM application on construction sites in the Nigerian construction industry from the standpoint of on-site practicing built environment professionals. The result of the PCA identified 27 barriers that were peculiar to the Nigerian construction industry, wherein, using the mean item score (MIS), three factors were ranked as the most significant barriers, namely, the lack of familiarity with BIM capacity, habitual resistance to change from the traditional style of design and build and poor awareness of BIM benefits. These barriers have hindered the fast application of BIM by the practicing professionals in the Nigerian construction industry. This study further indicates that project risks caused by BIM application and contractual BIM environment are ranked as the least significant barriers. In general, approximately 82% (27 out of 33) of the identified barriers peculiar to developing countries are common to the Nigerian construction industry out of which 92% (25 out of 27) of the common barriers are found to be critical having the MIS greater than 3.5.
In addition, eight barriers component clusters were generated from the PCA, namely, Component 1 and Component 6: Financial and legal reason; Component 2: Construction Management circumstances; Component 3: Technological and environmental influence; Component 4: Personnel factors; Component 5: Technical and economic factors; Component 7: Management factor and Component 8: Professional workforce influences. Moreover, the result indicated that the three significant barriers were related to Component 4: Personnel factors; “lack of familiarity with BIM capacity, habitual resistance to change from the traditional style of design and building and poor awareness of BIM benefits. This result implies that more work needs to be done among the professionals to promote BIM application in the construction phase. The professional body needs to organise seminars, conferences and workshops to elevate its members’ spirit towards BIM application.
The limitation of this study is the single primary data collection approach used in this study, using a questionnaire-based survey could have the potential to induce mono-method bias. Even though the survey method is best suited for collecting data from a large sample of respondents in a systematic manner to enable statistical analysis, it is unable to probe respondents for their opinion regarding their choice of BIM barrier rating, unlike the interpretative approach using purposeful interviews. Nevertheless, the primary data variables, discussion and conclusions of the study are supported by previous studies, which involve comparing and explaining based on earlier research. Although a Likert scale survey is a universal means of gathering primary data from a wide group of individuals, different respondents may interpret each choice differently. Notwithstanding, it is one of the most widely used psychometric instruments for assessing self-reported views.
5.1 Future research
Researchers may investigate the area of BIM benefit: Knowing the benefit accruable with BIM implementation will help eliminate some of the critical barriers.
Also, researchers may investigate BIM capacity in the area of building production.

