This paper develops and empirically tests a novel big data analytic model to measure financial well-being (FWB) throughout the customer life cycle. The study uses a comprehensive, proprietary dataset that encompasses demographic and transactional data for nearly 430,000 clients across multiple financial products, approximating an “open finance” setting.
The model combines objective indicators of financial behavior with subjective measures of perceived well-being into a composite, customer-level index. To ensure robustness and practical relevance, the model was refined using feedback from nearly one hundred industry experts and validated through extensive sensitivity analyses. Furthermore, the composite index is closely aligned with independent and nationally representative studies conducted by the Development Bank of Latin America and the Caribbean (CAF), which highlights its external validity.
The study shows that the big data analytics model can capture the main features of the proposed conceptual model for measuring FWB at different stages of life. The model produces data-driven analytical weight loads that reflect most of the implications of the lifecycle consumption theory. The results validate the analytical model's suitability to be scaled and implemented in an open finance setting.
By providing a scalable, actionable, and empirically validated tool, this research contributes to the literature on FWB measurement and offers financial institutions and consumers the ability to continuously monitor their financial health, while accommodating AI-driven recommendations tailored to improve well-being.
1. Introduction
The measurement of financial well-being (FWB) remains constrained by the predominance of self-reported surveys and the limited use of rich transactional and behavioral financial data. Although financial inclusion has expanded considerably, its effect on FWB remains unresolved (Bruggen et al., 2017; Cardenas et al., 2021; CFPB, 2015b; Shim et al., 2009). Part of the difficulty lies in measurement itself. Most existing approaches rely heavily on subjective perceptions, even though FWB is shaped not only by how people feel about their finances, but also by how they manage money, accumulate assets, service debt, and cope with risk. This limitation becomes more evident in the context of open finance, where transactional data and inter-institutional information flows make it possible to observe financial behavior with greater breadth and precision.
FWB is commonly defined as a state in which individuals are able to meet financial obligations, feel secure about their financial future, and make choices that allow them to enjoy life (CFPB, 2015a; Kempson et al., 2017). This definition has been influential, but its empirical implementation remains uneven. Much of the literature still measures FWB through survey-based instruments, despite recognition that the construct is multidimensional and cannot be fully inferred from perceptions alone. Recent studies combine subjective and objective information. Comerton-Forde et al. (2022) show that self-reported and bank-record measures capture related but distinct dimensions of FWB. Gladstone et al. (2020) use banking data to study the objective correlates of perceived well-being. Parker et al. (2016) propose a framework built around spending, debt, planning, and savings. Khashadourian and Harrison (2024) likewise find that survey-based and account-based measures are correlated but not interchangeable. Yet these studies still rely on relatively small samples, narrower data environments, or settings that are difficult to scale.
This paper develops and tests a big-data analytical model to measure FWB at the individual level by integrating transactional, demographic, and survey-based information within a single framework. Using a proprietary dataset of more than 430,000 customers from a financial institution, we construct high-resolution proxies for seven dimensions of financial behavior and perception. The data environment approximates an open-finance setting because it captures a broad financial footprint that goes beyond isolated product relationships, allowing a more complete view of customers' financial conditions.
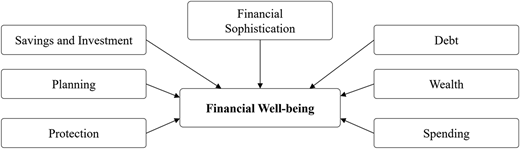
The proposed Financial Well-being Indicator (FWI) combines objective and subjective components and is estimated separately across life-cycle stages. The model is organized around seven dimensions: planning, wealth, spending, financial sophistication, debt, savings, and protection. This structure captures differences in financial priorities across age groups while preserving a design that is tractable for large-scale implementation. The results show that the model yields stable and robust measures of FWB, with patterns consistent with life-cycle theory but also revealing departures associated with real-world financial frictions.
By combining large-scale transactional information with survey data, this study contributes to the literature by offering a scalable and empirically grounded framework for measuring FWB in a setting that approximates an open-finance ecosystem. More broadly, it connects financial behavior, perceptions, and life-cycle dynamics in a unified empirical setting, while offering institutions and fintech firms a tool for continuous assessment of customers' financial conditions.
The remainder of this paper is organized as follows: Section 2 reviews the literature on FWB and the theoretical framework. Section 3 describes the methodology, detailing the data, defined variables, and model. Section 4 presents the results; finally, Section 5 and 6 summarize the discussion and findings, respectively.
2. Literature review
2.1 Conceptual framework
FWB focusses primarily on an individual's ability to manage expenses, maintain financial control and feel secure about their current and future finances (CFPB, 2015a; Kempson et al., 2017). Joo (2008) defines FWB as a multidimensional construct that includes satisfaction with one's financial situation, the objective state of finances, financial attitudes, and financial behaviors. Bruggen et al. (2017) emphasize that FWB depends on people's perceptions of current and expected desired living standards and financial freedom. Netemeyer et al. (2018) examined the interplay between daily stress management and long-term financial security as critical dimensions of FWB. Similarly, Prawitz et al. (2006) highlight the role of stress, satisfaction, and the ability to manage regular and unexpected expenses. However, it is challenging to determine the relative contribution of each component (Haisken-DeNew et al., 2019).
Currently, one of the most widely used definitions is that of the CFPB. The CFPB defines FWB as one's control over daily and month-to-month finances, absorbing financial shocks, staying on track to meet financial goals, and experiencing financial freedom (CFPB, 2015b).
2.2 Theoretical framework
To develop the proposed model, seven dimensions of people's finances are selected: planning, wealth, spending, financial sophistication, debt, savings, and protection. This choice rests on well-grounded theoretical and empirical literature. First, the life cycle view of household decisions implies saving during working years, wealth accumulation in midlife, and decumulation in retirement. These patterns map into the savings–wealth–spending–debt block proposed in this study, while behavioral and market frictions documented by household finance explain persistent deviations from frictionless models (e.g. liquidity constraints, contract complexity, and biased choices) that shape observed indebtedness and consumption paths (Agarwal et al., 2017). Empirical evidence confirms that FWB varies across the life cycle. García Mata (2024) shows that financial stress follows a quadratic age profile in Mexico, peaking in midlife and declining thereafter, reinforcing the need to capture age-related heterogeneity in savings, wealth, spending, and debt.
Second, contemporary frameworks conceptualize FWB as multidimensional, combining objective conditions and subjective evaluations, and embedded in personal and contextual factors. Service and consumer research defines FWB as the ability to sustain one's living standard, and organizes antecedents in behaviors, personal factors, and context. This supports the inclusion of behavioral constructs (spending, saving, debt) and resources (wealth, protection) alongside capabilities (planning, sophistication) (Brüggen et al., 2017) in this research.
Complementarily, validated measurement work distinguishes current money management stress and expected future financial security, motivating the integration of subjective components with transactional/behavioral data in the researchers' index (Netemeyer et al., 2018).
Recent studies also emphasize the role of individual mediators in the FWB process. Naveed and Ali (2024) conclude that financial literacy improves FWB through the mediating effect of risk tolerance, underscoring how behavioral and attitudinal factors condition the link between capabilities and outcomes. At the same time, evidence on contextual and institutional factors highlights that market conditions, such as information transparency, can also enhance FWB by fostering trust, financial self-efficacy, and risk tolerance (Naveed et al., 2021).
Third, the literature on financial wellness and financial capability highlights planning and financial sophistication as core enablers of FWB. Financial wellness is explicitly multidimensional, encompassing satisfaction, objective financial status, attitudes, and behaviors. The ability to plan, budget, compare financial products, and use digital channels informs the effective use of financial instruments, saving discipline, and spending control, with direct effects on perceived FWB and satisfaction (Joo, 2008; Kempson et al., 2017). Studies with both young and adult populations reveal that budgeting, saving, and credit management are positively associated with FWB, reinforcing the centrality of these behaviors in the construct (Gutter and Copur, 2011). Finally, protection mechanisms contribute to financial security and subjective well-being, particularly in later life, linking stability and security to higher satisfaction and lower stress (Gerrans et al., 2014; Bowman et al., 2017; Kempson et al., 2017).
2.3 Measures of financial well-being
FWB is complex and cannot be reflected by a single indicator. Instead, it is often conceptualized as a latent or unobserved variable measured indirectly. In the existing literature, FWB is typically measured using three approaches: objective measures (based on observable data and financial ratios), subjective measures (derived from surveys about individuals' perceptions of their financial situation), and combined measures, which integrate both subjective and objective components to provide a more comprehensive understanding of FWB. A comprehensive review by Singh and Malik (2022) highlights that in the past 25 years, subjective measures have dominated the FWB literature (81.4%). In contrast, objective measures were used only in 4.9% of these studies.
The CFPB developed a 10-item instrument to evaluate an individual's FWB (CFPB, 2015b). This scale has been widely adopted in subsequent research (Coats and Bajtelsmit, 2024; Collins and Urban, 2021; Khashadourian and Harrison, 2024), although some studies have modified or expanded its questions (Muir et al., 2017; Comerton-Forde et al., 2022). Applications of this scale often focus on capturing perceptions of financial security, control, and satisfaction (e.g. Mahdzan et al., 2020; Yang et al., 2024).
Objective measures, in contrast, rely on observable data. A pioneering contribution by Griffith (1985) proposed 16 indicators to assess household FWB, including savings, expenses, asset allocation, credit, liquidity, and tax management. Subsequent work expanded on these ratios, providing additional insights into financial behavior and resilience. In addition, Greninger et al. (1996) developed a framework with 22 financial ratios on areas such as liquidity, solvency, indebtedness, and inflation protection. Similarly, Delafrooz et al. (2010) presented metrics, in particular creditworthiness, emergency funds, allocation of monthly credit cards, loan payments, and retirement preparation, as objective indicators of FWB.
Parker et al. (2016) suggest a framework for measuring FWB based on four components (saving, debt, planning, and spending) with two variables per component. However, their study remains theoretical as they neither implement nor test the proposed framework.
The analysis of both approaches in the literature remains limited. Porter and Garman (1992) find that FWB is multidimensional and cannot be captured by income or net worth alone. They conclude that a valid measure must combine objective indicators (e.g. income, assets, debts) with subjective evaluations (e.g. perceived security, satisfaction, stress about finances). Monetary variables are necessary components of any FWB index, yet subjective perceptions add essential explanatory power; thus, a hybrid (objective + subjective) approach is recommended.
Tenney and Kalenkoski (2017) analyze how subjective perceptions of FWB compare with objective measures among individuals aged 50 and above in the United States (US). However, the correlations are modest, implying that planners and researchers should not rely on ratios alone to judge older adults' FWB; perceptions capture additional, nonfinancial factors. Comerton-Forde et al. (2022, 2018) constructed an FWI by combining self-reported survey data with customer financial records from a large Australian bank. They found a correlation coefficient of 0.4 between subjective and objective indicators in a sample of over 5,000 individuals. Gladstone et al. (2020) explored the relationship between subjective and objective FWBs derived from respondents' bank account data. They found that subjective FWB is associated with objective financial indicators, including income, available liquidity, and overdraft usage, demonstrating a clear link between perceptions and actual financial behaviors. Khashadourian and Harrison (2024) test the relationship between the subjective FWI developed by the CFPB (2015b) and a set of financial ratios extracted from customers' bank accounts. They conclude that both sets of measures are not independent of each other. Thus, a composite subjective and objective measure should be used to determine the FWB.
Despite the strides made in measuring FWB, there is no consensus on which variables should be included in an objective FWI. The field remains dominated by subjective measures, particularly in developed countries, for example, the US, Canada, Germany, and Australia (Bashir and Qureshi, 2023). FWI based on objective transactional data, such as credit reports or account balances, remains limited (Castro Badillo et al., 2022; Comerton-Forde et al., 2022; Gladstone et al., 2020). Incorporating such data could provide a means of externally validating subjective measures, bridging the gap between perception and actual behaviors (Collins and Urban, 2021). This study aims to address these gaps by exploring objective measures and leveraging transactional data to develop a robust framework for evaluating FWB.
2.4 Open finance and FWB
Open finance places the consumer at the center of the financial industry, allowing it to securely share information, including banking, investment, and insurance data, across multiple providers in a standardized way. In doing so, open finance facilitates collaboration between banks, fintech companies, and insurers, enabling a more connected financial ecosystem while also providing a new way to measure FWB, moving beyond traditional surveys that rely on self-reported data. Open finance could use data from multiple financial sources to provide a more comprehensive view of FWB (Bukovski et al., 2025). An open finance ecosystem enables a more accurate and dynamic measurement of FWB than traditional financial systems, which typically rely on siloed, institution-specific data and widely used survey-based approaches, thereby restricting a holistic view of customer financial data (Table 1).
Based on current evidence, no studies exist that measure FWB in an open finance ecosystem, as the implementation of open finance around the world is still in its infancy. The present study is the first attempt to measure FWB in a setting that approximates an open finance ecosystem.
This study argues that the data obtained approximate an open finance setting, as the dataset spans the core balance-sheet and cash-flow dimensions that open finance would expose, liquidity (deposits, flows), solvency/leverage (debts, credit limits, collateralized loans, leasing), asset buffers (financial and real assets), earning capacity (payroll inflows, recurring income), risk/price signals (credit scores, rates, insurance uptake), and repayment behavior (delinquency, cures, roll rates). The data used belong to one of the largest multi-banks in Latin America, which intermediates a wide set of payment rails, aggregates inflows and outflows from other institutions, and ingests credit bureau and insurance data from multiple sources, yielding visibility beyond “single-bank” relationships and closely mirroring the account- or product-level granularity of an open finance feed, making this a credible “as-if open finance” environment for estimating FWB at scale.
3. Method
3.1 Research design
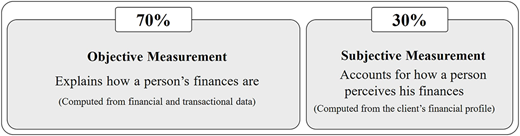
This study adopts a quantitative, confirmatory research design to construct a multidimensional FWB Index (FWI) at the individual level. To complement these objective indicators, subjective measures from a structured client survey are incorporated. The FWI follows a hierarchical structure: seven dimensions of financial behavior are first measured and aggregated into sub-indices. These are then combined into a composite indicator using principal component analysis (PCA), with 70% weight assigned to objective components and 30% to subjective measures. To account for life cycle heterogeneity, the model is estimated separately for five age groups, enhancing its relevance across different financial stages.
The empirical analysis relies on a unique dataset provided by one of the largest banks in Latin America, which integrates multiple sources of information at the customer level. The database covers 432,695 individual clients, consolidating over 50 million records of financial products and transactions. The observation window spans from September 2018 to August 2020, ensuring both cross-sectional coverage and temporal consistency.
The dataset combines (1) administrative records of savings and credit products (balances, maturities, interest rates, and repayment behavior), (2) transactional data on inflows and outflows from checking and savings accounts, (3) credit bureau reports capturing debt exposure and repayment history across the formal financial system, and (4) tax filings providing verified information on income and wealth. Together, these sources enable a comprehensive view of the financial situation of each customer. To complement objective measures, a survey module on subjective FWB, which includes perception-based items such as self-assessed ability to meet expenses, perceived resilience to shocks, and satisfaction with financial management, is also integrated.
The gender distribution is balanced, enabling comparisons between male and female customers. Income information from customer records is used to normalize variables across income levels. The dataset underwent extensive cleaning and adjustments, including handling outliers.
The construction of the FWI combines objective and subjective measures to capture the multidimensional nature of the FWB. The literature on measuring FWB recognizes that both subjective and objective measures account for different dimensions of FWB, prioritizing objective dimensions (what people are able to do and be) while recognizing that subjective perceptions (agency, satisfaction) are complementary. Based on the literature review, no other studies exist that aim at estimating an FWI as the combination of objective and subjective components, as the present study does. Accordingly, it is reasonable to overweight the objective component and underweight the subjective one.
No weighting system is above criticism, and no consensus has been reached on the best way to assign weights in composite indexes (Greco et al., 2019). Thus, 70% of weight is assigned to the objective component in the index, whereas the subjective component accounts for 30%. The rationale is that subjective measures although valuable, are less stable and less comparable across individuals and contexts. From a psychometric standpoint, relying solely on self-reports reduces external validity. Therefore, assigning greater weight to objective measures and a smaller weight to subjective ones is a reasonable methodological compromise: it mitigates perceptual bias while still incorporating the experiential dimension of FWB.
This weighting scheme balances hard evidence with lived experience, avoiding the extremes of a purely objective accounting exercise and a purely subjective measure that is overly sensitive to transitory perceptions, balancing the relative importance of observed financial behaviors and self-reported perceptions and providing a more comprehensive perspective on well-being (Comerton-Forde et al., 2022; Kempson et al., 2017). Furthermore, since the objective and subjective measures are estimated independently, each measure can always be recovered and presented independently as an individual FWI. Figure 1 illustrates the relative contribution of objective (70%) and subjective (30%) components in the composite index.
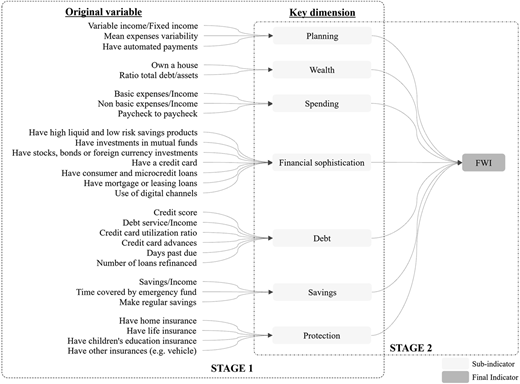
The dimensions of the model are grounded in established frameworks in the FWB literature (Agarwal et al., 2017; Netemeyer et al., 2018; Kempson et al., 2017). In this study, seven key dimensions are identified and operationalized through multiple indicators (Figure 2, Table 2), with the integration of transactional data providing a granular view of financial behavior.
Financial sophistication is reflected in the management of multiple financial products (i.e. savings accounts, credit cards, mortgages, investments), as well as in the use of digital channels for transactions. This dimension captures the ability to navigate increasingly complex financial environments, which is recognized in the literature as an essential element of financial capability in the digital age (Bruggen et al., 2017).
Savings and investments play a central role in providing a buffer against unexpected events and in achieving long-term goals. Savings strengthen resilience and improve subjective perceptions of FWB (Comerton-Forde et al., 2022).
Spending is measured through patterns of essential and discretionary expenses relative to income. Prior studies link spending control to higher FWB and lower financial stress (Netemeyer et al., 2018).
Debt is assessed through indicators, including credit utilization, overdue payments, refinancing, and credit bureau scores. Healthy debt levels are associated with stronger FWB, while excessive indebtedness can undermine stability (Kempson et al., 2017).
Planning is evaluated through proxies such as automated payments and variability in expenditures, which suggest budgeting capacity and foresight in financial management. The literature highlights financial planning as a mechanism for maintaining control and reducing uncertainty (Gutter and Copur, 2011; Netemeyer et al., 2018).
Protection is measured using insurance products that provide security against unforeseen events. Access to insurance has been shown to increase confidence in the financial future (Parker et al., 2016).
Wealth represents financial security and long-term stability, particularly relevant in later life stages. Asset accumulation is consistently linked to higher levels of FWB and protection against vulnerabilities (Gerrans et al., 2014).
3.1.1 Subjective financial well-being
The subjective component of the FWI was developed from survey data collected from a representative subsample of 400 clients, drawn from the same population used to construct the objective model. The instrument included 18 items structured into three latent dimensions: perceived financial control, planning capacity, and satisfaction with financial life. These constructs were measured using Likert-type scales ranging from 4 to 6 points, depending on the item. Each response was linearly transformed into a 0–100 scale to ensure comparability and allow aggregation. The final subjective score was calculated as the simple arithmetic average across all items, without differential weighting. This subjective score represents a separate input into the FWI, contributing 30% of the final indicator. Figure 1 illustrates only the analytical architecture of the objective component; the subjective component is integrated ex post into the composite indicator through a weighted combination of both scores.
3.1.2 Financial well-being and life stages
Personal demographic characteristics influence FWB, which evolves with age, life stages, and major events (Kim et al., 2003; Muir et al., 2017). To reflect this dynamic, the FWI was estimated separately for five age groups defined according to national statistics, financial inclusion reports, and the life cycle model established by Modigliani and Brumberg (1954). These groups capture distinct financial realities: 18–25 (early financial experience, low income, reliance on family or loans); 26–35 (rising income, major debt, and housing decisions); 36–49 (peak earnings, but high financial pressure from children and mortgages); 50–64 (consolidation of savings, debt reduction, retirement preparation); and 65+ (management of retirement income, preservation of wealth, healthcare expenses). For each segment, the dimensional weights of the FWI were estimated independently using PCA, allowing the latent structure of the data to reflect age-specific financial behaviors. This approach avoids a one-size-fits-all model, ensuring that FWB is contextualized and analytically consistent across the life course.
3.2 Analytical procedure
3.2.1 Model construction
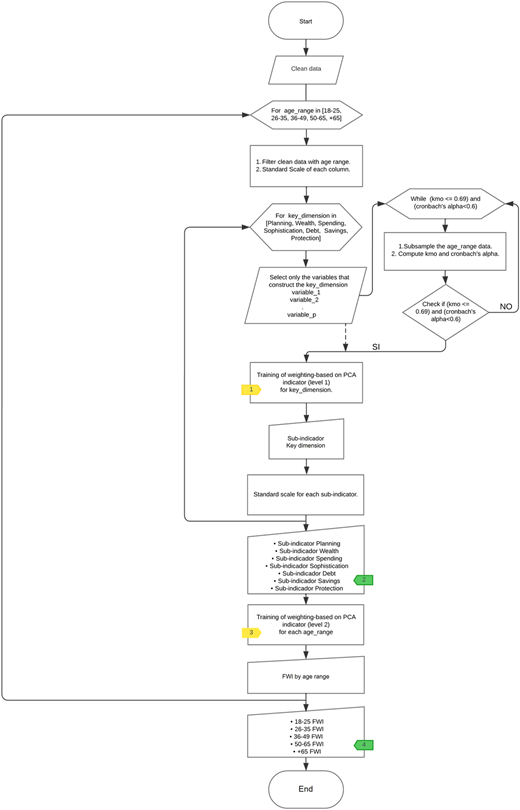
A two-stage hierarchical model was developed to measure FWB accurately, integrating data-driven sub-indicators into a composite measure. In the first stage, seven core sub-indicators were constructed, each representing a fundamental financial dimension: planning, wealth, spending, financial sophistication, debt, savings, and protection (see Stage 1 in Figure 3 and Tag 2 in Figure 4). Each sub-indicator was carefully defined based on behavioral and transactional characteristics that best represent the underlying dimension. To reduce dimensionality, each set of variables was condensed into a single latent component using PCA-based weighting methodology described in Section 3.2.3, ensuring that the most relevant financial information was retained while minimizing redundancy across variables. This approach has been applied to the development of financial fragility and stress indices in Latin American contexts (Cardona-Montoya et al., 2022), reinforcing the suitability of PCA for synthesizing multidimensional constructs of FWB. This first stage provided a robust representation of each financial dimension in a scale-ready format.
In the second stage, the seven sub-indicators were aggregated into a composite structure. Aggregation followed the same weighted scheme based on the PCA of the first stage, providing empirical evidence on the relative contribution of each core sub-indicator to overall FWB. Figure 3 illustrates the hierarchical organization of the indicator, while Figure 4 presents the FWI construction flow diagram, where Level 1 corresponds to the seven sub-indicators and Level 2 to the aggregate index.
3.2.2 Validation of factor structure
The analysis was carried out independently for each age group defined in the study. To guarantee statistical adequacy, the model required that each subsample meet specific thresholds: Kaiser-Meyer-Olkin (KMO) values ideally at 0.8 (minimum 0.69), Cronbach's alpha ≥ 0.6, and a significant Bartlett's sphericity test (p < 0.05). These criteria ensured sampling adequacy, internal consistency, and suitability for factor analysis. Since the overall dataset did not meet the statistical assumptions required for PCA, an iterative subsampling strategy was implemented within each age group to identify samples satisfying the adequacy criteria. Consequently, random subsamples were generated within each age group until the dataset met these validation thresholds. Once validated subsamples were obtained, the two-stage hierarchical model was estimated to construct the seven sub-indicators and derive the FWI.
3.2.3 Weighting and final indicator construction
The aggregation of sub-indicators into the composite FWI followed a PCA-based weighting methodology, consistent with the guidelines of the Joint Research Centre (2008, p. 90). In this approach, each financial dimension was modeled independently prior to integration. All sub-indicators were normalized by subtracting the mean and dividing by the standard deviation (z-score), generating scale-invariant inputs for the second-stage PCA procedure. The resulting normalized loadings were then used to construct the final FWI (see Figure 4, from Tag 2 onwards), reflecting the relative contribution of each dimension to overall FWB.
This methodology is not designed for feature selection; instead, it relies on carefully pre-selected input variables that accurately reflect each dimension of the FWB. By focusing on meaningful variables and ensuring that all factor loadings are positive, the procedure maximizes the information obtained while correcting for redundancy due to collinearity. This ensures that the resulting composite indicator is both theoretically sound and statistically robust.
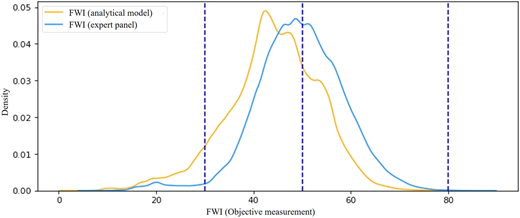
Finally, the FWI displayed strong performance, aligning closely with the weights assigned by the expert panel. The high non-parametric correlation (approximately 0.70) between the PCA-based and expert-based indices confirms that both approaches yield consistent and complementary assessments of FWB (see Figure 8).
3.2.4 Sub-sampling for robustness
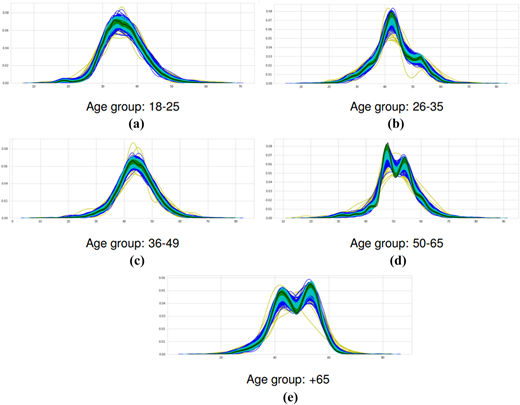
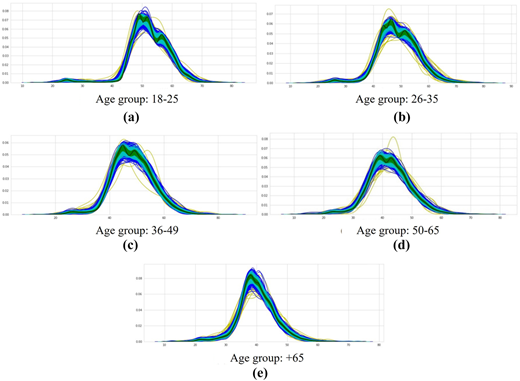
The hierarchical model was trained independently for each life cycle group. Within each group, random sub-samples of different sizes were drawn repeatedly (e.g. <500, 500–1,000, 2,000, and 10,000 observations). In total, 2,191 sub-samples per age group were analyzed, using fixed weights, to verify the stability of the indicator's density functions. Results confirmed that distributions maintained similar shapes across sub-samples of varying size, indicating structural consistency.
3.2.5 Statistical robustness tests
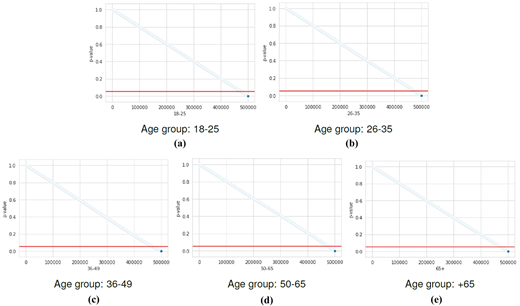
To further evaluate stability, a Mann-Whitney-Wilcoxon test was applied on 499,500 randomly selected pairs of sub-samples within each age group. In over 95% of cases, the null hypothesis of equal distributions could not be rejected, confirming the robustness of the index across re-samplings.
3.2.6 Expert panel validation
To complement the analytical model, a parallel exercise was conducted with an expert panel to determine the weights of the seven dimensions and their sub-indicators. The panel was composed of 96 professionals, including 5 public policy specialists, 12 academic researchers, and 79 financial advisors from the same institution for which the indicator was developed. The Budget Allocation Process was applied (Joint Research Centre, 2008), whereby each expert was asked to distribute a total of 100 points across the dimensions and their sub-components, according to their perceived relevance to FWB.
This exercise was conducted independently for each life cycle group, acknowledging that financial priorities vary systematically across stages of life. The weights derived from the expert panel were not used to adjust the PCA-based analytical model, nor did they enter the computation of the FWI. Instead, they served as an external reference to validate the conceptual structure of the indicator and assess the coherence between model-derived and expert-assigned importance across age segments. This validation process reinforced the construct validity and interpretability of the analytical framework, while preserving its empirical integrity.
4. Results
The two-tier hierarchical model was estimated independently for each age group, producing indices for the seven components of FWB. Figures 5 and 6 illustrate the robustness analysis through sub-sampling exercises across varying dataset sizes. In these figures, the colored curves represent sub-samples of different sizes, while the black curve corresponds to the full dataset. The close alignment between them shows that the indicator's density functions remain consistent regardless of the sample size. Despite differences in sample size, the distributions remain stable, with larger samples showing greater structural homogeneity. This provides strong empirical evidence of the indicator's consistency and reliability. Complementary robustness checks, including the Mann-Whitney-Wilcoxon test applied to nearly 500,000 random sub-sample pairs, confirm that in over 95% of cases the null hypothesis of equal distributions cannot be rejected (see Figure 7). These results show that the FWI is statistically robust and reliable, making it suitable for applications in both research and practice.
4.1 Analytical model and financial well-being across life stages
Table 3 presents the analytical model weights. The results show that financial priorities evolve as individuals move through different life stages, in ways that both reflect and extend life cycle theory. Planning emerges as central in early adulthood (26.04% for ages 18–25), when individuals face critical financial decisions with limited resources, but its relative weight declines as people transition into midlife. Wealth accumulation grows in importance in the pre-retirement years (22.69% for ages 50–64), reflecting active savings and investment, and later declines but remains essential for financial security in older age. Savings follow the expected pattern of life cycle theory: they are significant during income-generating years but become marginal in retirement (3.03% for 65+), when accumulated wealth is gradually spent down.
Spending starts at a moderate level in early adulthood (18.84% for ages 18–25) and rises steadily across the life course, reaching 28.30% in later life, consistent with the adjustment of consumption to maintain stability in retirement. Financial sophistication, defined as the ability to manage multiple financial products and channels, remains relatively stable across groups, peaking at 17.81% for ages 26–35 when exposure to financial decision-making is highest. Debt shows a fluctuating trajectory, with a notable increase in middle age (16.22% for ages 50–64). While life cycle theory assumes borrowing is concentrated in early years to smooth consumption, these results suggest that mortgages, education loans, and other obligations place heavier burdens in midlife than the theory anticipates. Finally, protection becomes increasingly relevant in older age (10.57% for 65+), reflecting modern financial needs such as health and life insurance, which are not explicitly reflected in the classical life cycle framework but are critical for financial security in retirement.
4.2 Model validation through expert panel
Table 4 reports the weights derived from the expert panel. The results show that spending is consistently ranked as the most important dimension across all age groups, especially in early adulthood when high expenses coincide with limited income. Savings were also emphasized as critical during income-earning stages, showing their role in building financial discipline and resilience. Debt peaked in the 26–35 group (19.3%), driven by mortgages and family expenses, but declined steadily as individuals aged. Wealth gained importance during peak earning years and became central approaching retirement, while protection grew in relevance later in life, indicating the increasing need for insurance and risk management. Financial sophistication was viewed as consistently relevant across the life cycle, confirming its role in navigating financial decisions at all stages.
Overall, the expert-based indicator aligns with the expected milestones of the financial life cycle and highlights the importance of spending and savings as central drivers of FWB. These results provide a meaningful benchmark against which the PCA-based analytical model can be compared.
4.3 The distribution of the financial well-being indicator
Figure 8 and Table 5 compare the distributional characteristics of the FWIs derived from the analytical model and the expert panel. Both density estimates exhibit a similar shape, yet the expert panel's distribution shifts slightly to the right, suggesting a more optimistic assessment of FWB. In these figures, the analytical model places the median individual at 44 points, while the expert-based index places the median closer to 49 points. Descriptive statistics confirm this: the expert-based index has a higher mean (49.48 vs. 44.06), slightly lower dispersion (9.03 vs. 9.50), and consistently higher percentiles across the distribution. These differences are largely driven by the distinct ranking and weighting of dimensions in the expert panel compared to the PCA-based model.
The correlation between the two indices is close to 0.70, indicating a strong but not perfect alignment. This level of correlation suggests that the two approaches capture a common underlying construct of FWB, while still reflecting different perspectives. The analytical model emphasizes systematic patterns aligned with life cycle theory, particularly the transitions from planning and saving in early and midlife to spending and protection in retirement. In contrast, the expert-based measure incorporates practitioners' perceptions of real-world financial pressures, such as heavier debt burdens in early adulthood and the growing role of insurance later in life.
4.4 Summary of findings
Taken together, the results indicate that the FWI is both statistically robust and substantively meaningful. The robustness checks confirm its stability across sub-samples and resampling techniques, while the analytical model reveals clear life cycle dynamics in financial priorities. The expert panel validation complements this by highlighting practical considerations drawn from policy and financial advice. Although the expert-based measure tends to produce slightly higher scores, both approaches show strong consistency, and their complementarities enhance confidence in the index. This dual validation underscores the potential of the FWI as a reliable tool for measuring FWB across the life course and for informing both academic research and applied decision-making.
5. Discussion
The life cycle theory of consumer spending (Modigliani and Brumberg, 1954) provides a useful starting point to interpret the results, predicting savings in early adulthood, accumulation of wealth in midlife, and dissaving in retirement. The analytical model presented here broadly aligns with these predictions: planning and saving are crucial in early and middle adulthood, wealth peaks before retirement, and spending becomes more relevant in later life. At the same time, the model reveals real-world complexities not explicitly addressed in the classical framework, such as the critical role of planning in early life, the persistent weight of debt during middle adulthood, and the growing importance of protection in retirement. These dimensions, highlighted in the literature as key components of FWB (Kempson et al., 2017; Netemeyer et al., 2018; Bruggen et al., 2017), enrich the traditional life cycle view by integrating behavioral and institutional aspects into the analysis.
The expert panel introduces a complementary perspective. Experts consistently prioritized spending across all age groups, particularly in early adulthood, a finding that aligns with the smoothing principle of life cycle theory but emphasizes immediate financial pressures more strongly than the analytical model. The panel also attributed a more consistent weight to savings throughout the working years, reflecting the professional perception that savings discipline is essential not only in midlife but across the entire financial trajectory. Similarly, experts emphasized the role of protection in older age, consistent with evidence that insurance and risk management mechanisms improve subjective and objective FWB (Parker et al., 2016; Gerrans et al., 2014). Taken together, these results underscore the value of combining empirical modeling with practitioner insights: while the analytical model captures structural patterns derived from transactional and survey data, the expert panel integrates contextual knowledge of clients' day-to-day constraints.
Overall, the life cycle theory posits that individuals aim to smooth consumption over their lifetime by saving during working years and dissaving in retirement. The analytical model supports this logic while introducing behavioral and institutional nuances, planning, debt, and protection, which extend the theory's explanatory scope. Conversely, expert judgments place greater emphasis on early-life spending and consistent savings, reflecting contemporary financial pressures and professional understanding of household behavior. Although not central in the original life cycle framework, the experts' focus on protection later in life highlights the increasing relevance of risk management and insurance for financial resilience and well-being.
5.1 Theoretical implications
The comparison between both approaches has several theoretical implications. First, it confirms that FWB is inherently multidimensional, encompassing both objective and subjective elements (Netemeyer et al., 2018; Comerton-Forde et al., 2022). Second, it shows that traditional models of consumption smoothing must be broadened to incorporate planning, financial sophistication, and protection, dimensions increasingly relevant in digital financial ecosystems (Bruggen et al., 2017). Third, it highlights how debt trajectories deviate from the standard life cycle framework: rather than being concentrated in early adulthood, debt peaks in midlife, reflecting structural pressures such as mortgages and education loans, a finding aligned with recent evidence on household vulnerability. In this sense, the FWI contributes to the literature by offering a more granular and behaviorally grounded measurement of FWB that captures both canonical patterns and emerging financial realities.
5.2 Managerial implications
The proposed FWI provides financial institutions and policymakers with a practical tool to identify vulnerable segments and design strategies that enhance resilience and long-term stability. For financial institutions, the index can be integrated into customer monitoring systems to tailor products and interventions across life stages. For younger clients (18–25), solutions that encourage planning and saving—such as automated saving apps or matched accounts—are key. For middle-aged clients (36–49), integrating credit management with long-term investment tools can strengthen wealth accumulation. For older adults (65+), products emphasizing protection and liquidity, including bundled insurance and low-volatility savings, support financial security in retirement.
Combining transactional data with subjective well-being measures enables a more comprehensive understanding of client needs and behaviors. Policymakers can use the index as a diagnostic instrument to monitor population-level financial health and guide inclusion strategies across life stages. However, successful implementation requires addressing data privacy, interoperability, and regulatory compliance. Ensuring secure data-sharing, informed consent, and adherence to protection standards is essential for deploying the FWI responsibly and effectively.
5.3 Limitations and future research
This study has several limitations that should be acknowledged. First, the data are drawn from a single financial institution, which may limit the generalizability of the results to a broader population. Second, while the expert panel adds valuable qualitative insights, its composition could introduce biases reflecting institutional or professional perspectives. Third, the model does not directly account for macroeconomic shocks or contextual factors, for example inflation, unemployment, or health crises, that may strongly affect FWB. Future research should therefore extend the analysis to multi-bank or national-level data, integrate macroeconomic variables, and explore the interaction between FWB, digital inclusion, and resilience to shocks. Moreover, comparative studies across countries could shed light on institutional differences and cultural factors influencing FWB.
Overall, the results show that the FWI is statistically robust, theoretically consistent, and practically relevant. By combining a data-driven analytical model with expert-based weights, the study bridges theory and practice, offering a comprehensive view of FWB across the life cycle. The index captures both canonical patterns predicted by life cycle theory and emerging dynamics, including the relevance of planning, debt management, and protection. This dual perspective provides a stronger foundation for both academic inquiry and managerial application, reinforcing the potential of the FWI to inform financial product design, public policy, and future research agendas.
6. Conclusions
This paper reveals how a big data analytic model can be developed to measure FWB using naturally occurring data within an open finance structure. Using a confidential dataset, an analytical model is constructed encompassing seven dimensions: planning, wealth, spending, financial sophistication, debt, saving, and protection.
Recognizing that FWB is dynamic and evolves throughout the life cycle, the model assigns different weights to each dimension by age. Estimating the model separately for age groups ensures that the FWI reflects the distinct financial priorities and challenges at each stage of life.
The analytical weights differ from those proposed by nearly one hundred experts surveyed on the importance of each dimension through the life cycle. The top three dimensions in the analytical model are planning, wealth, and spending, while experts prioritized spending, saving, and debt. This divergence highlights the complementarity between behavioral evidence and professional judgment in assessing FWB. The data-driven weights reflect observed behaviors and outcomes across the dataset, while the expert-derived weights capture normative and experiential perspectives on what should matter most. Together, they reveal the multidimensional and evolving nature of FWB, bridging empirical modeling with practitioner insight to inform financial design and policy.