

As the infrastructure and built environment sectors shift from traditional economic valuation towards more holistic approaches, projects are being designed, built and evaluated in new ways. An important emerging technique for the economic evaluation of projects is social value measurement. This paper sets out the foundations for the social value measurement techniques that underpin the methods and frameworks developed in central governments and by multilateral and international organisations and describes how these can be adapted to value the broader societal and environmental effects of infrastructure and built environment projects. The paper provides practical evidence of social value measurement in valuing heritage impacts for Stonehenge World Heritage Site as well as presenting a detailed account of the foundations of cost–benefit analysis as a tool for social value measurement and non-market valuation.
Notations
- k1,t
amount of capital used on the example in year t
- LS
life satisfaction
- l1,t
amount of labour used on the example project in year t
average income
- mi
individual i’s income
- pg,t
price of input factors in year t, where g = k or l
- pz,t
price of good z in time t, where z = 1,2
- SWF
social welfare function
- U(xz,i)
cardinal utility function for consumption of x z,i
- WTPi
individual i’s willingness to pay
- xz,i,t
amount of good z individual i consumes in year t
- βq
effect of q on life satisfaction, where q = ln(m) or good x
average marginal utility of income
- λi
marginal utility of income for individual i
- λt
marginal utility of income in year t
- λ0
first period marginal utility of income
- ρ
pure time preference
1 Introduction
Social value measurement (SVM) is a rapidly emerging field of economic analysis, driven by the Public Services (Social Value) Act 2012 in the UK as well as related international and global initiatives such as the Organisation for Economic Co-operation and Development (OECD) Inclusive Growth Initiative, the UN 2030 Agenda for Sustainable Development and the UN Sustainable Development Goals. In recent years, governments and international organisations have started to place greater emphasis on social value. As a result, spending within the infrastructure and built environment sectors is facing increasing levels of scrutiny, particularly concerning the wider societal benefits that projects provide beyond the traditional metric of gross domestic product growth. There is a growing expectation that project appraisals evaluate and optimise wider societal impacts, that these appraisals are embedded in decision making and that projects deliver improved quality of life outcomes for all.
This paper presents a best-practice framework for measuring social value that can be applied to the appraisal of infrastructure and built environment projects. This framework outlines SVM, focusing on the application of cost–benefit analysis (CBA) and incorporating various methods of non-market valuation. It is the result of decades of academic work, and it sets out methodologies that are endorsed by the UK government (HM Treasury, 2020) and the OECD (Atkinson et al., 2018) among other public organisations.
Despite the governmental endorsement of these methodologies, approaches to SVM in the infrastructure sector continue to lack consistency, leading to difficulties in communicating and delivering social value (Raiden et al., 2019). While there have been several private sector initiatives that have tried to address the gap in SVM, these remain largely at a subsector level and are not consistently applied throughout the infrastructure and built environment sector. For example, the UK rail industry, through its Rail Safety and Standards Board (RSSB), has developed the Common Social Impact Framework (CSIF) to plan, measure, report and, in some instances, value the impact of activities underway or delivered. Additionally, the private building sector has recently launched the National Themes, Outcomes and Measures (TOMs) framework that establishes the minimum standard to account for social value on real estate projects during design, construction and operation phases. However, neither framework provides a clear interpretation of social value or consistent approach to quantitively assessing it.
The purpose and contribution of this paper is to set out a best-practice framework for the infrastructure and built environment sectors, providing a practical example of how the framework can be applied, as well as recommendations for ensuring the consistent inclusion of social value in infrastructure and built environment projects in practice. It starts with a rigorous definition of social value and SVM as set out in Section 2.
In Section 3, the paper describes approaches to non-market valuation. Following this, the paper introduces a real-world example of the framework in practice in Section 4, outlines the adopted methodology in Section 5 and presents the results of adopting the framework in Section 6. Section 7 discusses the results and limitations of the framework, and Section 8 concludes, featuring recommendations for the infrastructure and built environment sectors. A technical appendix sets out in detail the foundations of CBA as a tool for SVM and non-market valuation.
2 Social value measurement
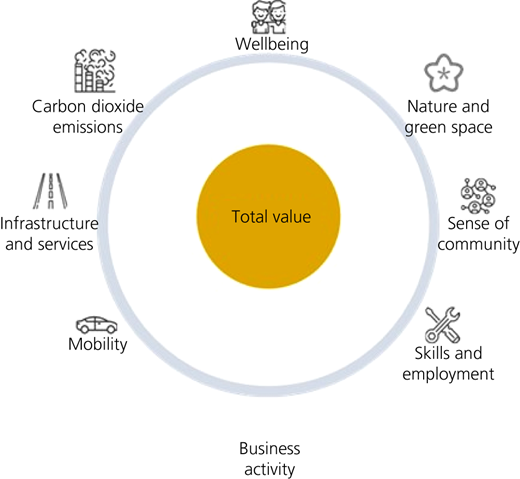
Social value requires a comprehensive assessment of economic, environmental and social impact (Cabinet Office, 2012), as displayed in Figure 1. Impact across these domains must be measured for all key stakeholder groups, including individuals, businesses, government and the environment. Below, the exact definitions of social value and SVM are outlined.
2.1 What is social value?
Social value, as set out by the UK government (HM Treasury, 2020), refers to the value of the net impact that a policy, organisation or project (‘project’ is subsequently used as a catch-all term throughout) has on the wellbeing of people in society. These terms are defined in more detail as follows; prioritising ‘wellbeing’ due to its fundamental role in understanding the subsequent terminology.
2.2 Wellbeing
The term ‘wellbeing’ is used to describe what is ultimately good for a person and is a measure of how well a person’s life is going. There are three broad philosophical theories of wellbeing (adapted from Parfit (1984)).
Preference accounts of wellbeing state that wellbeing consists of the satisfaction of our preferences – that is, getting what we want. The more that we get of what we want, the higher our wellbeing is.
Mental state theories state that wellbeing consists of pleasure – that is, a person with a very high level of wellbeing has considerable pleasure and little pain. This is often measured using subjective ratings such as how happy an individual is.
Objective list theories state that wellbeing is made up of a list of items that are assumed to be intrinsically good for a person. These lists often include things like happiness, relationships, health and freedom.
Each of these theories has different merits and can be used for SVM. However, the UK government recommends as part of the economic appraisal process that analysts define wellbeing using a preference approach – captured through how much people are willing to pay for a project – or using a mental state approach – captured through the Office for National Statistics’ life satisfaction measure (e.g. overall, how satisfied are you with your life nowadays (on a scale of 0 to 10, where 0 is ‘not at all’ and 10 is ‘completely’)).
2.3 Society
It should be noted that ‘social value’ is not equivalent to ‘social impact’. Typically, issues like health deprivation and crime are viewed as ‘social impacts’, with GDP growth rates and inflation viewed as ‘economic impacts’ and climate change and loss of biodiversity viewed as ‘environmental impacts’. Social value captures all types of impact – impacts on the economy, the environment and society more widely because they all affect the wellbeing of all the people in society. ‘Society’, in the context of social value, refers to the population of people whose wellbeing is being affected. For the UK government, for example, this refers to all UK residents. For international and intergovernmental organisations such as the OECD, this may refer to all the people in the world and may also include impacts on organisations themselves.
2.4 Net impact
Social value captures the ‘net impact’ of a project. This refers to the impact on wellbeing over and above what would have happened if the project had not gone ahead – that is, the ‘business as usual’ scenario, also referred to as the ‘counterfactual’. This requires the ‘opportunity cost’ of the resources used on the project to be established. The opportunity cost captures the impact on wellbeing that the resources would have had if they had been used to deliver the next best alternative. For example, the capital and labour spent on a construction project to produce a hospital might have instead been spent on another project to produce an office block. Evaluators must establish the difference (the ‘delta’) between the potential wellbeing impact of the office block compared to the wellbeing impact of the hospital, thereby determining the net wellbeing impact.
2.5 Value
If possible, net impacts are measured in a common unit of wellbeing (often £s – representing how much people’s preferences have been met, but other measures such as quality adjusted life years (QALYs) or subjective ratings of happiness are also used). This measure represents the relative ‘value’ of the net impacts compared to the counterfactual. For example, suppose that the value of the net impact of project A is £2 million. As the value is positive, the project has a greater wellbeing impact compared with the counterfactual use of the resources. Furthermore, suppose another project, project B, had a value of £1 million. This means that project A has twice the wellbeing impact of project B.
2.6 What is social value measurement?
SVM is the practice of assessing the extent to which an intervention or project delivers social value. CBA is the preferred approach in the public sector (HM Treasury, 2020) and is endorsed by international organisations including the OECD (Atkinson et al., 2018) and the European Union (European Commission, 2014).
By comparing the monetised costs with the monetised benefits of a project, CBA can be used to produce either (a) a net benefit figure or (b) a benefit–cost ratio (BCR).
The net benefit figure informs the decision maker of the extent to which the project, or options within the project, improves wellbeing more than the business-as-usual alternative use of the project’s resources (its social value). The higher the net benefit, the greater the improvement in wellbeing. A net benefit greater than zero means that the project provides more wellbeing compared to the next best alternative.
The BCR informs the decision maker of the most efficient way to improve wellbeing. The higher the BCR, the greater the improvement in wellbeing per £ of cost. A BCR greater than one means that the project provides more wellbeing compared to the next best alternative use of project resources (the costs).
In general, to measure social value using a CBA approach, evaluators follow the steps below (adapted from Boardman et al. (2017)).
Catalogue impacts and select measurement indicators by engaging stakeholders and exploring all relevant resources.
Predict impacts quantitatively using all available evidence, recognising positive and negative changes as well as those that are intended and unintended.
Value (monetise) all impacts, both financial and non-financial, using the recommended valuation techniques. These represent the social value of different outcomes, based on how they affect the stakeholders’ wellbeing.
Compute the net benefit figure (also known as the net present value of the project) and the BCR. Perform sensitivity analysis and make a recommendation, demonstrating the basis on which the analysis may be considered accurate and honest, clearly presenting all findings. Analysts should also ensure appropriate independent assurance.
Broadly speaking, CBA captures two types of impact: financial and non-financial.
Financial impacts are outcomes that have a direct impact on finances, market goods and cash. These include impacts on people’s income, goods and services sold in markets, government revenue and business revenues.
Non-financial impacts are impacts on society that do not have a market price but are nonetheless important. These include impacts on people’s education and health, crime rates, environment and pollution, heritage and culture, community pride and cohesion and social capital.
Given that the majority of the social value created by large infrastructure and built environment projects will be due to non-financial impacts, social value methodologies have predominantly focused on developing methods for valuing these types of impacts. Within the globally endorsed guidelines, there are three accepted approaches for valuing non-financial impacts: revealed preference, stated preference and subjective wellbeing valuation methods (Atkinson et al., 2018; HM Treasury, 2020). These are discussed in greater detail in Section 3.
When applying these three valuation methods, costs and benefits are estimated at the individual or household level. To understand the full social value, therefore, values need to be aggregated by the number of individuals or households affected by the project and also by the duration of the project. Once aggregated, benefits and costs are then discounted to present value terms. This accounts for the time value of money – benefits and costs are worth less in the future than in present years. This is crucial to assessing sustainability impacts of large infrastructure projects that can have a project life cycle that spans many years.
Two different approaches can be applied depending on whether a net benefit figure or a BCR is being produced. The net benefit figure is calculated as the discounted aggregated benefits minus the discounted aggregated costs. The BCR is calculated as the ratio of the discounted aggregated benefits to the discounted aggregated costs.
2.7 Other approaches to social value measurement
Other approaches for measuring social value exist and can be applied in specific circumstances. In practice, these approaches follow similar steps to CBA but they tend to be less comprehensive and more easily completed. Figure 2 illustrates the main approaches to SVM. These include cost-effectiveness analysis (CEA), cost-utility analysis (CUA), multi-criteria analysis (MCA) and social return on investment (SROI). CEA and CUA, like CBA, also have a long history in research, policy making and academia (Drummond et al., 2015; Levin and McEwan, 2000).
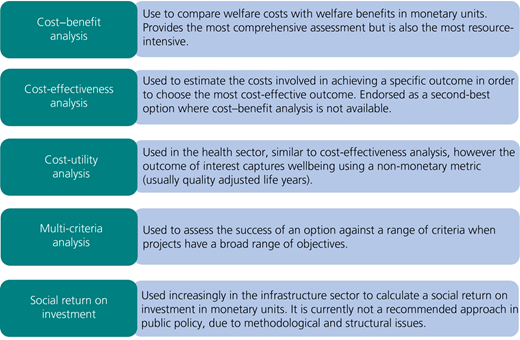
Although use of SROI is growing in the infrastructure and built environment sectors, it is not considered the best practice in the public sector, nor in academia. This is because it does not define social value in a consistently measurable way, such as impacts on people’s wellbeing or quality of life (Fujiwara, 2015). There are also other issues, such as lack of rigour in statistical techniques (Maier et al., 2015).
3 Valuation of non-financial impacts
Non-financial impacts (non-market goods), such as air pollution and social cohesion, do not have immediate monetary values, making it difficult to value their impact on wellbeing. The three key methods for understanding the social value of non-financial impacts are revealed preference, stated preference, and subjective wellbeing valuation methods, as summarised in Figure 3.
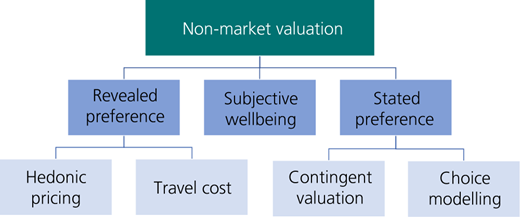
Each of these three methods provide the estimated wellbeing impact in a monetary unit (£). The £ value of a non-market good represents the amount of money that would have the same impact on wellbeing as the non-market good. To estimate this £ value, revealed and stated preference approaches calculate how much individuals are willing to pay for a good. Subjective wellbeing valuation methods compare a) how a good affects subjective ratings of wellbeing with b) how money affects the subjective ratings of wellbeing.
3.1 Revealed preference methods
When applying revealed preference methods, values are estimated using evidence from observed market behaviour (Champ et al., 2003). There are two main revealed preference methods, both of which have relevance for infrastructure and built environment projects.
Hedonic pricing: estimates the use value of non-market goods by analysing how it affects prices for related market goods (e.g. estimating the value of a local school by analysing local house prices) – that is, how it affects people’s willingness to pay for related goods.
Travel cost method: estimates the use value of non-market goods (e.g. community land used for recreation), by analysing how much individuals actually pay to access them using travel costs and the opportunity cost of time.
3.2 Stated preference methods
When applying stated preference methods, values are estimated using primary surveys in which respondents state their willingness to pay for a non-market good, either explicitly or implicitly (Champ et al., 2003). There are two main stated preference methods, both of which are highly relevant for infrastructure and built environment projects.
Contingent valuation method: estimates value using surveys that directly ask how much the respondents would be willing to pay or accept for a positive or negative change in the provision of a non-market good.
Discrete choice experiment: estimates value using surveys that ask respondents to make choices between bundles of different attributes of a good (e.g. for estimating the value of office space attributes, this could be the workplace aesthetic, temperature, ventilation and lighting). One of the attributes within the bundle will always be price (or another monetary good). By analysing the trade-offs between price and the other attributes, analysts can estimate the amount the respondents are implicitly willing to pay for each attribute.
3.3 Subjective wellbeing valuation
Subjective wellbeing valuation uses the same principles as revealed and stated preference techniques but with different data. This method typically uses self-reported life satisfaction as the measure of wellbeing. It first establishes how a non-market good affects life satisfaction and then compares this with how income affects life satisfaction to estimate a monetary equivalent (Fujiwara, 2013).
4 Case study: the A303 Amesbury to Berwick Down project
An application of the above framework is presented in the subsequent sections, beginning with relevant background information to the A303 Amesbury to Berwick Down project. Following this, the methodological approach is outlined, and the results are presented and discussed.
Stonehenge World Heritage Site (WHS), a prehistoric monument in Wiltshire, is one of the UK’s most famous landmarks. The A303 road currently intrudes on Stonehenge WHS, cutting through historic features such as the Stonehenge Avenue. The UK government has committed to improving the A303 between Amesbury and Berwick Down and, in doing so, reducing the negative impact of the road on the setting of Stonehenge.
Highways England considered several options that would divert the A303 away from the Stonehenge monument, based on two main engineering solutions: a tunnel or a bypass. The tunnel would be approximately 3.3 km in length and pass the Stonehenge stones, while the bypass would take the A303 north of Winterbourne Stoke with a viaduct over the River Till Valley. This case study sets out the steps that were taken to conduct CBA for the business case for this project, capturing the wider societal, cultural and heritage impacts in the overall valuation and BCR.
5 Methodological approach
CBA was conducted to measure the impacts of the A303 road restructure, as compared to the current location and state of the road. The four-step CBA process outlined in Section 2 was followed – these stages are summarised in Figure 4 and detailed below.

5.1 Step 1: catalogue impacts and select measurement indicators
Analysts at Simetrica-Jacobs evaluated the impact of the A303 project on a wide range of outcomes and determined that the following may be significantly affected.
Wider economic impacts: productivity gains for local businesses and changes in employment and output.
Business user, commuting and other user benefits: reduced travel times and vehicle operating costs for commuters, business users and other users.
Accidents: reduced number of accidents and casualties due to a better road network.
Air quality: changes in tonnes of nitrogen oxides (NOx) and concentrations of particulate matter smaller than 10 µm (PM10).
Noise levels: reductions in traffic noise levels, particularly in Winterbourne Stoke and the tunnelled section of the WHS. However, due to traffic rerouting, noise was expected to increase in Amesbury.
Greenhouse gas emissions: increased total tonnes of greenhouse gas emissions due to more journeys.
Heritage impacts: one of the key rationales for the project is to better preserve the historic Stonehenge WHS and increase enjoyment for those visiting it.
Indirect tax revenues: economic benefits gained by the government − for example, through greater fuel consumption.
5.2 Step 2: predict changes in indicators
Analysts followed the Department for Transport’s Transport Analysis Guidance (TAG; DfT, 2013) to predict the net impact of the project on the outcomes identified in Step 1. For more details on the specific methods used, see the relevant section of TAG.
5.3 Step 3: value (monetise) all impacts
Once changes in the outcomes (impacts) were predicted, analysts monetised these impacts using a range of methods. Wider economic impacts and the vehicle operating cost already have a market price, and their impacts are measured in £s directly. The remaining outcomes are non-market goods and required non-market valuation. For travel time savings, accidents, air quality impacts, noise impacts and greenhouse gas emissions, analysts used the previous valuation set out in the TAG Data Book.
To value heritage impacts, analysts at Simetrica-Jacobs conducted a bespoke contingent valuation study. The study administered surveys to elicit monetary values for a hypothetical change in noise, tranquillity, visual amenity and landscape severance within the Stonehenge WHS. Individuals were asked directly about their willingness to pay (WTP) (or willingness to accept (WTA) compensation) for a tunnel to replace the A303 road through the Stonehenge WHS:
‘What is the maximum you would be willing to pay per year, to support a tunnel route? This would be via an increase in your overall annual national taxes for the three-year construction period of the tunnel’.
The average WTP and WTA values were calculated for the new tunnel for individuals who visited the site, road users and the general population.
5.4 Step 4: compute the net present value
The impacts of the project were estimated for each year of the appraisal period, valued, discounted and aggregated.
To estimate the overall heritage value, the average WTP and WTA values for each population group (visitors, road users and the general population) were extrapolated from the respective survey samples up to the relevant proportions within the national levels of visitors, road users and the general population. The net value for each study group was calculated by subtracting aggregate WTA from aggregate WTP. This provided an aggregate population heritage value.
6 Results
6.1 Heritage impacts
Over 3500 people completed the survey that was administered as part of the contingent valuation study, which was used to establish a value for heritage impacts. Responses were composed of 432 visitors, 1001 local residents and 2102 individuals from the general population. Sample sizes were in line with existing UK government guidance on stated preference surveys, as provided by Pearce and Özdemiroglu (2002). WTP values were calculated for the new tunnel for individuals who visited the site, road users and the general population. Some respondents were not in favour of the tunnel scheme, and for them, they had a negative value for the new road layout with an average WTA of between −£51.90 and −£81.35. The average value per person is presented in Table 1.
6.2 Net present value
The final present values for the benefits and costs are summarised in Table 2.
Present value of the A303 scheme by benefit and cost component
| Benefit component | Present value: £millions, 2010 |
|---|---|
| Commuting user benefits | 12 |
| Other user benefits | 61 |
| Business user benefits | 179 |
| Indirect tax revenues | 87 |
| Accident benefits | 4 |
| Air quality | 0 |
| Noise | 0 |
| Greenhouse gas emissions | −86 |
| Travel time reliability | 61 |
| Wider economic impacts | 35 |
| Cultural heritage impacts | 955 |
| Total benefits | 1308 |
| Cost component | Present value: £millions, 2010 |
| Capital expenditure | 970 |
| Operating expenditure | 235 |
| Total costs | 1206 |
The cultural heritage impacts are calculated as outlined in Section 5. For example, for the visitor group:
sixty-seven per cent of the study group were willing to pay for the road scheme, while 0.5% were willing to accept compensation for the scheme
the average visitor WTP value was £23.39 (as shown in Table 1), and the average WTA was £187.50
these values were discounted and extrapolated to the relevant general populations; subtracting the WTA from the WTP values resulted in an aggregate value of approximately £25 million for visitors.
The values shown in Table 2 were included as part of the BCR calculations in the business case for the transport scheme. As most benefits of this project were non-financial, the wider social impacts were included in the BCR so that it more accurately reflected the value of the project to society. Calculations based only on the economic and environmental impacts resulted in a BCR of 0.6. Adding the wider cultural and heritage benefits increased the BCR to 1.15, indicating that the benefits of the project outweigh the costs.
7 Discussion
The case of the A303 project raises an important point: social value assessments only form one part of the decision making process. Arguably, the calculated BCR of 1.15 still represents a relatively poor value for money since the resources could be used for an alternative project – one with a stronger BCR that would deliver greater improvements in wellbeing. However, social value assessments that are concerned with how much a project improves people’s wellbeing form only one element in decision making – a wider range of impacts on other valuable things (such as freedom, fairness, rights and the intrinsic value of the natural world) are not captured.
Furthermore, the Institute for the Government (Atkins et al., 2017) has identified several limitations of the practical application of CBA, which are also relevant to the infrastructure and built environment sectors.
Over-optimistic cost estimates, leading to inflated BCRs. There are three main causes of this cost underestimation: strategic misrepresentation to make a project appear more attractive; optimism bias due to an inability to capture all relevant factors; and anchoring whereby there is a difficulty to move away from an initial, low-cost estimate. All three causes damage the decision making process.
Poor impact prediction for non-marginal effects. The current modelling techniques for estimating the wider effects of infrastructure on the entire UK economy are underdeveloped. This results in an analysis that does not fully capture and assess the effects of a project.
Lack of consistency between project appraisals, making project BCRs incomparable. This is particularly relevant for non-monetary impacts such as health, safety and the environment.
Poor communication of the results and their meaning. This can lead to misunderstandings by decision makers about critical assumptions and uncertainties.
The engineering sector could benefit from a similar tool used in the public sector that responds to these issues. While significant progress has been made and the linkage between the sector and its activities to social value has been intuitively established, most of the processes and practices remain to be dominated by economic considerations alone (Fujiwara and Dass, 2020). There have been several initiatives that have tried to address this gap; however, these remain largely at a subsector level and are not consistently applied throughout the infrastructure and built environment sector. For example, the CSIF and the National TOMs framework have been developed by the rail and real estate sectors, respectively, providing minimum standards and measures to account for social value. However, neither framework provides a clear interpretation of social value or consistent approach to quantitively assessing it.
The final section includes a high-level approach to the evaluation of costs and benefits that can be applied to the infrastructure and built environment sector to overcome the limitations of traditional CBA as it pertains to the measurement of wellbeing (social value).
8 Conclusion
This paper has set out the foundations for consistent and robust SVM in the infrastructure and built environment sector. In particular, the paper addresses the topic of valuing the broader societal and environmental effects of projects that have a large impact on people’s and communities’ quality of life.
The evaluation of infrastructure and built environment sector benefits could be improved if the framework set out in this paper was applied to major projects. To operationalise this, at a high level, this would involve developing a consistent set of guidelines or a tool which:
sets out a list of the important project outcomes (economic, environmental and wider societal) and the key metrics required to measure the performance of projects in the infrastructure and built environment sector
for each outcome, details a robust prediction method to estimate changes in the outcome over the course of the project (including any non-marginal effects)
for each outcome, establishes the value of the outcome using market prices or non-market valuation
contains a simple calculator tool that could be used to predict a project’s social value (net benefit figure and BCR) based on the project’s cost and the predicted changes in outcomes and associated values calculated above.
This tool, along with guidance on how to present and interpret the results, would allow engineers and other professionals to consistently evaluate the wellbeing (social value) impact of projects. To supplement this discussion, the Appendix to this paper provides an in-depth review of the CBA techniques that can be used as a tool for SVM and non-market valuation.
Acknowledgements
The authors would like to acknowledge the A303 Amesbury to Berwick Down road transport scheme commissioned by Highways England.
Appendix
HM Treasury’s Green Book sets cost–benefit analysis as its recommended tool for measuring social value. In particular, the Green Book takes a utilitarian social welfare function approach to cost–benefit analysis (Freeman et al., 2018; HM Treasury, 2003). This appendix sets out the foundations of cost–benefit analysis and non-market valuation in technical detail to give analysts a precise understanding of the approach (the framework set out below is based on the Michaelmas 2017 lecture series on social cost–benefit analysis given by Toke at the University of Cambridge).
The framework
Suppose that there are i = 1,2,3, … N individuals in society and there are two goods x1 and x2, which they consume. An individual’s wellbeing is equated to their preferences and is measured by an interpersonal comparable, cardinal utility function U(x1,i,x2,i) where xz,i is how much of good z person i consumes for z = 1, 2. Individuals have budget constraints represented by mi = p1x1,i + p2x2,i, where mi is their income and pz is the price of good z. They consume both goods to maximise their wellbeing. Solving this consumer optimisation problem gives the following condition:
where is the marginal utility of income, which is assumed to be the same for all individuals. In other words, the price of a good is equal to the amount of money required to give an equivalent impact on wellbeing as one unit of the good itself. Otherwise, a consumer could consume less or more of a good and be better off.
Suppose that there is a decision maker, who wants to deliver a project that provides some amount of good 1 for some people in society (Δx1,i ≥ 0 for i = 1,2,3, … N). This requires resources from the economy, and so there are less resources to deliver good 2 and the amount of good 2 falls (Δx2,i ≥ 0 for i = 1,2,3, … N). To evaluate whether to proceed to the project or not, the decision maker must determine whether the wellbeing is higher with the project compared to the situation without it. They do this using the social welfare function (SWF), which measures the aggregate wellbeing in society by adding up everyone’s utility:
The decision maker compares aggregate wellbeing with the project minus the aggregate wellbeing without it. The change is social welfare (equal to the project’s social value), which is given by:
In other words, the impact of the project on goods 1 and 2 (Δx1 and Δx2) is estimated, and then these impacts are valued based on the extent to which they affect wellbeing (). However, ΔSWF is currently measured in ‘wellbeing’ units. To convert this to a monetary measure, we use the marginal utility of income (λ) as a unit of account (numeraire):
is the project’s social value in monetary units. It contains all the same information (in terms of the ranking and ratio of projects) as ΔSWF. The only difference is the unit of measurement (analogous to changing from measuring length in inches to centimetres).
The term is known as the shadow price of good z, and it measures the wellbeing impact of that good in monetary terms for individual i (i.e. the equivalent monetary amount that gives the same wellbeing impact as a unit change in the good). The decision maker can estimate the amount of good 1 they deliver. We also know from the consumers’ optimisation that the shadow price of good 1 is the market price. Therefore, the benefits of the project are given by the market value of the estimated output, .
However, it is very difficult to estimate how much of other goods need to be forgone to deliver the project. Therefore, we need an alternative method for valuing costs. We consider the value of the inputs to the project. The project uses labour and capital at market prices. If markets are competitive and firms are profit maximising, then the market price of the labour and capital inputs is equal to the market price of the forgone output:
Δl1 and Δk1 are the amount of labour and capital used on the project. pi and pk are the prices of labour and capital, respectively. Combining the benefits and costs gives:
That is, the social value of the project is equal to the market value of its output minus the market value of the resources used to deliver it. represents the net benefit figure, and is the BCR.
Non-market goods
However, when considering the social impact for infrastructure projects, many goods/resources do not have a market value. As set out in the main text, there are three approaches to estimate the value of such goods. The text below sets out these approaches in technical detail for valuing marginal changes in these goods.
Revealed and stated preferences
To estimate a good’s shadow price, these approaches capture the amount of money that would give the equivalent impact on someone’s wellbeing as the good of interest. They do this by estimating the maximum amount that an individual is willing to pay for a good. To see how this allows an analyst to estimate a good’s shadow price, consider the following. The wellbeing impact of the amount of money they are willing to pay must be equal to the wellbeing impact of the good of interest. If it was less, then they could pay more money and be better off, so it would not be their maximum willingness to pay. If it was more, then paying that amount for the good would reduce their wellbeing in aggregate, so they would not be willing to pay that amount. Therefore, the willingness to pay and the non-market good are related as follows:
where Δmi is the individual’s maximum willingness to pay for Δxi of good x. Therefore, rearranging and substituting for the marginal utility of income, the shadow price of the good for person i is:
, is i’s willingness to pay, WTPi, for one unit of good x. In practice, analysts use averages for the shadow price in policy appraisal:
Wellbeing valuation
Wellbeing valuation offers a more direct route to non-market valuation. Wellbeing is assumed to be captured in an individual’s subjective ratings of life satisfaction, recorded in national survey datasets, up to some affine transformation U(xi,mi) = γLS(xi,mi) + α. To estimate the shadow price of a good, analysts use regression analysis on these datasets to estimate the effect of the good on life satisfaction and the effect of income on life satisfaction. In these regressions, life satisfaction generally takes the function form:
Using the chain rule, the shadow price is simplified as:
Therefore:
The average shadow price is . That is, estimate the impact of the good on life satisfaction and estimate the impact of the natural logarithm of income on life satisfaction using national survey data. Then, divide the former by the latter and multiply by the average income to estimate the shadow price.
Distributional effects
The analysis so far has ignored an important issue, distributional impacts. To incorporate this, we relax the assumption that the marginal utility of income is the same for all individuals. Now, it is a monotonically decreasing function of income (richer individuals value an additional pound less) that is always positive (more money is always better):
Now, the market price is given by:
For the numeraire, we use the average marginal utility of income (). The shadow price of a good k for individual i is given by, . In other words, calculate the market price of the good being provided and weight it according to the ratio of the recipient’s marginal utility of income and the average marginal utility of income. HM Treasury provides a method to quantitatively estimate by income group in the Green Book.
In practice, this means that the market value of benefits to richer individuals should be scaled down to reflect their true value and scaled up for poorer individuals. For non-market goods, taking average values has approximately the same effect as weighting if the wellbeing impact of the good is the same for different income groups.
Long-term effects
The framework above only considers one period of effects. It can easily be extended to multiple periods:
where xz,i,t is now the amount of good z that person i consumes in year t. We use the average marginal utility in the first year of the evaluation as the numeraire λ0. ρ is known as pure time preference; we prefer consuming now rather than in the future, so £1 today is worth £1 + ρ in a year. The consumer’s optimisation condition becomes:
The marginal utility of income depends on the year λt as it is a function of income and incomes tend to increase over time. Therefore:
Rearranging:
That is, calculate the market value of the benefits and costs (or use non-market valuation techniques to estimate this) for each year of the project. Then, discount the value of the benefits and costs according to the discount factor , which takes into account pure time preference and the changing marginal utility of income, and minus the costs from the benefits to estimate the net present value of the project. As above:
The Green Book sets out what this discount factor should be for government appraisals (see HM Treasury, 2020: pp. 101–106).

