
Construction and infrastructure projects account for a large share of global greenhouse gas emissions. Included in these projects are geotechnical engineering works, which cause environmental impact and costs throughout their life cycle. In the geotechnical design process, the geotechnical engineer often has design choices where different methods and materials can be used. If assessments of environmental impact and costs were to be integrated into the geotechnical design process, the geotechnical work could be made more sustainable. As a result of this, there is a need for research on integrating the assessments of environmental impact and costs into the geotechnical design process. This paper, therefore, presents a methodology showing how life-cycle assessment and life-cycle cost analysis could be integrated into the geotechnical design process. The presented methodology is then illustrated in a practical example for assessing the climate impact and costs of high-speed railway embankment fill methods.
Notation
- CHk,m
characterisation factor of the kth emission of impact category m
- COk, COLCC, COm, COx
conversion factors for E i,j,k, LCCi,j, ICi,j,m and OAi,j of Q i,j
- CVi,j,k, CVi,j
intermediate conversion factors needed for EFi,j,k and UCi,j
- Di
geotechnical design i
- Ei,j,k
life-cycle inventory (LCI) result; amount of the kth emission of Q i,j
- EFi,j,k
emission factor of the kth emission of Q i,j
- ICi,j,m
life-cycle impact assessment (LCIA) result; amount of impact category m of Q i,j
- LCCi,j
life-cycle cost (LCC) result; monetary cost of Q i,j
- OAi,j
other assessment results of Q i,j
- Qi,j
quantity j of a material or activity of Di
summed, converted and weighted result of design i
- UCi,j
unit cost for Q i,j
- Wk, WLCC, Wm, Wx
weighting factors for E i,j,k, LCCi,j, ICi,j,m and OAi,j of Q i,j
- ϵi,j,k
converted and weighted LCI result of the kth emission of Q i,j
- θi,j
converted and weighted results of other assessments OAi,j
- ιi,j,m
converted and weighted LCIA result of impact category m of Q i,j
- κi,j
converted and weighted LCC result of Q i,j
1 Introduction
Globally, the building and construction sectors accounted for almost 40% of the energy- and process-related carbon dioxide (CO2) emissions in 2018 (GlobalABC, 2019). Thus, construction and infrastructure projects must reduce their climate impact if international and national goals are to be be achieved – for example, goal 13, climate action, and the other 16 goals for sustainable development stated by the UN (2022), including environmental, economic and social sustainability (Desa, 2016).
Sustainability in geotechnical engineering is a comparatively new research area. Samuelsson et al. (2021) reviewed 29 scientific papers assessing sustainability in geotechnical engineering using the methods life-cycle assessment (LCA) and life-cycle cost analysis (LCCA), which are established methods for assessing the environmental impact and life-cycle cost (LCC) of a process or a material. However, where geotechnical design work is concerned, LCA and LCCA are rarely performed. The most common subject areas of published papers relating to LCA and LCCA in geotechnical engineering are ground improvement (e.g. da Rocha et al., 2016; Mohammed et al., 2021; Praticò et al., 2011; Raymond et al., 2021; Suer et al., 2009) and retaining wall/slope support (e.g. Heerten, 2012; Inui et al., 2011; Molina-Moreno et al., 2017; Pons et al., 2018; Zastrow et al., 2017; Zhu et al., 2022). Other topics are the LCA of geotechnical site investigation (Purdy et al., 2022) and the LCA of deep foundations (Giri and Reddy, 2015). For construction works, a full LCA and/or LCCA become comprehensive; therefore, some parts of the procedure are excluded in many studies. Not all life-cycle stages are assessed (Kendall et al., 2017), and one to three impact categories are used (Kendall et al., 2017; Raymond et al., 2020; Song et al., 2020). In cases when the LCA results are assigned to impact categories, normalisation can be performed, although the normalisation procedure has not been fully clarified (Sleeswijk et al., 2008).
In the design process of a construction project, the geotechnical engineer often has design options where different methods and materials can be used. The design process usually requires co-operation between practitioners from multiple disciplines, such as geotechnical engineers, road designers, structural engineers, landscape architects and, often, a sustainability manager. Here, the geotechnical engineer provides a design and estimates its quantities. The environmental impact and LCC of the design are usually assessed, if assessed at all, at the end of the design work by an LCA or LCCA manager. Integrating sustainability assessments and developing a methodology for this to use in the geotechnical design process could, however, clarify and facilitate for the geotechnical engineer how to perform the sustainability assessments themselves. Thus, as discussed by Song et al. (2020) and Samuelsson et al. (2021), methodologies and guidelines for performing LCA and LCCA in geotechnical engineering are needed. A few methodologies have been developed for geotechnical engineering works. A simplified methodology (streamlined energy and emissions assessment model (SEEAM)) for assessing embodied energy and carbon dioxide emissions for ground improvement works was presented by Shillaber et al. (2016a, 2016b), while a methodology for estimating the environmental impact of geotechnical projects using LCA and multiple regression analysis was presented by Cho et al. (2017). Basu and Lee (2022) optimised the geotechnical design in respect of the LCA results using a reliability approach. Other sustainability assessment approaches can be regarded as an alternative to LCA and LCCA for geotechnical engineering works, including, for example, GeoSPeAR, a method developed by Holt et al. (2010). Regarding the final geotechnical design, Basu et al. (2015) stated that the evaluation for choosing the final geotechnical design should not be based on popular choices but rather on rational judgement, as each evaluation is situation and project specific. Das et al. (2016) proposed a framework for evaluation, which assigns weights to the impact categories based on their relative importance. Damians et al. (2016a, 2016b, 2019) presented a framework for evaluation, in which weightings were applied to the sustainability results for earth-retaining wall structures. However, there is a lack of research on integrating sustainability assessments into the geotechnical design process. A methodology is needed that includes the entire geotechnical design process and not just the LCA and LCCA stages. The design of geotechnical engineering works is made in different project phases – for example, during deciding on suitable locations, during the determination of possible geotechnical engineering works and construction methods, during the detailed design or during the construction work.
This paper presents a novel methodology showing how LCA and LCCA can be integrated into the geotechnical design process to reduce the environmental impact and cost of geotechnical construction. The methodology is presented as a workflow including geotechnical design, LCA and LCCA, improvements in the LCA and LCCA results and evaluation. The presented methodology is illustrated in a practical example where climate impact and costs are assessed for different methods for constructing a high-speed railway embankment fill.
2 LCA and LCCA integrated into the geotechnical design process: proposed methodology
An overview of the proposed methodology for geotechnical design is presented in Figure 1. Construction and infrastructure projects include the following phases: planning, designing, production of construction material, construction, use and end of life. The presented methodology covers the design phase and includes the four stages:
geotechnical design
LCA and LCCA
identification and improvement
evaluation.
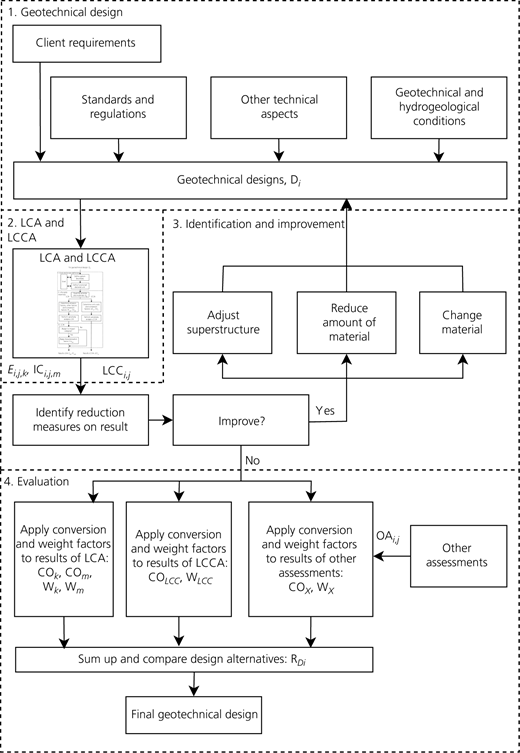
Presented methodology with LCA and LCCA integrated into the geotechnical design process
Presented methodology with LCA and LCCA integrated into the geotechnical design process
2.1 Stage 1: geotechnical design
The client’s requirements are the basis of any geotechnical design. Often there is a superstructure desired by the client – for example, a bridge, a building or a road. However, the design of the superstructure and the geotechnical design depend on other technical aspects of the project that the geotechnical engineer must also consider. There may be a lack of space, requirements from a landscape architect or a structural engineer or requirements in respect of the protection of animals and plants, archaeological findings or future planned construction. In a large project, these other technical aspects can considerably affect the geotechnical design and can sometimes be quite difficult for the geotechnical engineer to account for completely. The geotechnical engineer must also consider multiple design codes, standards and regulations during the design process. To decide which geotechnical work is needed, knowledge about the geotechnical and hydrogeological conditions is required. Based on the present knowledge of the site, the geotechnical engineer plans the geotechnical, geophysical and hydrogeological investigations needed to be able to understand and interpret the geotechnical context (Spross et al., 2022). Using this understanding, the geotechnical engineer develops one or more reasonable design alternatives, which is denoted D i in this paper.
2.2 Stage 2: LCA and LCCA
LCA and LCCA should be performed on design alternatives D i. The LCA method quantifies the potential environmental impact of a product during its life cycle according to ISO 14040:2006 (ISO, 2006a) and ISO 14044:2006 (ISO, 2006b). It can be used to identify where the reduction of emissions in the product life cycle can be made and to prioritise or change the design of a product or process. There are four stages in an LCA:
goal and scope definition
life-cycle inventory (LCI)
life-cycle impact assessment (LCIA)
interpretation.
An LCCA, on the other hand, quantifies the monetary cost of a product during its life cycle. According to ISO 15686-5:2017 (ISO, 2017), the included stages in an LCCA calculation are
construction
operation
maintenance
end of life.
LCCA is performed as an economic comparison of different alternatives. For LCA and LCCA, there are many guidelines, both international and national, as well as those developed by an individual client (e.g. EC, 2022; EPA, 2006; NordFoU, 2020; STA, 2020, 2021). According to the British standard BS EN 15804:2012+A2:2019 (BSI, 2021), a life cycle in LCA for construction works includes the following stages and substages: production (denoted A1–A3), construction (A4 and A5), use (B1–B7), end of life (C1–C4) and benefits and loads beyond the system boundary (D).
‘Stage 2. LCA and LCCA’ (from Figure 1) is presented in more detail in Figure 2 and discussed in more detail in the following.
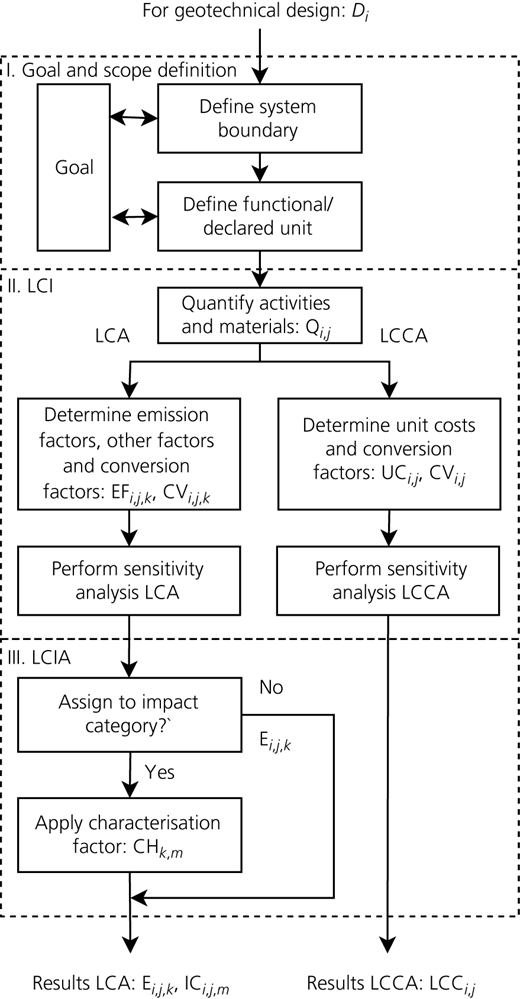
In the goal and scope definition (stage I), the goal of the assessment is decided by the client or in collaboration with the client. The goal can be, for example, to compare different design alternatives, D i, to find the one with the lowest environmental impact and/or cost, or to identify activities with a high impact on the result within one design alternative. The system boundary is defined by the included activities, materials, life-cycle stages, impact categories and quality of input data. The system boundary determines which processes are included in the study. The included life-cycle stages can depend on the goal of the study and the type of geotechnical construction works. A road, for example, does not often have an end-of-life stage. Instead, its use stage is long term because roads are only rarely decommissioned. The chosen length of the analysis period for the use stage can alter the results considerably (Liljenström et al., 2022). A functional or declared unit should be defined that is the reference unit to which the input and output data should be related in the assessments.
In the LCI (stage II), a quantification is made of the j included quantities, Q i,j, of the performed activities and used material within the system boundary, for each assessed design alternative D i. These quantities can be, for example, the volume of soil, the transport distance, the length of piles or the area of geotextile, among many others. When performing an LCA, k emission factors, EFi,j,k, are needed to consider the different emissions of Q i,j, although in an LCCA, only one unit cost, UCi,j, is needed per quantity. Both methods may require intermediate conversion factors, CVi,j,k and CVi,j, when the emission factor or unit costs relate to a unit different from that used for the quantity. An example is the excavation of soil, where the quantity is the volume of soil, but the emission factor concerns the volume of diesel used by the excavator, among other processes. Some emission factors can be found in environmental product declarations, which are LCAs reviewed by a third party. These are considered high-quality data. Emission factors, unit costs and conversion factors can often be found in international databases, national open databases or internal databases owned by companies. Two examples of international databases are ecoinvent, which is an international database integrated into the major LCA software (ecoinvent, 2022), and the database by the International Energy Agency (IEA, 2022). If data cannot be found in these databases, expert judgement has to be used. Unit cost data can also be collected from the producers of materials or contractors. If there are uncertainties in the input data, a sensitivity analysis should be carried out. When all EFi,j,k and CVi,j,k needed for an LCA have been defined, the resulting amount of the kth emission for geotechnical design D i and Q i,j is obtained as
The set of emission amounts, E i,j,k, is the output data of the LCI. Their respective units can be in, for example, kilogram emissions, volumes, areas or costs. In an LCCA, the LCC for geotechnical design D i and Q i,j, LCCi,j, is obtained as
For the LCA, there is an optional stage, the LCIA, where the environmental impacts are evaluated. In the LCIA, E i,j,k is assigned to impact categories by applying a characterisation factor, CHk,m, for each emission k included in impact category m for each E i,j,k. The LCIA result, for each impact category m, Q i,j and D i, then becomes
The impact categories can be, for example, climate impact, eutrophication, acidification, land use, water use or ozone depletion. In computer software for LCA calculations, impact assessment methods for assigning the LCI output to different impact categories are typically predefined – for example, environmental footprint (Fazio et al., 2020) and ReCiPe (Huijbregts et al., 2016).
2.3 Stage 3: identification and improvement
The next stage in the methodology is identification of reduction measures and improvement of the LCA and LCCA results in respect of a reduction in the environmental impact and LCC. The LCA and LCCA results are studied, and the activities and materials that have the most impact should be identified. There are three ways to adjust to make improvements: adjust the superstructure, reduce the amount of material or change material. Adjustments to the superstructure can imply, for example, lengthening or shortening of bridges, changes in building floor elevations or changes in the elevation or alignment of roads and railways. If a change in the superstructure is possible, the structural engineer makes the necessary design changes, which become the new input for the geotechnical design stage.
A material reduction implies an opportunity to reduce the environmental impact and LCC. In Sweden, for example, the manufacturing of construction parts accounts for about 80% of the total climate impact from production and construction (Fossilfritt Sverige, 2018). Large uncertainties in soil parameters can cause less favourable LCA and/or LCCA results. Additional geotechnical investigations and investigations with several different methods can sometimes reduce uncertainties (BSI, 2004). A reduction in uncertainty can lead to a reduction in material – for example, shorter piles, a reduced number of deep mixing columns or a smaller area of sheet pile wall – as a less conservative design can be used.
The third possibility for improving the LCA and LCCA results is a material change – for example, by changing to a more environmentally friendly cement or choosing a different lightweight fill material. The manufacturing of steel and cement accounts for about 50% of the climate impact from the construction of buildings, excluding transport (Liljenström et al., 2015), so reducing the amount of steel and cement or changing to a more environmentally friendly material is desirable. The use of low carbon dioxide cement can reduce the embodied carbon dioxide during the manufacturing of cement significantly (Teng and Pan, 2019). The improvements may require supplementary geotechnical investigations. The methodology thereafter returns to the geotechnical design stage. When no more improvements are found reasonable, the methodology continues with stage 4: evaluation.
2.4 Stage 4: evaluation
The LCA and LCCA results from the assessed design alternatives, D i, are compared to find the final geotechnical design. The results from the different assessments are often in different units. The LCA result can consist of results from one or more impact categories or the LCI. To evaluate the results (including consideration of the results of other assessments, OAi,j, e.g. social LCA, animal or plant inventories and building preservation), conversion to a common unit is needed, which is obtained by applying conversion factors, COk, COLCC, COm and COx, to the LCI result (E i,j,k), the LCC result (LCCi,j), the LCIA result (ICi,j,m) and the results of other assessments (OAi,j). How important the reduction of each calculated result in the project is relative to those of the other assessments is accounted for by applying weighting factors W k, W LCC, W m and W x. Thus, each LCI, LCC and LCIA result for Q i,j in D i receives a converted and weighted result in a common unit:
for the LCI result
for the LCC result
for the LCIA result and
for the result of other assessments.
The conversion factor can, for example, be an assigned cost for 1 kilogram of carbon dioxide equivalent (kgCO2e) or 1 m2 land use. All converted and weighted costs (or other common selected units) for each design alternative D i are then summed up:
where is the summed converted and weighted result for each design alternative i, which is then compared, and the final geotechnical design alternative is chosen as the one with the lowest .
3 Illustrative example
To illustrate how the presented methodology can be used in a geotechnical engineering project, the climate and cost assessments of three different embankment fill methods
crushed bedrock
cement-stabilised till
foam glass
were used as a basis for the discussion. Initial analyses were performed on the crushed bedrock method and the cement-stabilised till method as presented by Samuelsson et al. (2022) and Tyréns Sverige AB (2021), and these methods are therefore described in less detail in this paper. The foam glass method was added as a third method.
3.1 Stage 1: geotechnical design
The project is a 70 km long section of the high-speed railway project called New Main Lines between the cities of Hässleholm and Lund in Sweden. The availability of crushed bedrock, often used as embankment fill material, is limited. The client, the Swedish Transport Administration (STA), has considered using a cement-stabilised local sandy till instead of crushed bedrock. For the methodology presented in Figure 1, the standards and regulations relevant to the geotechnical design are Eurocode 7 (BSI, 2004) and guidelines from the STA (2016). Other technical aspects shown in Figure 1 are here represented by the cross-section of the embankment, which was decided by other engineers in the project (see Figure 3).
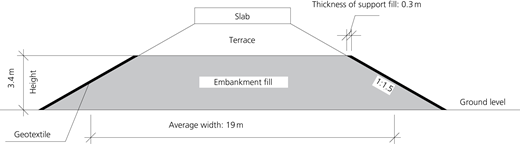
Cross-section of the embankment showing the assessed embankment fill layer in grey. Geotextile and support fill are included only in the foam glass method
Cross-section of the embankment showing the assessed embankment fill layer in grey. Geotextile and support fill are included only in the foam glass method
In this example, only the embankment fill is studied, so the geotechnical and hydrogeological conditions of the underlying soil are not considered. Based on the specified conditions, two embankment fill methods are chosen as the initial alternatives to be evaluated: crushed bedrock, D 1, and cement-stabilised till, D 2. A third method using foam glass, D 3, is subsequently presented to illustrate the identification and improvement stage (stage 3) of the methodology.
3.2 Stage 2: LCA and LCCA of D 1 and D 2
The goal of the LCA and LCCA is to assess the climate impact and cost of the crushed bedrock method and the cement-stabilised sandy till method. The system boundary for the assessments is defined as the embankment fill needed for a high-speed railway section of 70 km. Analyses of soil quantities in the project show a surplus of 480 000 m3 of sandy till, which if not used in the project will be transported away and stored in a landfill. The climate impact (carbon dioxide equivalents (CO2e)) and monetary costs (Swedish krona (SEK)) are to be assessed. €1 equals 10.5 SEK (August 2022). Only the life-cycle stages of production (A1–A3) and construction (A4 and A5) are presented. The use stage (B1–B7) is assumed to be the same for the methods and is therefore not included in the presentation. The activities included for the crushed bedrock and cement-stabilised till methods are presented in Figures 4(a) and 4(b).
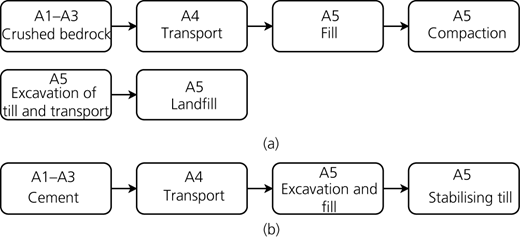
Activities and materials included for the (a) crushed bedrock method and (b) cement-stabilised till method (from Samuelsson et al. (2022), reproduced with permission)
Activities and materials included for the (a) crushed bedrock method and (b) cement-stabilised till method (from Samuelsson et al. (2022), reproduced with permission)
The declared unit in the assessment is an embankment with a total volume of 480 000 m3, an average width of 19 m and a height of 3.4 m, which gives a length of 7400 m. The quantities, Q i,j, are presented in part in Table 1 together with the emission factors EFi,j,k, unit costs UCi,j and conversion factors CVi,j,k.
Quantities, emission factors, conversion factors and unit costs for the life-cycle stages for the crushed bedrock method and the cement-stabilised till method
| Life-cycle stage | Quantities, Q i,j | Emission factors, EFi,j,k, and conversion factors, CVi,j,k | Unit cost, UCi,j |
|---|---|---|---|
| Crushed bedrock | |||
| A1–A3 crushed bedrock | 1 056 000 000 kg | 0.004 kgCO2e/kg | 120 SEK/1000 kg |
| A4 transport | 25 km | CVTransport,a EFDiesel b | 38 SEK/1000 kg |
| A5 fill | 480 000 m3 | CVExcavator,c EFDiesel b | 200 SEK/m3 |
| A5 compaction | 41 073 l, 984 200 m2 | EFDiesel b | 22 SEK/m2 |
| A5 excavation of till and transport | 480 000 m3, 50 km, 816 000 000 kg | CVExcavator,c CVTransport,a EFDiesel b | 250 SEK/m3 |
| A5 landfill | 480 000 m3 | 0 kgCO2e/m3 | 200 SEK/m3 |
| Cement-stabilised till | |||
| A1–A3 cement | 36 720 000 kg | 537.7 CO2e/1000 kg | 958 SEK/1000 kg |
| A4 transport | 60 km | CVTransport,a EFDiesel b | 90 SEK/1000 kg |
| A5 excavation and fill | 480 000 m3 | CVExcavator,c EFDiesel b | 80 SEK/m3 |
| A5 stabilising till | 336 000 l | EFDiesel b | 171.4 SEK/m3 |
CVTransport is the conversion factor for diesel used for transport with lorries, 2.5 MJ/tkm and 43.25 MJ/l diesel
EFDiesel is the emission factor for diesel, 2.8 kgCO2e/l diesel
CVExcavator is the conversion factor for diesel used by an excavator per cubic metre of excavated soil, 0.19 l diesel/m3 soil
Figures 5 and 6 show the results of the cement-stabilised till method (left bar) and the crushed bedrock method (middle bar). They were calculated using Equations 1 and 2. The input data for the LCA were already in units of CO2e, which is the unit of climate impact, so no characterisation factor was needed.
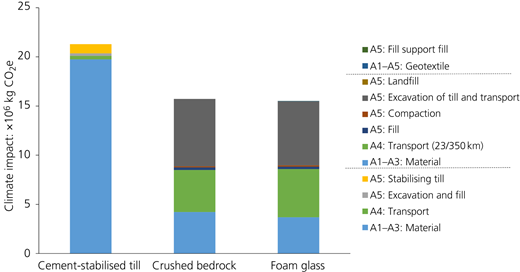
Climate impact results from the LCA. The substages are presented in the same order in the legend and the chart
Climate impact results from the LCA. The substages are presented in the same order in the legend and the chart
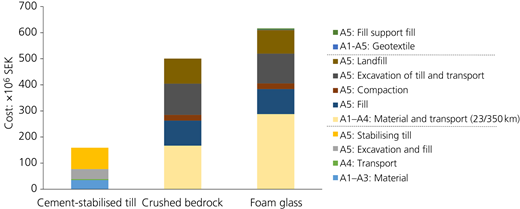
Cost results from the LCCA. The substages are presented in the same order in the legend and the chart
Cost results from the LCCA. The substages are presented in the same order in the legend and the chart
3.3 Stage 3: identify-and-improve reduction measures for D 1 and D 2
The LCA and LCCA results for the crushed bedrock method and cement-stabilised till in Figures 5 and 6 showed that the method stages with the highest results are the material (A1–A3) and transport (A4 and A5) stages. There is a considerable CO2e contribution from the production of cement. An adjustment in the superstructure or a reduction of material is not possible because the structure being assessed is an embankment with a fixed height and width. However, a material change is possible. Using foam glass instead of crushed bedrock or cement-stabilised till can reduce the climate impact of the material, because it is made from recycled glass. Foam glass is lighter than bedrock, which potentially can reduce the climate impact and transport costs. As the material cost generally was expected to be higher, it was not considered one of the initial methods, but in light of the initial results – noting in particular the considerable CO2e contribution from cement – an evaluation of a foam glass design was considered worthwhile and denoted geotechnical design D 3.
3.4 Stage 1: geotechnical redesign for the foam glass method, D 3
Some design changes are needed if foam glass is used. The foam glass needs support fill on the slopes to support the internal stability of the foam glass, with a geotextile separating the two materials (see Figure 3). The local till can be used as a support fill, which can reduce the climate impact and costs of transport and landfill (A5) of the excess till, as less till has to be removed from the construction site.
3.5 Stage 2: LCA and LCCA of D 3
The system boundary and the declared unit as previously used are retained to allow comparison. The included activities and materials for the foam glass method are presented in Figure 7.
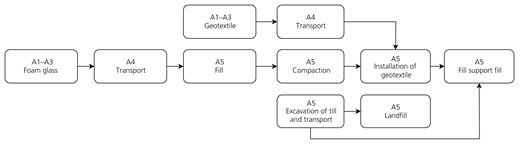
The foam glass has a density of 180 kg/m3 and is manufactured in Hammar, Sweden. It is transported by lorry to the construction site. Some of the excavated till is used as support fill (A5). The road transport distance of the geotextile (A4) included in the LCA is 1000 km. The installation of the geotextile (A5) is performed manually. The quantities, Q i,j, are presented in Table 2 together with the emission factors EFi,j,k, unit costs UCi,j and conversion factors CVi,j,k.
Quantities, emission factors, conversion factors and unit costs for the life-cycle stages of the foam glass method
| Life-cycle stage | Quantities, Q i,j | Emission factors, EFi,j,k, and conversion factors, CVi,j,k | Unit cost, UCi,j |
|---|---|---|---|
| A1–A3 foam glass | 480 000 m3 | 7.77 kgCO2e/m3 (Hasopor AB, 2017) | 600 SEK/m3 (STA, 2022a) including A4 transport |
| A4 transport | 350 km | CVTransport,a EFDiesel b | Included in A1–A3 foam glass |
| A5 fill foam glass | 480 000 m3 | CVExcavator,c, EFDiesel b | 200 SEK/m3 (STA, 2022a) |
| A5 compaction | 41 073 l, 984 200 m2 | EFDiesel b | 22 SEK/m2 (STA, 2022a) |
| A1–A5 geotextile | 83 427 m2 | 0.4 kgCO2e/m2 (STA, 2022b) | 10 SEK/m2 (STA, 2022a) |
| A5 excavation of till and transport | 480 000 m3, 50 km, 816 000 000 kg | CVExcavator c, CVTransport a, EFDiesel b | 250 SEK/m3 (data from experts) |
| A5 fill support fill | 25 042 m3 | CVExcavator c, EFDiesel b | 200 SEK/m3 (STA, 2022a) |
| A5 landfill | 454 958 m3 | 0 kgCO2e/m3 (data from experts) | 200 SEK/m3 (data from experts) |
CVTransport is the conversion factor for diesel used for transport with lorries, 2.5 MJ/tkm and 43.25 MJ/l diesel (STA, 2022b)
EFDiesel is the emission factor for diesel, 2.8 kgCO2e/l diesel (STA, 2022b)
CVExcavator is the conversion factor for diesel used by an excavator per cubic metre excavated soil, 0.19 l diesel/m3 soil (STA, 2022b)
Figures 5 and 6 show the results of the foam glass method (right bar) along with the results of the cement-stabilised till method (left bar) and the crushed bedrock method (middle bar). They were calculated using Equations 1 and 2. The input data for the LCA were already in units of CO2e, so no further conversion was needed. A sensitivity analysis for the unit cost of foam glass material and transport (A1–A4) was carried out because of its large share of the total LCCA result. To achieve the same total cost for the foam glass method as for the crushed bedrock method, the foam glass (A1–A4) needs to cost less than 360 SEK/m3.
The climate impact of the foam glass method is the lowest of the three methods, 15.5 × 10⁶ kgCO2e, which is slightly lower than that of the crushed bedrock method, 15.7 × 10⁶ kgCO2e, and significantly lower than that of the cement-stabilised till method, which has the highest climate impact of 21.3 × 10⁶ kgCO2e. In the material stage (A1–A3), the foam glass method has the lowest impact of all methods. The climate impact of excavation and transport of till (A5) for the foam glass method is slightly less than that of the crushed bedrock method. The climate impacts of the geotextile (A1–A5) and support fill (A5) are negligible.
The cost of the foam glass method is the highest: 616 million SEK, followed by that of the crushed bedrock method, 501 million SEK. The cement-stabilised till method using cement type CEM II has the lowest total cost, 159 million SEK. Comparing the material stages (A1–A3) of the three methods, foam glass is still the most expensive material, although the costs of excavation and transport of till (A5) and the landfill (A5) are slightly lower for the foam glass method than for the crushed bedrock method, due to the smaller volume of till that has to be removed. The cost for the geotextile (A1–A5) is negligible, and the cost for the fill using support fill (A5) is small, 5 million SEK, which is only 8% of the total cost.
3.6 Evaluation for deciding the final geotechnical design
For this example, no further reduction measures are assumed possible, so a final geotechnical design method can be chosen, based on the results from the LCA and LCCA of each of the three methods. No other assessment – for example, social sustainability – is considered. Thus, only climate impact (in the units of CO2e) and the cost (SEK) are considered. The results from LCA and LCCA in Figures 5 and 6 are not consistently in favour of one of the methods. Conversion factors, COm, are applied to the results to obtain a common unit for the LCA and LCCA results, so the respective results can be weighted together. Swedish krona (SEK) is chosen as the common unit, so a conversion factor for converting from kgCO2e to SEK is needed. For the conversion factor, the average price for 1000 kgCO2e based on the EU Emissions Trading System in the year 2021 – namely, 556.5 SEK/1000 kgCO2e (SEPA, 2022) – could be potentially used. However, this price did not reflect the social impact of climate change, so instead the price of 3100 SEK/1000 kgCO2e, following BEIS (2023), was used. In this analysis, the LCA and the LCCA results were considered to be equally important, so the weighting factors, W m and W LCC, were equal for both LCA and LCCA.
Conversion factors and weighting factors are applied to the LCA results of the three methods according to Equations 4b and 4c. The summed converted and weighted result for each design alternative, , and , is obtained using Equation 5. According to the presented methodology, the design decision was based on a comparison of the summed weighted results, , in Figure 8(a) for the three methods. The cement-stabilised till method had the lowest and was therefore chosen as the final geotechnical design. For comparison, if instead 556.5 SEK/1000 kgCO2e (SEPA, 2022) was used as a conversion factor, the converted and weighted LCA results would be 5.9 million SEK for the cement-stabilised till method, 4.4 million SEK for the crushed bedrock method and 4.3 million SEK for the foam glass method. This would give an even larger discrepancy between the LCA and LCCA results and would not affect the ranking of the three methods.
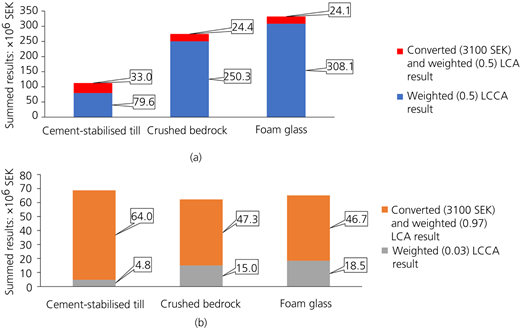
Summed results using (a) a weight of 0.5–0.5 (LCA–LCCA) and (b) a weight of 0.97–0.03 (LCA–LCCA) and SEK as a common unit
Summed results using (a) a weight of 0.5–0.5 (LCA–LCCA) and (b) a weight of 0.97–0.03 (LCA–LCCA) and SEK as a common unit
4 Discussion
The LCA and LCCA results from Figures 5 and 6 show that the material production stage and the transport stages are the main contributors to the total result, except for the cost of the cement for the cement-stabilised till method. The cement material stage (A1–A3) has a climate impact that is 93% of the total climate impact (A1–A5) of the cement-stabilised till method. However, the cost of the cement material stage (A1–A3) is only 22% of the total cost (A1–A5) of the method. Therefore, the cost of the cement (A1–A3) may not be in proportion to the climate impact of the cement.
To analyse this issue, two parameters can be altered in the evaluation: the conversion factor and the weighting factor. The two considered conversion factors, 556.5 SEK/1000 kgCO2e and 3100 SEK/1000 kgCO2e, did not affect the order of the summed results and did not change the decision of the final design. Analysing the impact of conversion factors, it is found that a cost as high as 80 000 SEK/1000 kgCO2e is in fact needed to give the cement-stabilised till method the highest summed result . An analysis of the weighting factors shows that weighting factors of 0.97 for the converted LCA result and 0.03 for the LCCA result (instead of equal weights) are needed to give the cement-stabilised till method the highest (Figure 8(b)). The reason for needing such a large weighting factor to outweigh the low LCC is that the foam glass method and crushed bedrock method have only 30% lower climate impact than the cement-stabilised till method.
The choice of conversion factors and weighting factors lies with the evaluator of the LCA and LCCA results. The choice should reflect their (organisation’s) values and policies. However, if an industry sector or nation wants to join forces towards common environmental goals, these factors and weights should be standardised nationally, to enable comparable LCAs and LCCAs. Note that the magnitude of the conversion factors depends on the location because, for example, land is more expensive in some parts of the world than in others. The conversion factors may also change over time – for example, the material cost depends on the world economy. In specific projects, clients can still decide to modify the factors to reduce the environmental impacts beyond those set in the national goals. This is in line with Basu et al. (2015), who stated that each evaluation is situation and project specific. In such cases, existing databases should be supplemented with these factors for the evaluation stage.
Another option for reducing the LCA and LCCA results in the presented methodology, aside from the choice of conversion factors and weighting factors in the evaluation stage, is in the identification and improvement stage. This stage allows the geotechnical engineer to optimise the geotechnical design based on the assessed LCA and LCCA results for the design while still fulfilling the technical requirements. The improvement of the design in this stage is influenced by uncertainties about ground conditions, uncertainties in the input data and uncertainties in predicting the need for maintenance during the use stage. There are uncertainties concerning the geotechnical and hydrogeological conditions. For example, the uncertainty in input data can be reduced by improving existing public databases by keeping them updated and including all materials and activities used for geotechnical engineering works. Maintenance work data can be stored in databases to improve the predictions of the need for maintenance in the future. Reducing these uncertainties or knowing how to handle and present these uncertainties could further improve the LCA and LCCA results.
5 Conclusions
This paper presents a methodology on how to integrate LCAs and LCCAs in the geotechnical design process. The methodology is illustrated in a practical example. While LCA and LCCA are established methods, geotechnical engineering has its own design processes, standards and regulations that must be considered. The presented methodology fully integrates the LCA and LCCA into the geotechnical design process to simplify the sustainability considerations for the geotechnical engineer. The methodology makes it possible to reduce costs and environmental impact further by adjusting the geotechnical design. The methodology is ready to use in the geotechnical design of construction and infrastructure projects. The methodology facilitates finding a final geotechnical design with an environmental impact and cost as low as possible.


Acknowledgements
The presented research was funded by the Sven Tyréns Foundation and the Swedish Transport Administration through Better Interaction in Geotechnics. Their support is gratefully acknowledged.
