


This study aims to analyse the effects of environmental and climate (dis)amenities on house prices in the Italian Alps.
Drawing on a dataset containing 447 sales contracts, this research adopted two modelling approaches: the classical hedonic model, estimated via ordinary least squares and a spatial model. Combining hedonic models with spatial models offers insights into studying property prices in alpine areas by capturing spatial dependencies of neighbouring areas, thus avoiding biased estimates and improving model accuracy.
We show that higher winter temperatures significantly decrease property prices, reflecting preferences for higher altitudes with reliable winter sports conditions. Increased forest cover also negatively impacts prices, suggesting a preference for traditional alpine landscapes with panoramic views. Energy-efficient dwellings, however, command higher prices, indicating their value in the market.
We contribute to the literature by (1) exploring the relationship between house prices and natural amenities in the European Alps; (2) using transaction data instead of property listings in Italy to provide more accurate estimates and (3) accounting for spatial autocorrelation to enhance the robustness of our analysis. Beyond addressing those gaps, our findings provide insights for land use planning and support the development of diversified and sustainable tourism strategies.
1. Introduction
Mountains are key in providing ecosystem services (ES), such as clean water, fresh air, biodiversity, wood provision and avalanche prevention through their forests. Mountains are also popular for recreation and tourism, offering scenic landscapes, heritage and opportunities for sports (Martin-Lopez et al., 2019). The growing appreciation for outdoor spaces, particularly after the coronavirus disease 2019 (COVID-19) pandemic, has led to increased visits, especially in areas near urban centres with improved accessibility (da Schio et al., 2021; Grima et al., 2020; Sikorska et al., 2023). Several ES are experiencing this rising demand, and their value is not easily determined due to the lack of existing markets.
One effective method to estimate the (use) value of ES in monetary terms is by examining the prices of goods that exhibit a degree of complementarity with them. Studies using hedonic pricing models (HPM) (Rosen, 1974) have demonstrated that real estate often reflects increased demand for natural areas. Across different continents, research consistently shows that properties located near natural features such as green parks and water bodies present a premium price, while those in impervious and polluted places tend to have lower market values (Liebelt et al., 2018; Mei et al., 2020; Sander and Haight, 2012; Teo et al., 2023). This concept is supported by a substantial body of scientific literature investigating the impact of environmental amenities on housing prices globally (Schaeffer and Dissart, 2018).
The HPM method assumes that the price of a real estate asset depends on the characteristics (intrinsic and extrinsic) of the asset itself. Therefore, these models allow the capture of the value of each characteristic directly influencing the price of a dwelling (Rosen, 1974). The assumption derived from the HPM is that people are attracted to places offering a combination of the preferred amenities, so houses in those locations tend to present higher prices (Rehdanz and Maddison, 2004). Among these amenities, home buyers may consider ES when making pricing decisions, thus offering a quantitative measure of the human-nature relationship and uncovering the utilitarian value of natural amenities, supporting long-term land use planning (Teo et al., 2023).
Climate, alongside natural amenities, has been shown to impact property prices. This can occur directly through climate amenities or disamenities, such as temperature and precipitation (Albouy et al., 2016; Sussman et al., 2014) or indirectly through changes in landscape characteristics and tourist activities driven by warming trends and increased risks like reduced snowfall or more extreme weather events (Butsic et al., 2011; Zhang, 2016). These climate-induced shifts in amenities are particularly pronounced in regions like the European Alps, a renowned destination for their landscape resulting from the relationship between natural aspects and cultural heritage. The European Alps are particularly subject to climate change: over the past century, the mean temperature in the Alps has increased twice as much as the global average (Auer et al., 2007). Snow cover is expected to decrease drastically, especially in elevations below 1,500–2,000 m above sea level (masl), and hazards related to glacier retreat will be more frequent (Gobiet et al., 2014).
This trend is also evident in the Veneto region of Northeastern Italy, home to the UNESCO-listed Dolomites. The reduction in operational ski areas is reshaping competitiveness within and among regions, with consequential effects on ski tourism employment and the valuation of vacation property real estate (Steiger et al., 2017). Mountain areas, particularly the European Alps, are ecologically and economically significant and highly vulnerable to climate change, making them a subject of growing scientific interest. However, there is a notable research gap concerning the relationship between house prices and climate amenities in these regions. While a few studies have explored this relationship more broadly (Butsic et al., 2011; Galinato and Tantihkarnchana, 2018), none, to our knowledge, have specifically focused on the Alps. Additionally, despite numerous studies on the impact of natural amenities on housing prices, none have targeted the Alpine area.
A further limitation observed in Italian HPM studies is the predominant use of listing prices rather than real transaction data (Fregonara and Rubino, 2021; Schaeffer and Dissart, 2018), which introduces potential upward bias and error variance in estimates, especially when dealing with absolute rather than relative values (Kolbe et al., 2021). The preference for listing prices is explained by the difficulty in obtaining real transaction data, which are not easily accessible and publicly available in Italy (Bisello et al., 2020; Manganelli et al., 2019).
This study addresses literature gaps by examining how environmental and climate amenities influence property prices in alpine regions, focusing on the Agordino Valley, Veneto, Italy. In a HPM, climate amenities – such as mild winters and comfortable summers – are expected to enhance a location’s attractiveness. Climate amenities are different from climate change, which involves long-term risks like rising temperatures and natural disasters. Rather than assessing climate change’s long-term effects on real estate, this study analyses how short-term climate amenities impact mountain town house prices, forming a basis for future climate change research. Methodologically, it advances the field by using real transaction data instead of asking prices and pioneering hedonic models in the European Alps while integrating environmental and climate variables into a spatial model.
Assessing the value of natural and climate amenities using the real estate market can be a valuable tool for policymakers to measure how they affect people’s welfare. This valuation can inform land use planning and facilitate the development of diversified and sustainable tourism strategies (Albouy et al., 2016; Galinato and Tantihkarnchana, 2018; Jim and Chen, 2009; Luttik, 2000).
2. Methodology
To analyse how environmental and climate factors affect alpine property prices, we estimated hedonic models using sales contract data from a specific valley in the Veneto Alps. We employed both a classical hedonic model, estimated via ordinary least squares (OLS) and a spatial model. Combining hedonic models with spatial models captures spatial dependencies, reducing bias and improving accuracy. Comparing both models enhances insights, with spatial models complementing classical ones for a more comprehensive understanding. This integrated approach strengthens the validity of our findings.
2.1 The study area
Our study area focuses on the Agordino Valley, an alpine region in the province of Belluno, Veneto, Italy (Figure 1). Located within the UNESCO-listed Dolomites, we focus on ten municipalities: Agordo, Alleghe, Canale, Cencenighe Agordino, Falcade, Rocca Pietore, San Tomaso Agordino, Selva di Cadore, Taibon Agordino and Vallada Agordina. These municipalities were selected based on their relevance to touristic activities and their varied altitudes ranging from 580 to 1890 masl, resulting in diverse environmental characteristics, such as temperature and landscape. Additionally, the selection of the study area was informed by a preliminary check of data availability regarding transaction contracts on the Italian Revenue Agency (Agenzia delle Entrate).
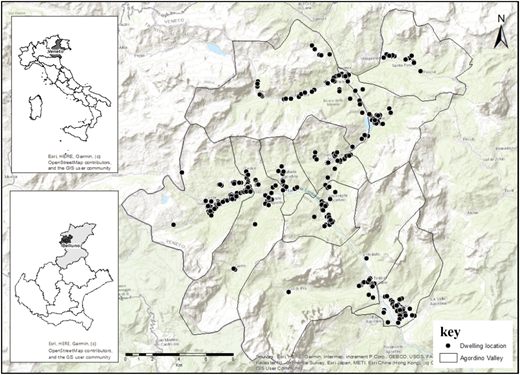
Location of the study area. Source: Authors’ own work. The map was generated using ArcGIS (ESRI, 2023)
Location of the study area. Source: Authors’ own work. The map was generated using ArcGIS (ESRI, 2023)
Given its unique landscape characteristics, winter sports attractions, and industrial activities, the real estate market in the municipalities located within the alpine range in the Belluno province presents higher values than those located elsewhere in the province (Figure 2).
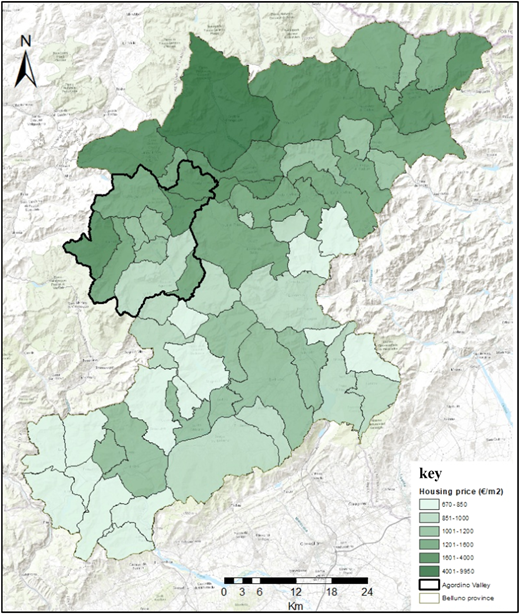
Housing price distribution in the Belluno province. Values for the central zone of each municipality in the first semester of 2023. Source: Authors’ own work. The map was generated using ArcGIS (ESRI, 2023) based on data from Agenzia delle Entrate (2024)
Housing price distribution in the Belluno province. Values for the central zone of each municipality in the first semester of 2023. Source: Authors’ own work. The map was generated using ArcGIS (ESRI, 2023) based on data from Agenzia delle Entrate (2024)
2.2 Hedonic price modelling
The HPM is a non-market valuation approach within the Revealed Preferences Methods (RPMs), and it is extensively used to estimate the monetary value of environmental goods in the real estate market. The RPM is based on the notion that the value of environmental amenities or disamenities can be “revealed” by people’s purchase decisions concerning related market goods: the observation of people’s real choices in the market allows to uncover these values (Boyle, 2003). The HPM theoretical foundation is based on Rosen’s model (Rosen, 1974) and Lancaster’s consumer theory (Lancaster, 1966), which asserts that a good, such as a house, is characterized by its constitutive properties (attributes). Hence, its value is determined by the bundle of attributes. Ultimately, the good in question can be broken down into its individual components, each possessing an implicit market value (Herath and Maier, 2010).
In the case of a house, these components may include intrinsic attributes or structural characteristics (e.g. number of bedrooms, surface and energy performance) and extrinsic attributes or location characteristics (e.g. local school quality, air quality and green areas); thus, the function describing the price of a real estate property can be written as:
Where P is the rent or price of the house, Ik is a vector of intrinsic structural characteristics of the dwellings, Ej is the vector of extrinsic characteristics, β0 is the intercept coefficient, βk and βj are the parameters (coefficients), and ε is a vector of random errors. From an economic point of view, in the case of linear models, βk and βj correspond to the marginal price of each characteristic, that is, the price increase (or decrease) determined by a unitary increase of the independent variable (Rosen, 1974). The linear regression in (Equation 1) is commonly turned into a log-linear regression by taking the natural logarithm of the dependent variable, which in our case is the price per square meter (Equation 2).
Equation 2, the model specification we used in our study, is estimated by OLS, which assumes that outcomes for different units are independent of each other. In the case of continuous variables, it is possible to interpret the coefficients (βk and βj) as the percentage change of the property price (P) due to marginal changes in the independent variables (Ik and Ej), while in the case of discrete or dichotomous variables the percentage change of P can be calculated as follows (Halvorsen and Palmquist, 1980):
2.2.1 Spatial effects in hedonic models
The OLS assumption may limit our study when dealing with spatial data, as real estate prices of neighbouring properties influence individual dwelling prices. Therefore, relying solely on OLS may not fully capture the spatial dependencies in our data, leading to biased estimates (Lesage, 1999).
To address potential spatial spillover effects, Moran’s I is the most recommended test for spatial autocorrelation (Anselin, 2003; Florax and de Graaff, 2004). Moran’s I is calculated based on the spatial weights matrix to define the spatial relationships between observations (Anselin, 2003). This test assumes a null hypothesis of random distribution of housing prices, and the p-value indicates whether spatial clustering exists. Since our observations represent points rather than contiguous polygons with common borders, we chose Inverse Distance Weighting (IDW) to construct the spatial weights matrix. IDW assigns greater weight to closer observations, assuming stronger connectivity between nearby units (Anselin, 2003) [1].
This study employs a spatial lag model, also known as the Spatial Autoregressive Model (SAR), to control for the effects of autocorrelation. The SAR incorporates a hedonic function with a specific price weight matrix, addressing the spatial relationship between the dependent variable (house price) and its neighbouring properties (Halleck Vega and Elhorst, 2015). Although we initially considered SAR and the spatial error model (SEM), which assumes spatially correlated error models, we found through Lagrange Multiplier tests that only the SAR model significantly reduced the residual variance, indicating a better fit for our spatial regression model (Florax and de Graaff, 2004; Osland, 2020). Thus, the formula can be specified as follows:
where denotes the spatial dependence parameter for the dependent variable, logged price per square meter, W is the row-standardized spatial weights matrix, and W is the spatially lagged dependent variable, and ε is a vector of normally distributed errors. In a SAR model, the impact of a change in the explanatory variables on our dependent variable is not simply the estimated coefficient, as with a standard regression model. Instead, we must consider the effects of changes in neighbouring values. To capture these impacts, we use the approach outlined by Kim et al. (2003). This approach distinguishes between the direct effect, represented by the coefficient as estimated (, and the total effect, which corresponds to this coefficient multiplied by the spatial multiplier, calculated as . An indirect effect is then derived as the difference between the two. The spatial weight matrices, computation of the spatial lag and error lag terms, and the spatial regression analysis were conducted using GeoDa™, a software tool commonly employed for spatial data analysis and geospatial modelling (Anselin et al., 2006).
2.3 Data and variables
Transaction data for dwellings in our study area was sourced from the Italian Revenue Agency (Agenzia delle Entrate) web portal SISTER, which contains officially registered sales contracts. The selected period was from January 2022 to November 2023. This relatively short timeframe was chosen to minimize the impact of inflation and other economic factors on property values, eliminating the need to control for time-related price adjustments. However, we ensured that the period provided sufficient observations for reliable analysis.
The data collection resulted in a dataset of 883 transactions, with only 447 completed and suitable for analysis due to missing details. The dataset includes transaction prices, structural variables from sales contracts and GIS-based environmental and climate variables, which refer to environmental and climate data that were captured, visualized, and measured using a geographic information system (GIS) (see Table 1). Though relatively small, the dataset is significant, given the challenges associated with data collection. Unlike other countries, retrieving sales transaction records in Italy is a manual and time-intensive process, requiring each contract to be downloaded individually in PDF format. Furthermore, extracting relevant variables demands a thorough review of each document, as contract structures vary significantly. These constraints highlight the dataset’s value for the analysis.
Variables used in the hedonic models
| Variable | Acronym | Unit/level | Type | Description | Source |
|---|---|---|---|---|---|
| Dependent variable | |||||
| Log of price/m2 | ln(P/m2) | €/m2 | Continuous | Logarithm of the unit price of each dwelling | Sales contract |
| Intrinsic variables | |||||
| Property size | size | m2 | Continuous | Total area of the dwelling, including garage* | Sales contract |
| EPC | epc | ABCD, E, F, G | Categorical | Energy performance class (EPC) of the dwelling, ranging from A4 to G (best to worst performing respectively). The best-performing EPCs (A4, A3, A2, A1, B, C and D) were grouped into one class, “ABCD”, and the worst-performing classes were kept separate | Sales contract |
| Building age | age | years | Continuous | Age of the dwelling, subtracting the year of construction from 2024 | Sales contract |
| Building ageˆ2 | age2 | years | Continuous | Quadratic term of age | |
| Dwelling type | type | 0, 1, 2 | Categorical | Different types of dwellings (categorical variable): (0) apartment, (1) house and (2) portion of house | Sales contract |
| Bathrooms | bathroom | count | Continuous | Number of bathrooms in each dwelling | Sales contract |
| Mediation | mediation | 0, 1 | Dummy | Dummy indicating whether the sale was mediated by a real estate agency (1) or not (0) | Sales contract |
| Extrinsic variables | |||||
| Number of hotels (250 m radius) | hotel250 | count | Discrete | Number of hotels within a 250 m buffer around each dwelling** | Quick OSM plugin (QGIS) |
| Forest cover (250 m radius) | forest250 | % | Continuous | Percentage of buffer area of 250 m around each dwelling occupied with forest** | Geoportal of Veneto Region |
| Log of distance to ski lift | log_dist_ski_lift | m | Continuous | Distance to the nearest ski lift | QGIS |
| Log of distance to primary road | log_dist_primary_road | m | Continuous | Distance to the nearest primary road | Quick OSM plugin (QGIS) |
| Winter temperature | winterT | °C | Continuous | Average of air temperature at 2 m from the ground for the months of December, January, and February of the last 5 years available (2018–2022) | ARPAV |
| Winter temperature (ˆ2) | winterT2 | °C | Continuous | Quadratic term of winter temperature | |
Note(s): *To account for the differing utility and quality of garage space compared to living accommodation, the property size was calculated using weighted surface areas. Specifically, living space was given a weight of 1.0, covered garages a weight of 0.5 and uncovered garages a weight of 0.1.
The selected 250 m buffer is not intended solely to represent pedestrian movement – as residents in the study area often rely on car transportation – but rather to characterize the immediate environmental context of each property
Each contract contains a series of intrinsic factors, including the dwelling’s transaction price, address, cadastral information, area, blueprint, Energy Performance Certificate (EPC), year of construction and other contract specifications. In addition to the most commonly used intrinsic variables such as the type of dwelling, area, number of bathrooms and age, we included the EPC in our model since recent literature has shown increasing capitalization trends of such aspect in property prices, given the related enhanced indoor environment, energy cost savings and decrease in emissions of greenhouse gases (Fregonara and Rubino, 2021).
We extracted cadastral data for property coordinates to characterize the extrinsic factors and imported them into a GIS platform (QGIS.org, 2024). Neighbourhood and climate variables (extrinsic factors) were selected to capture key factors influencing housing prices while avoiding overparameterization. These factors were derived from accessible data sources concerning accessibility, land use, climate data and recreational amenities. The variables presented in Table 1 are those significantly affecting price.
Given our focus on climatic variables, particularly the impact of winter temperatures on dwelling prices, we obtained historical monthly temperature data from meteorological stations (ARPAV, 2023). Since not all selected municipalities had a station and temperatures can vary considerably with altitude, we opted against interpolating temperatures among stations. Instead, we calculated the altitudinal temperature lapse rates (ATLRs) (Nigrelli et al., 2017) to estimate the mean winter temperature for each dwelling based on its specific altitude (more details in the Supplementary Material).
Since temperature and altitude are highly correlated, including both variables in the model would lead to multicollinearity issues. Therefore, we chose to include temperature as the representative variable, given our research focus. Instead of using altitude directly, the key variables that capture its most relevant effects, such as temperature, distance to ski lifts and distance to primary roads, were incorporated into the model. This approach provides a more comprehensive representation of altitude-related influences on property values, ensuring better model accuracy and interpretability without collinearity issues.
2.4 Models’ specification
Considering that the effect of temperature on housing price might not be linear, with extreme temperatures potentially having different effects compared to mild ones, we included a quadratic term for winter temperatures to estimate parabolic functions. Instead of point-in-time values, we used the five-year average temperature to capture climate amenities like winter temperatures. This timeframe balances relevance and temporal stability without excessive noise, aligning with our focus on short-term climate influences rather than long-term climate change impacts.
Thus, using the semi-log form from (Equation 2), we modelled (Equation 5) to investigate the impact of the selected variables on housing prices. In this model, the coefficients could be interpreted as the percentage change in property price and are estimated by the following formula:
where P/m2 is the dwelling’s transaction price per square meter, β0 is the constant, and β1, …, β13 are the coefficients to be estimated, which could capture the effects of housing attributes. The hedonic models were estimated by using R version 4.2.3 (R Core Team, 2023). The goodness-of-fit of the models was assessed through the F-test, adjusted R-squared test, Akaike information criterion (AIC) and Log-Likelihood. To avoid collinearity, variables presenting a Pearson correlation coefficient greater than 0.5 were removed from the models. We also checked for overall multicollinearity by measuring the condition index. Generally, models presenting a condition index below 15 have weak multicollinearity, those between 15 and 30 present moderate multicollinearity, and those above 30 present strong evidence of multicollinearity (Shrestha, 2020; Young, 2017).
3. Results
The 447 dwellings for the selected period are distributed across ten municipalities of the study area, as illustrated in Supplementary Figure 1. The map shows the location of each dwelling along with its transaction prices. The distribution reveals a concentration of higher property values, particularly in the north and west of the study area, which are close to well-known tourist destinations with panoramic views.
The summary statistics of the variables used for the HPMs are presented in Supplementary Tables 1 and 2 for continuous and discrete variables, respectively. The dwellings’ price ranges from EUR 92 to 6,277 per square meter. The average size of the dwellings was about 90 m2, typically with one bathroom. Regarding the distribution of apartments by EPC, there is a concentration of lower-performing EPC (G-labelled apartments), representing 40% of the sample. This proportion aligns with national-level data (ENEA, 2022).
3.1 Traditional hedonic models
We first developed a classic hedonic model using dwelling prices to assess the potential impacts of the selected variables based on Equation 5. Table 2 presents these results (OLS column). The baseline category for the energy performance variable was EPC = G. Therefore, if a coefficient for a specific EPC is statistically significant and positive, it indicates that a dwelling with that EPC has a higher value than the baseline (EPC = G) caeteris paribus. Similarly, the baseline for the dwelling type was type = 0 (apartments). Lastly, for mediation, the baseline was set as no mediation involved.
Hedonic model results
| Variables | OLS | SAR |
|---|---|---|
| Intrinsic variables | ||
| Property size | −0.003*** | −0.003*** |
| (0.001) | (0.001) | |
| EPC (Ref = G) | ||
| ABCD | 0.324** | 0.337*** |
| (0.0764) | (0.074) | |
| E | 0.226** | 0.233*** |
| (0.0706) | (0.069) | |
| F | 0.202*** | 0.205*** |
| (0.058) | (0.057) | |
| Building age | −0.011*** | −0.012*** |
| (0.001) | (0.001) | |
| Building age (ˆ2) | 0.000*** | 0.000*** |
| 0.000 | 0.000 | |
| Dwelling type (Ref = Apartment) | ||
| House | −0.104 | −0.087 |
| (0.107) | (0.104) | |
| Portion of the house | −0.210*** | −0.200*** |
| (0.052) | (0.051) | |
| Bathrooms | 0.165** | 0.157** |
| (0.055) | (0.054) | |
| Mediation (Ref = No mediation) | 0.121** | 0.119** |
| (0.044) | (0.042) | |
| Extrinsic variables | ||
| Number of hotels | 0.046* | 0.049* |
| (0.020) | (0.019) | |
| Forest cover (250 m radius) | −0.004*** | −0.003** |
| (0.001) | (0.001) | |
| Log of distance to the ski lift | −0.053 | −0.027 |
| (0.029) | (0.029) | |
| Log of distance to primary road | 0.059*** | 0.053*** |
| (0.016) | (0.016) | |
| Winter temperature | −0.136*** | −0.088** |
| (0.031) | (0.032) | |
| Winter temperature (ˆ2) | −0.032** | −0.023* |
| (0.011) | (0.011) | |
| Spatial lag (ρ) | 0.39** | |
| (0.115) | ||
| Constant | 7.730*** | 4.754*** |
| (0.264) | (0.904) | |
| R2 (Pseudo R2 for SAR) | 0.606 | 0.615 |
| Adjusted R2 | 0.592 | |
| Log-Likelihood | −256.117 | −251.826 |
| AIC | 548.235 | 541.65 |
Note(s): Dependent variable = logged dwelling prices; EPC = Energy Performance Certificate; standard errors in parenthesis. *p < 0.05; **p < 0.01; ***p < 0.001
Regarding the intrinsic variables, the model indicates that an additional square meter in the dwelling size results in a lower value per m2, as expected. Age exhibits a parabolic relationship with transaction price: both older, historical properties and newer, more comfortable and energy-efficient buildings tend to command higher unit prices, while mid-aged dwellings are generally less valued. Using Equation 3, we estimate that dwellings with the best energy efficiency performance (EPC = ABCD) experience a 38% increase in value compared to the worst-performing ones.
Intermediate EPC classes, such as E and F, also result in notable increases in value, ranging from 25 to 22%, respectively. Dwelling type also affects price: although houses and apartments show no significant difference (likely due to the small sample of houses), portions of houses are priced 23% lower than apartments, reflecting the dynamics typical of real estate markets in mountain and tourist regions such as the Italian Alps. Apartments are generally easier to manage and less costly to maintain than houses. This greater convenience often justifies a higher unit price, particularly in tourist destinations where properties are frequently purchased by investors or second-home buyers seeking low-maintenance options.
Additionally, properties sold through a mediator, such as a real estate agency, command a 13% price premium. This is unrelated to service costs, which are paid separately and likely reflect agencies’ ability to secure higher prices and lower prices in family-to-family sales without mediation.
As previously noted, temperature was modelled as a parabolic function to capture its non-linear impact on prices. Milder winter temperatures were expected to increase property values due to tourist demand. The negative coefficients for winter temperature and its quadratic term indicate that beyond an average of −2 °C, higher temperatures become a disamenity, likely due to reduced snow reliability for winter sports. Conversely, extremely low temperatures also lower prices, likely due to thermal comfort concerns (Figure 3).
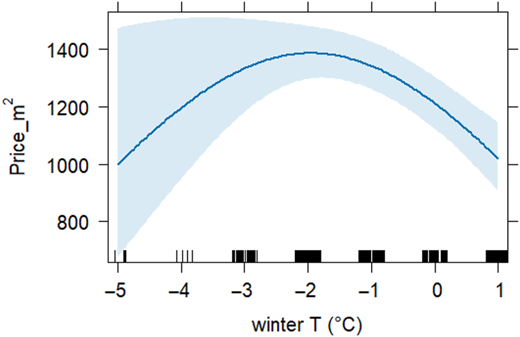
Estimated effect of winter temperature on property price in the study area. The plot illustrates the relationship between the property values (in €/m2) and the winter temperatures (in °C). Source: Authors’ own work. The analysis was conducted using R version 4.2.3 (R Core Team, 2023)
Estimated effect of winter temperature on property price in the study area. The plot illustrates the relationship between the property values (in €/m2) and the winter temperatures (in °C). Source: Authors’ own work. The analysis was conducted using R version 4.2.3 (R Core Team, 2023)
The environmental variable (forest cover within 250 m) negatively impacts price, with each 1% increase reducing price per m2 by 0.4%. Though counterintuitive, this likely reflects the peripheral location of forested areas and potential obstructions to sunlight and views. Including environmental and climate variables improves the model’s explanatory power by 3%, raising R2 from 0.58 to 0.61. The model treats hotel presence as an amenity, with each additional hotel within 250 m increasing price by 5%, reflecting tourism appeal and services in certain municipalities. The distance to the nearest ski lift has a negative effect, with property prices decreasing by 5% per 1% increase in distance.
The distance to the closest primary road shows a positive coefficient, indicating that a greater distance from the road increases property price by 6% per 1% increase. This likely reflects the disamenities of noise, air pollution and visual barriers near primary roads, which reduce landscape quality.
3.2 Spatial effects on hedonic models
Traditional hedonic models often overlook spatial autocorrelation, where nearby properties influence a dwelling’s value. We incorporated spatial analysis techniques into our hedonic models to address this issue. Our first result from this analysis concerns the quantification of spatial autocorrelation using the Global Moran’s Index (MI) to quantify its effect. The results confirm spatial clustering as the Global MI shows a positive and statistically significant coefficient of 0.115 (p-value <0.05 and z-value = 15.201). Supplementary Figure 2 presents the resulting scatterplot. The plot is divided into quadrants to analyse spatial autocorrelation, identifying four types: high-high, low-low, high-low and low-high. A Local Indicators of Spatial Association (LISA) test further visualizes this, highlighting clusters shown in Figure 4. The map reveals hot and cold spots in the real estate market, with high-price clusters (in red) in Falcade, Agordo and areas near Cortina d'Ampezzo, while cold spots (in blue) are mainly in the centre and south.
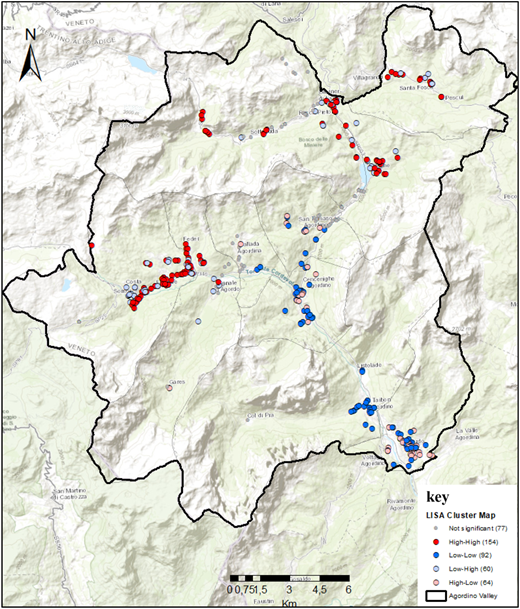
Cluster map of hot spots and cold spots in the study area. 370 of the observations in the sample show spatial autocorrelation, represented by categories such as high-high (154), high-low (64), low-low (92), and low-high (60). This indicates clusters of similar or dissimilar property values across neighbouring locations. Source: Authors’ own work. The analysis was conducted using GeoDa™ (Anselin et al., 2006)
Cluster map of hot spots and cold spots in the study area. 370 of the observations in the sample show spatial autocorrelation, represented by categories such as high-high (154), high-low (64), low-low (92), and low-high (60). This indicates clusters of similar or dissimilar property values across neighbouring locations. Source: Authors’ own work. The analysis was conducted using GeoDa™ (Anselin et al., 2006)
Moran’s I test offers a global measure of spatial autocorrelation. However, it offers limited guidance concerning the most suitable spatial model for our data. In contrast, the Lagrange Multiplier test (LM) helps identify the suitable spatial model. The LM test results in Supplementary Table 3 confirm that the SAR model fits the spatial pattern of the data. The LM tests produced significant results for both spatial and robust lag terms, with p-values of less than 0.01. This suggests that neighbouring dwelling prices significantly influence each other. Based on these results, we selected the SAR specification for the model, as shown in column 3 of Table 2.
The spatial lag coefficient is highly significant, highlighting the importance of considering spatial dependencies when analysing property values. Specifically, the spatial lag coefficient is 0.39 (p < 0.01). This result confirms the presence of spatial dependence and the need to use spatial specifications in hedonic modelling.
In the SAR model, intrinsic factors such as property size, EPC ratings, building age, and the number of bathrooms consistently significantly affected dwelling prices. However, the SAR model revealed spatial dependencies that the OLS model might have overlooked. For instance, extrinsic variables like the winter temperature and distance to primary road showed different results, indicating spatial variations in their impact on property values. The distance to the nearest ski lift showed a negative effect in the OLS, but in the SAR, this variable is not statistically significant. Therefore, due to their ability to account for spatial autocorrelation, spatial models tend to moderate the effect of other variables that have a greater impact on OLS models.
The differences in the coefficients emphasize the importance of considering spatial dependencies. In the OLS model, the winter temperature coefficient was substantially higher (−0.136 and −0.032 for the quadratic term) compared to the SAR model (−0.088 and −0.023 for the quadratic term). This suggests that higher average winter temperatures are associated with lower property prices, but this effect is less pronounced when spatial autocorrelation is considered.
This reduction in coefficients in the SAR model occurs because the OLS model overstates the impact of variables by ignoring neighbouring property values. The SAR model better captures the spread of these effects across related properties, leading to more realistic estimates. However, we are primarily observing their direct effects on the dependent variable. Thus, we capture the indirect effects by considering neighbouring observations using the spatial multiplier, and we present these results in Supplementary Table 4. When considering total effects, the coefficients’ magnitude is higher than in the OLS model.
Based on the goodness of fit criteria in Table 2, the SAR model outperforms the OLS model in explaining property value variability. The SAR model slightly improves the R2 value and significantly improves the Log-Likelihood and AIC values. However, it is important to note that the differences in coefficient estimates between the models should not be interpreted as a correction of upward bias in OLS estimates, but rather as a reflection of how explanatory power is redistributed when spatial dependence is explicitly modelled. Since our data shows that spatial autocorrelation exists, the SAR model’s inclusion of the spatial lag component (WP) allows for the proper attribution of effects to spatial processes. Thus, the spatial lag term captures how outcomes in one location are influenced by outcomes in neighbouring locations, accounting for spatial spillover effects that would otherwise be erroneously attributed to the explanatory variables in a standard OLS framework.
4. Discussion and conclusions
This study examines how climate and environmental factors impact housing values in alpine urban markets, a topic previously unexplored in the Alps, using real transaction data. We analysed property prices from January 2022 to November 2023 in the Agordino Valley, Northeast Italy, through classic and spatial hedonic models. Our findings show a significant decrease in property prices with higher temperatures, confirming the impact of climate amenities on property values. First, we provide empirical evidence that climate effects are statistically significant from zero, pointing to a decrease in price with higher temperatures at lower altitudes. These findings may be attributed to the preference for milder temperatures and snow reliability for winter sports activities. The impact of climate amenities on property prices depends on the dwellings’ location.
Notwithstanding that, a direct comparison with other studies in different geographic areas may not be feasible due to the unique characteristics and climatic considerations of each region; however, similar overall trends can be found in the literature. For example, in the US, Albouy et al. (2016) found that extremely hot summers and cold winter temperatures are considered disamenities, with excessive heat having a stronger negative impact than cold temperatures. Other US-based studies using HPM also showed a similar negative effect of temperature on housing prices, indicating that higher summer temperatures correspond to lower prices [Cragg and Kahn (1997), Koirala and Bohara (2013), Roback (1982), Sinha et al. (2021) and Sussman et al. (2014)]. This trend is also evident in Europe. For instance, in Germany, Rehdanz and Maddison (2004) found that house prices are higher in areas with lower July temperatures. In Italy, Maddison and Bigano (2003) found that higher summertime temperatures were connected to reduced welfare.
Our findings, however, differ from most studies regarding the effect of winter temperature. While previous research (Koirala and Bohara, 2013; Rehdanz, 2006; Rehdanz and Maddison, 2004; Sinha et al., 2021; Sussman et al., 2014) suggests higher winter temperatures increase property prices, our results show the opposite. This could be due to the characteristics of the study area, which is a mountain region known for winter sports activities. In such areas, higher winter temperatures could have a negative effect on the availability of winter sports and, in turn, on property prices. In fact, our results are consistent with a study by Galinato and Tantihkarnchana (2018), who also observed that increases in winter temperature led to decreased housing prices in mountain areas of the United States.
Our second insight highlights the negative impact of forest cover on property prices. This is likely due to the preference for traditional alpine landscapes, with panoramic views of a mix of meadows and forest patches. This relationship has been discussed in previous research (Schirpke et al., 2016; Tattoni et al., 2021; Tempesta et al., 2024; Tempesta and Vecchiato, 2017, 2018; Vecchiato and Tempesta, 2013; Whitaker, 2023). Studies also show that land abandonment in Italian mountain areas correlates with increased forest cover (Campagnaro et al., 2017; Garbarino et al., 2020; Sitzia and Trentanovi, 2011; Zatelli et al., 2022). If this trend continues, coupled with the favoured climate conditions for the development of some tree species beyond the current tree line (Noce et al., 2023; Tattoni et al., 2017), the negative impact on property prices may intensify. Furthermore, forest cover may proxy other factors, such as the location of the dwellings on the outskirts of municipalities, where higher forest cover and lower property prices are typically observed.
Third, the disamenity of road proximity, or the positive effect on prices of properties far from a primary road, is a very well-explored effect in the literature. Primary roads are linked to visual, noise, and air pollution, reducing residents’ welfare (Andersson et al., 2009; Iacono and Levinson, 2011; Kilpatrick et al., 2020; Kim et al., 2007; Li and Saphores, 2012; Yang et al., 2018).
As a fourth insight, our study shows that spatial hedonic models effectively capture how neighbouring property values influence housing prices. This improves the accuracy and reliability of our findings. Recent literature highlights the importance of incorporating spatial variables in hedonic models (Dubé and Legros, 2014; Giuffrida et al., 2024; Kim et al., 2020; Łaszkiewicz et al., 2022; Liu et al., 2020; von Graevenitz and Panduro, 2015; Zheng et al., 2024). This evolution represents a crucial methodological advancement in real estate research (Khoshnoud et al., 2023).
An intrinsic factor significantly impacting property price is the EPC, a measure of a property’s energy efficiency. The substantial price premium observed for the highest-performing dwellings is related to the Energy Performance of Buildings Directive (EPBD), which was translated into Italian law by the Legislative Decree n.192 of 19 August 2005, modified by Law n.90 of 3 August 2013 (Repubblica Italiana, 2013). Several studies have documented the capitalization of EPC in Italy since then (Barreca et al., 2021; Bisello et al., 2020; Bottero et al., 2018; Copiello and Coletto, 2023; Fregonara et al., 2017; Massimo et al., 2022; Morano et al., 2020). The 2024 revision of the EPBD (EU/2024/1,275) (European Parliament and Council, 2024), aimed at meeting European Green Deal goals, could further boost premiums for high-performing dwellings.
The findings of this study have practical implications for property market stakeholders in alpine regions. For real estate practitioners, the results highlight the need to incorporate climate and environmental amenities into valuation models, especially in tourism-driven markets. For investors, the evidence of climate gentrification points to opportunities in higher-altitude, climate-resilient locations suited for year-round tourism. The strong price premium for energy-efficient properties also suggests that upgrading to higher energy standards can enhance value and future-proof investments. For planners and advisors, the negative effect of forest cover – linked to land abandonment – underscores the importance of preserving traditional alpine landscapes, while the disamenity of road proximity calls for a careful balance between accessibility and environmental quality. As environmental and climate amenities increasingly influence housing demand, adapting valuation, planning and investment strategies becomes essential. This study provides a framework for integrating these factors into real estate decision-making. It is important to keep in mind that climate amenities and climate change operate on different time scales, and this study focused on climate amenities. Future research could build upon this framework to explore the potential long-term impacts of climate change, taking into account factors such as shifting demand, rising insurance costs and other climate-related risks.
The limitations of this study stem from its reliance on publicly available databases and GIS data and their resolution, leading to the utilization of only variables that could be measured from open-source shapefiles in the models. Another important limitation arises from the sales contracts since it is not possible to differentiate between residential and vacation property sales. Since these two types of buyers’ preferences may differ, our models may not fully capture these nuances as they were considered collectively. Additionally, the sales contracts lacked detailed information on intrinsic property characteristics, such as condition and renovation status, which were not included in the model. As a result, the observed effect of the EPC on property prices may reflect the influence of unaccounted variables. Economic factors and other broader influences on housing prices were also not considered in this study. Future research could address these limitations by utilizing spatial models and more detailed climatic and environmental data, such as high-resolution open-source interpolated snow coverage and snow days.
We extend our sincere gratitude to Damiano Vettoretto for his invaluable contributions to the data collection phase of this research. Additionally, we wish to express our appreciation to Professor Francesco Pagliacci for generously sharing his expertise in spatial modeling, which significantly enhanced the quality of this paper.
Note
As a sensitivity analysis, we also employed distance-based criteria using k-nearest neighbours (K = 8) that corresponds to the median number of neighbours in a queen contiguity matrix constructed for a Thiessen polygon tessellation of the point locations, and a specified distance band (d = 2 Km).
The supplementary material for this article can be found online.

