

Non-financial misconduct encompasses breaches of laws and standards related to occupational safety, wage and hour compliance and environmental regulations. This study aims to examine how different forms of non-financial misconduct affect audit fees.
The authors refer to the Violation Tracker data set and a sample of 10,233 US firm-year observations from 2007 to 2022. They use regression analysis to test the association between the natural logarithm of audit fees and two proxies for non-financial misconduct: the natural logarithm of penalty amount and the natural logarithm of the number of penalties.
The authors find that audit fees are significantly higher for firms involved in non-financial misconduct, consistent with audit risk pricing theories. Further analysis indicates that the positive association with audit fees is most pronounced for misconduct in the “other” category, which includes violations related to government contracting, health care, competition and miscellaneous issues. This finding suggests that auditors perceive these types of violations as carrying higher litigation or reputational risk. The findings of this study also indicate that CEO turnover moderates this relationship, a result that adds to the corporate governance literature by showing how changes in leadership can alter the risk profile perceived by auditors. Finally, the authors find that the fee premium following non-financial misconduct reflects greater audit effort, elevated engagement risk for both high-reputation auditors and those serving high-visibility clients and increased client demand for industry specialist auditors.
To the best of the authors’ knowledge, this study is the first to offer a nuanced perspective on how auditors evaluate and incorporate non-financial risk into their fee assessments, providing valuable insights for both researchers and practitioners.
1. Introduction
Research exploring the relationship between corporate misconduct and audit pricing is not new. The majority of these studies focus on financial misconduct, revealing that auditors tend to assess higher litigation risk when a company is implicated in financial misconduct (Feldmann et al., 2009; Lee and Ha, 2021; Barua and Smith, 2012) [1]. However, this focus overlooks another significant source of risk. In addition to financial misconduct, firms may also engage in non-financial misconduct, including violations related to worker safety, wage and hour regulation and environmental compliance. While non-financial misconduct may not result in accounting irregularities, it has adverse effects on a company’s reputation, future performance and perceived integrity. Consequently, a question arises as to whether auditors respond when their clients are involved in non-financial misconduct.
Corporate regulations and laws limit the actions that companies can legally undertake to improve their profitability. As a result, firms are sometimes tempted to resort to unethical or illegal practices that pose significant risks to environment, employees and customers (Kini et al., 2017; Cohn and Wardlaw, 2016; Caskey and Ozel, 2017; Raghunandan, 2021). In recent years, there has been a growing incidence of non-financial misconduct cases from high-profile companies, including the 2015 Volkswagen emissions case, the 2017 Duke Energy oil spill, the 2019 Apple product obsolescence case and the 2024 Mercedes-Benz Group AG anti-union conduct. Evidence shows that companies face significant and increasing costs as a result of non-financial misconduct [2]. For instance, the Environmental Protection Agency reports a sharp increase in penalties, with 2024 fines reaching over $136m, three times the amount in 2016.
Despite its practical significance, academic research on the consequences of non-financial misconduct remains limited. We address this gap by examining one important firm-level cost: audit fees. Although non-financial misconduct is not the direct focus of the audit, it can heighten auditors’ assessment of overall engagement risk. Prior research links non-financial misconduct to an unethical corporate culture (Caskey and Ozel, 2017; Feng et al., 2015), a greater likelihood of financial misstatements (Raghunandan, 2021; Kedia et al., 2017; Miller, 2024) and increased exposure to litigation and regulatory scrutiny (Li and Raghunandan, 2021), all of which elevate overall firm risk. As a result, non-financial misconduct can serve as a visible signal of underlying managerial integrity and the effectiveness of internal controls, two factors central to auditors’ risk assessments. Evidence suggests that concerns about managerial integrity lead auditors to view financial reporting as more aggressive or opportunistic, thereby increasing their perceived misstatement risk (Beaulieu, 2001). Similarly, weak internal controls heighten the likelihood that errors or irregularities occur and remain undetected (Bae et al., 2019; Hogan and Wilkins, 2008; Munsif et al., 2011). In response to heightened risk, auditors increase the nature, timing and extent of audit procedures, resulting in greater audit effort and higher fees (Simunic, 1980; Bell et al., 2001). Accordingly, we expect that firms involved in non-financial misconduct will be associated with higher audit fees.
For the empirical analysis, we use 10,233 US firm-year observations from 2007 to 2022 to examine the link between non-financial misconduct and audit pricing. We obtain non-financial misconduct data from the Violation Tracker data set, which provides comprehensive corporate misconduct information. Our results show that auditors charge higher fees for clients involved in non-financial misconduct. Furthermore, we find that all four categories of non-financial violations (i.e. labor-, consumer-, environment-related and other) are positively associated with audit fees. Consistent with the argument that executive leadership changes can reduce auditors’ perceived risk from past fraudulent activities (Feldmann et al., 2009), we find that CEO turnover moderates the increase in audit fees for affected firms. Finally, we examine the mechanisms linking non-financial misconduct to audit fees. Using interaction analyses and a staged timing design, we show that auditors respond to such misconduct by increasing audit effort and by pricing higher expected engagement risk, particularly when auditor reputation risk is high or clients are highly visible. We further document that firms strategically switch to industry specialist auditors following misconduct, contributing to the observed audit fee premium.
Although our research complements prior studies on the relationship between Environmental, Social and Governance (ESG) performance and audit fees, our non-financial misconduct variable is a better indicator than the traditional ESG or Corporate Social Responsibilities (CSR) metrics. As Kumar (2023) notes, ESG and CSR ratings provided by consulting firms are inherently subjective and represent a composite of both positive and negative aspects of corporate culture. Moreover, ESG incidents reported in the media may be biased toward larger firms that attract greater public attention, thereby overlooking similar issues among smaller or less visible companies. In contrast, corporate non-financial misconduct is derived from official enforcement records issued by federal, state and local regulatory agencies, offering more objective and direct measure of adverse corporate behavior. Consistent with this distinction, Raghunandan and Rajgopal (2023) highlight the difficulty of precisely matching ESG-related media reports from RepRisk with specific regulatory violations documented in Violation Tracker.
Overall, our study makes valuable contributions to two strands of literature. First, this study contributes to the limited but growing literature on the consequences of non-financial misconduct (Kedia et al., 2017; Miller, 2024) by examining a key indirect outcome: audit fees. We document that the consequences of non-financial misconduct extend beyond regulatory fines, reputational damage and negative stock market reactions to also include increased audit costs. Second, we contribute to the body of research concerning audit fees, which traditionally concentrates on the audit risk linked to financial misstatements (Palmrose, 1988; Pratt and Stice, 1994; Simunic and Stein, 1996; Seetharaman et al., 2002). By documenting a positive association between non-financial misconduct and audit fees, our findings indicate that auditors perceive and price risks arising from a firm’s operational and ethical conduct, not just its financial reporting.
The rest of this paper is constructed as follows. In Section 2, we review related research and develop our hypothesis. We describe the sample in Section 3 and explain the research model in Section 4. The results, additional analyses and robustness analyses are presented in Sections 5 through 7, respectively. We conclude this paper in Section 8.
2. Related literature and hypothesis
2.1 Literature review
2.1.1 Non-financial misconduct.
Non-financial misconduct encompasses breaches of laws and standards related to occupational safety, wage and hour compliance and environmental regulations. While anecdotal evidence of non-financial misconduct is substantial, empirical research on this topic remains limited. Currently, very few researchers focus on the consequences of non-financial misconduct. These studies propose that the interplay of internal control and corporate culture can facilitate different forms of misconduct, leading to a crossover effect between financial and non-financial misconduct (Caskey and Ozel, 2017; Feng et al., 2015). Consistent with the theory, few studies document a positive association between firms’ involvement in non-financial misconduct and financial reporting issues (Biggerstaff et al., 2015). Kedia et al. (2017) and Miller (2024) illustrate a positive link between a firm’s prior compliance record and its tendency to misrepresent its financial statements. Other studies focus on environmental performance and document the significant impact of noncompliance with environmental regulations on the financial reporting quality (Altamuro et al., 2022; Kedia et al., 2017; Lemma et al., 2020). Using wage theft as a proxy for controversial firm activity, Raghunandan (2021) finds a positive association between wage-related violations and financial misstatements.
In addition, non-financial misconduct also undermines the firm’s future performance and long-term sustainability. Cohn and Wardlaw (2016) demonstrate that workplace injuries negatively affect firm value by signaling deterioration of human capital. Environmental infractions, such as excessive sulfur dioxide or carbon emissions, are treated as contingent liabilities and have been shown to reduce firm valuation (Matsumura et al., 2014). Operational failures leading to product recalls or safety issues can further damage reputation and are often interpreted as precursors to financial losses (Chen et al., 2009). Recently, Li and Raghunandan (2021) examine and find that non-financial misconduct increases litigation and regulatory risk by exposing firms to investigations, legal proceedings and heightened media scrutiny. Taken together, the current literature suggests that non-financial misconduct can impose severe indirect costs on firms.
2.1.2 Audit fees.
Audit fees refer to the compensation paid to an auditor for the provision of audit services. Extant auditing research highlights audit risk as a key determinant of audit fees (DeFond and Zhang, 2014; Simunic and Stein, 1996). Notably, these studies document that, in situations where clients pose higher risks, auditors may opt to raise their billing rates (Bedard and Johnstone, 2004; Gul and Goodwin, 2010; Fargher et al., 2014). Supporting this notion, many studies document a higher audit fee for clients associated with higher financial reporting risks. For instance, audit fees are higher for firms engaging in earnings management (Abbott et al., 2006; DeFond et al., 2016), exhibiting internal control deficiencies (Hogan and Wilkins, 2008; Lee, 2018) and experiencing agency problems (Griffin et al., 2010).
In addition, risks associated with clients’ operating environment also matter in audit pricing. For example, Lyon and Maher (2005) document that auditors perceive higher risk when their client is involved in illegal activities, leading to higher audit fees. On similar lines, Jha et al. (2021) and Xu et al. (2019) document that auditors charge more audit fees when a company is headquartered in an area with a higher level of corruption. Gul (2006) argues that political relationships cause instability during a financial crisis, and as a result, auditors charge higher audit fees from politically connected clients (Ahmad et al., 2022). Finally, numerous additional studies reveal that auditors tend to impose higher audit fees when companies operate within controversial industries such as alcohol, firearms, gambling, military, nuclear power and tobacco (Koh and Tong, 2013; Leventis et al., 2013).
Recently, an emerging stream of literature emphasizes that auditors are increasingly attentive to non-financial information including a firm’s adherence to ethical standards, CSR and broader ESG practices when determining audit fees. For instance, Song et al. (2023) find that firms with higher ESG ratings tend to incur lower audit fees, suggesting that strong ESG performance serves as a signal of reduced audit risk. In contrast, Du et al. (2020) document that auditors impose higher fees on firms with poor CSR performance, reflecting the increased perceived risk and the additional audit effort required when clients fail to meet ethical and social expectations. Extending this line of inquiry, Yao et al. (2023) investigate Chinese firms and find that those involved in environmental violations are subject to significantly higher audit fees.
We extend the literature by examining how non-financial misconduct influences audit fees, a topic that remains largely unexplored. Auditing standards (e.g. PCAOB AS Number 9) require auditors to consider industry-specific regulations and their potential implications for financial reporting, suggesting that such misconduct could affect audit risk assessments and, consequently, audit fees. Therefore, we believe that understanding how auditors evaluate and incorporate the risk implications of corporate non-financial misconduct into their audit judgments and pricing decisions is of critical importance.
2.2 Hypothesis
Although non-financial misconduct arises from operational systems and is not the direct subject of the audit, it may signal broader organizational risks and elevates auditors’ assessment of overall engagement risk. Specifically, it provides salient information about management integrity, suggesting that management may have a higher tolerance for unethical or noncompliant behavior, an important input into the auditor’s assessment of inherent risk. Auditors interpret these signals as increasing the likelihood of material misstatement, prompting adjustments to audit planning, including expanded substantive procedures and greater engagement effort. Consistent with this view, extant literature shows that auditors charge higher audit fees when they perceive a firm’s chief financial officer to have low rather than high integrity (Beaulieu, 2001).
In addition, non-financial misconduct may signal weaknesses in internal controls. When internal controls are ineffective, the likelihood that errors or irregularities occur and remain undetected increases, thereby elevating auditors’ assessments of inherent and control risk (Hogan and Wilkins, 2008; Krishnan, 2005). In response to heightened risk, auditors expand substantive testing and increase overall audit effort, which in turn leads to higher audit fees. Bedard and Johnstone (2004), as well as Houston et al. (1999), show that fraud-risk cues and higher inherent risk lead auditors to increase planned testing and engagement effort. Prior studies further document a positive association between inherent risk and audit costs (Bell et al., 2001; Simunic, 1980). Ashbaugh-Skaife et al. (2008) find that internal control weaknesses are associated with significantly higher audit fees, as auditors must compensate for unreliable controls.
Taken together, this literature establishes a positive association between audit risk and audit fees. Accordingly, we predict that non-financial misconduct is positively associated with audit fees:
Audit fees are positively associated with non-financial misconduct.
3. Research design
To examine the relation between non-financial misconduct and audit fees, we adopt the ordinary least square model:
3.1 Dependent variable
We use LAF, measured as the natural logarithm of a client firm’s audit fees in the current year, as the dependent variable.
3.2 Test variable
The variable of interest, MIS, represents the client firms’ non-financial misconduct that occurred in the prior year. Non-financial misconduct refers to violations not related to accounting fraud or deficiencies, anti-money-laundering deficiencies, insider trading, investor protection violations, etc [3]. These violations involve various categories, including labor-related (e.g. unsafe workplace conditions), consumer-related (e.g. consumer protection violation) and environmental-related (e.g. improper disposal of hazardous materials). We measure MIS alternatively as the natural logarithm of the total monetary penalties incurred by a client firm because of non-financial violations in the previous year (LNPEN) or the natural logarithm of the total number of non-financial violations by a client firm in the prior year (LNNUM). While both these proxies do not necessarily indicate higher audit risk for the company, Miller (2024) concludes that the magnitude of penalties is significantly associated with future restatement. As restatement increases auditors’ financial reporting risk, we posit that LNPEN and LNNUM will be positively associated with audit fees.
3.3 Client-specific variables
We incorporate controls for various factors that can influence audit fees in Model 1. Previous studies, such as Blankley et al. (2012), Johansen and Pettersson (2013), Hribar et al. (2014) and Kalelkar and Xu (2021), document that audit pricing is significantly affected by audit risks and audit complexity. Therefore, we first control for audit risk factors, which include client firms’ liquidity (LIQ, CA_TA and INVREC), profitability (ROA and LOSS), intangible intensity (INTANG), the issuance of going-concern opinions (GC), the presence of internal control material weaknesses (MW), financial restatements (RESTATE), leverage (LEV) and financial condition (Z). We measure LIQ (CA_TA) as the ratio of current assets to current liabilities (total assets) and INVREC as the proportion of total assets allocated to receivables and inventory. ROA denotes return on assets and is calculated as operating income after depreciation divided by total assets, whereas LOSS equals 1 if a client firm reports negative operating income after depreciation in the current year and 0 otherwise. INTANG is defined as intangible assets divided by total assets. Three indicator variables, namely, GC, MW and RESTATE, equal 1 if a client firm receives a going-concern opinion, reports any material weakness in its internal control system and announces a financial restatement in the current year, respectively, and 0 otherwise. LEV denotes the total liabilities divided by total assets. Finally, Z represents a firm’s bankruptcy score, estimated using Altman’s (1968) model.
In addition, we include controls for the size of the client firm (SIZE), merger and acquisition activity (MERGER), foreign operations (FRGN) and the number of business and geographic segments (LNBUS and LNGEO) in our model. SIZE represents the natural logarithm of a client firm’s market value of equity. MERGER equals 1 if a firm engaged in any merger or acquisition activity in the current year and 0 else. FRGN takes the value of 1 if the firm has foreign operations and 0 otherwise. LNBUS (LNGEO) is defined as the natural logarithm of the number of business (geographic) segments in a client firm.
3.4 Auditor-specific control variables
Considering that auditor characteristics can impact audit fees (Hay et al., 2006; Mitra et al., 2019; Kalelkar and Xu, 2021), we control for the following auditor-related factors: auditor busyness (BUSY), auditor reputation (BIG4), auditor specialization (SP), auditor tenure (LNTENURE), auditor change (AUD_CH) and non-audit fees (LNAF) in the model. BUSY equals 1 if the firm’s fiscal year ends in December and else 0. BIG4 takes the value of 1 if the auditor is a Big 4 auditor and 0 otherwise. SP is another dummy variable, set to one if the auditor is both a city-level and a national-level industry expertise and AUD_CH equals 1 in cases of an auditor switch in the current year and 0 otherwise. LNTENURE is calculated as the natural logarithm of the number of years an audit office served as the client’s auditor. Finally, LNAF serves as a proxy for knowledge spillover between non-audit and audit services and is measured as the natural logarithm of non-audit fees.
3.5 Executive-specific control variables
Prior research examining executive attributes (Krishnan and Wang, 2015; Kalelkar and Khan, 2016) highlight that CEO characteristics, specifically CEO duality (DUAL) and CEO financial expert (CEOEXP), can affect firms’ audit fees. Accordingly, we include these two executive-specific variables as control factors in the model. We define DUAL as 1 if the CEO also serves as the board chair of the same client firm. CEOEXP equals 1 if the CEO is a financial expert and 0 otherwise.
3.6 Fixed effects, clustering and winsorization
Our model incorporates both year and industry fixed effects. Industry dummies are identified using the two-digit standard industrial classification. We also cluster the estimated standard errors at the firm level to account for potential autocorrelation of the residuals within firms overtime. Additionally, all continuous variables are winsorized at 1% and 99% to limit the influence of extreme values in a data set. The definitions for all variables used in our empirical analyses can be found in Appendix.
4. Sample selection
Table 1 Panel A presents a summary of the sample selection process. We began our sample selection with 144,095 US firm-year observations from 2007 to 2022 from the Audit Analytics database. We then applied the following exclusion criteria to arrive at our final sample:
Sample selection and distribution
| Sample selection processa | Firm-yearObservations | |||
|---|---|---|---|---|
| Panel A: Sample selection | ||||
| Observations from 2007 to 2022 in Audit Analytics with audit fees data in US firms | 144,095 | |||
| Less: | ||||
| Observations missing data from Compustat | 76,685 | |||
| Observations missing data from Execucomp | 40,496 | |||
| Observations missing data from BoardEx | 7,119 | |||
| Financial and Utility Firms (SIC 6000–6999 and SIC 4900–4949) | 4,831 | |||
| Observations with insufficient data to calculate control variables | 4,731 | |||
| Final sample | 10,233 | |||
| LNPEN (million) | LNNUM (no.) | |||
|---|---|---|---|---|
| Industry | N | % | Mean | Mean |
| Panel B: Sample distributions by industries | ||||
| Agriculture, forestry and fishing | 32 | 0.31 | 4.395 | 0.844 |
| Mining | 431 | 4.21 | 2.289 | 2.582 |
| Construction | 87 | 0.85 | 0.481 | 1.770 |
| Manufacturing | 5,829 | 56.96 | 2.240 | 1.051 |
| Transportation and utilities | 493 | 4.82 | 6.129 | 3.724 |
| Wholesale | 514 | 5.02 | 2.135 | 0.807 |
| Retail | 869 | 8.49 | 3.512 | 2.306 |
| Services | 1,970 | 19.25 | 1.936 | 0.414 |
| Others | 8 | 0.08 | 2.430 | 4.625 |
| Total | 10,233 | 100.00 | 2.465 | 1.224 |
| Types of misconduct | Firm-year observations | Total count of misconduct | Total penalties (million) | |
|---|---|---|---|---|
| Panel C: Sample distributions by types of non-financial misconduct | ||||
| Labor | 2,889 | 8,048 | 3,501.54 | |
| Consumer | 274 | 274 | 490.14 | |
| Environment | 1,562 | 3,062 | 671.74 | |
| Other | 431 | 555 | 8,248.51 | |
aTo assess potential selection bias, we compare firm size and profitability between our final sample (N = 10,233) and the full Compustat universe (N = 128,739). We find that our final sample firms are significantly larger (Mean SIZE = 8.224 vs 5.680) and more profitable (Mean ROA = 0.111 vs –0.374), both significant at p < 0.001. This limitation arises from the data requirements across multiple databases – AuditAnalytics, Compustat, Execucomp and BoardEx. Consequently, while our sample may not generalize to smaller or financially constrained firms, the findings remain robust and most relevant to large, well-established firms with complex governance structures that face greater auditor scrutiny and higher audit fees. Panel B: The industry classification follows Dopuch et al. (1987): Agriculture, forestry and fishing (SIC code 100–999); Mining (SIC code 1000–1499); Construction (SIC code 1500–1999); Manufacturing (SIC code 2000–3999); Transportation and utilities (SIC code 4000–4999); Wholesale (SIC code 5000–5199); Retail (SIC code 5200–5999); Services (SIC code 7000–8999); Others (SIC code < 100 or > 8999). The definition and measurement of the variables are described in Appendix. Panel C: The Violation Tracker database categorizes non-financial violations into Eight groups: competition, consumer protection, employment, environment, government contracting, health care, workplace safety and miscellaneous. Following Raghunandan (2021), employment and workplace safety are grouped under labor, while consumer protection and environment remain unchanged. Government contracting, health care, competition and miscellaneous are categorized as other
We excluded 76,685 firm-year observations because of a lack of matching financial information in the Compustat database. We then use Violation Tracker, compiled by Good Jobs First from over 400 regulatory agencies, to identify instances of non-financial misconduct in Compustat firm-year data. [4],[5] Specifically, we classify a firm-year in Compustat as involved in non-financial misconduct if a match is found in the Violation Tracker data set and as 0 otherwise.
We excluded observations with missing CEO-related information from Execucomp and BoardEx, leading to a loss of 7,119 and 4,831 observations, respectively.
We eliminated 4,731 financial and utility firm-year observations (SIC codes 6000–6999 and 4900–4949) because these industries are highly regulated and have unique accounting practices that may bias the results.
We excluded observations with missing data for control variables, resulting in a final sample of 10,233 firm-year observations.
In Panel B of Table 1, we present the distribution of our sample firms across different industries. Most of our sample firms operate in Manufacturing (56.96%), followed by Services (19.25%), Retail (8.49%) and Wholesale (5.02%). In addition, we provide information on the average monetary penalties (frequencies) resulting from non-financial violations by industry. We observe that the Transportation and Utilities sector (LNPEn = 6.129) experiences the highest average penalties because of non-financial violations, while the Construction sector (LNPEn = 0.481) pays the lowest average monetary penalties. Regarding the number of non-financial violations, the Transportation and Utilities sector (LNNUM = 3.724) has the most, while the Services sector (LNNUM = 0.414) has the least frequent occurrences.
Table 1 Panel C summarizes the distribution of non-financial misconduct by categories. Of 10,233 firm-year observations, 3,715 are associated with non-financial misconduct across various categories [6]. The Violation Tracker database categorizes non-financial violations into eight groups: competition, consumer protection, employment, environment, government contracting, health care, workplace safety and miscellaneous. Following Raghunandan (2021), we group employment and workplace safety as labor-related, keep consumer protection as consumer-related, environment as environment-related and government contracting, health care, competition and miscellaneous as other-related misconduct. “Other” misconduct has the highest total penalties at $8.25bn, despite a relatively small number of incidents (555) and observations (431), indicating high-cost violations. Labor-related misconduct has the highest number of incidents (8,048) and firm-year observations (2,889), but relatively lower total penalties ($3.5bn).
5. Empirical results
5.1 Descriptive statistics
Table 2 presents the descriptive statistics of the variables used in Model 1. The dependent variable, audit fees (LAF), has an average value of $4.3m (log-transformed mean = 14.83) and shows substantial variation (standard deviation = $4.6m). For non-financial misconduct, the average value of LNPEN corresponds to $2.47m in raw terms (log-transformed mean = 4.325). The average number of penalties (LNNUM) is about 1.2 cases per firm-year (log-transformed mean = 0.439), with most firms receiving none (median = 0).
Descriptive statistics of variables
| Variable | N | Mean | SD | Q1 | Median | Q3 |
|---|---|---|---|---|---|---|
| LAF | 10,233 | 14.826 | 0.941 | 14.160 | 14.771 | 15.458 |
| LAF ($US million) | 10,233 | 4.304 | 4.619 | 1.411 | 2.600 | 5.167 |
| LNPEN | 10,233 | 4.325 | 5.949 | 0.000 | 0.000 | 10.101 |
| LNPEN ($US million) | 10,233 | 2.465 | 12.794 | 0.000 | 0.000 | 0.024 |
| LNNUM | 10,233 | 0.439 | 0.671 | 0.000 | 0.000 | 0.693 |
| LNNUM (number) | 10,233 | 1.224 | 2.772 | 0.000 | 0.000 | 1.000 |
| LIQ | 10,233 | 2.338 | 1.473 | 1.378 | 1.940 | 2.798 |
| CA_TA | 10,233 | 0.438 | 0.192 | 0.293 | 0.432 | 0.576 |
| INVREC | 10,233 | 0.246 | 0.145 | 0.133 | 0.228 | 0.330 |
| ROA | 10,233 | 0.111 | 0.086 | 0.061 | 0.102 | 0.152 |
| LOSS | 10,233 | 0.064 | 0.244 | 0.000 | 0.000 | 0.000 |
| INTANG | 10,233 | 0.259 | 0.208 | 0.076 | 0.222 | 0.403 |
| GC | 10,233 | 0.000 | 0.020 | 0.000 | 0.000 | 0.000 |
| MW | 10,233 | 0.023 | 0.151 | 0.000 | 0.000 | 0.000 |
| RESTATE | 10,233 | 0.009 | 0.095 | 0.000 | 0.000 | 0.000 |
| LEV | 10,233 | 0.240 | 0.178 | 0.098 | 0.230 | 0.349 |
| Z | 10,233 | 4.608 | 3.799 | 2.439 | 3.615 | 5.375 |
| SIZE | 10,233 | 8.224 | 1.553 | 7.074 | 8.079 | 9.293 |
| SIZE ($US million) | 10,233 | 15,398 | 35,587 | 1,180 | 3,227 | 10,867 |
| MERGER | 10,233 | 0.562 | 0.496 | 0.000 | 1.000 | 1.000 |
| FRGN | 10,233 | 0.692 | 0.462 | 0.000 | 1.000 | 1.000 |
| LNSEG | 10,233 | 1.924 | 0.641 | 1.386 | 1.946 | 2.485 |
| LNSEG (number) | 10,233 | 7.348 | 5.071 | 3.000 | 6.000 | 11.000 |
| LNGEO | 10,233 | 2.069 | 0.659 | 1.609 | 1.946 | 2.565 |
| LNGEO (number) | 10,233 | 8.807 | 6.808 | 4.000 | 6.000 | 12.000 |
| BUSY | 10,233 | 0.643 | 0.479 | 0.000 | 1.000 | 1.000 |
| BIG4 | 10,233 | 0.935 | 0.247 | 1.000 | 1.000 | 1.000 |
| SP | 10,233 | 0.053 | 0.224 | 0.000 | 0.000 | 0.000 |
| LNTENURE | 10,233 | 2.311 | 0.615 | 2.079 | 2.398 | 2.773 |
| LNTENURE (years) | 10,233 | 11.642 | 5.203 | 8.000 | 11.000 | 16.000 |
| AUD_CH | 10,233 | 0.020 | 0.140 | 0.000 | 0.000 | 0.000 |
| LNAF | 10,233 | 12.779 | 1.732 | 11.780 | 12.904 | 13.998 |
| LNAF ($US million) | 10,233 | 1.073 | 1.689 | 0.131 | 0.402 | 1.200 |
| DUAL | 10,233 | 0.495 | 0.500 | 0.000 | 0.000 | 1.000 |
| CEOEXP | 10,233 | 0.002 | 0.048 | 0.000 | 0.000 | 0.000 |
Descriptive statistics for the control variables indicate that the client firms, on average, have a liquidity ratio (LIQ) of 2.338. The current assets and the sum of inventory and receivables are about 43.8% (CA_TA) and 24.6% (INVREC) of the total assets, respectively. Also, 6.4% (n = 655) and 1% (n = 102) of the client firms report a negative operating income after depreciation and announce a financial restatement, respectively. The sample firms have an average market value of equity of $15,398m (log-transformed mean = 8.22) and operate in about seven business segments and nine geographic segments. Of the sample firms, 56.2% (n = 5,751) are involved in merger activities, and 69.2% (n = 7,081) have foreign operations. Regarding auditor-related variables, 64.3% (n = 6,580) of the client firms have a fiscal year end in December. Most firms are audited by Big 4 auditors (93.5%, n = 9,568), while 5% (n = 512) are audited by specialist auditors; and 2% of the client firms (n = 205) switch their auditors during the sample period. The average tenure of the auditors is about 12 years. Finally, the summary statistics on the executive-related variables show that on average, 50% (n = 5,117) of CEOs also hold the position of chairman in the same firm while only a small fraction (0.2%, n = 20) of CEOs are classified as financial experts.
5.2 Correlation
Table 3 presents the correlation among the variables used in the audit fees analysis. The positive and significant correlation between audit fees and LNPEN (LNNUM) is consistent with our hypothesis and provides preliminary support for our main argument. However, we note that this bivariate correlation does not control for other factors that simultaneously affect audit fees. The subsequent regression analysis will provide a more robust test of our analysis. The correlations between audit fees and the control variables are in line with prior literature. Specifically, audit fees are positively correlated with factors that increase audit risks and audit efforts (INTANG, MW, LEV, SIZE, MERGER, FRGN, LNBUS and LNGEO) and negatively associated with LIQ, CA_TA, INVREC, ROA, LOSS, Z and AUD_CH. Additionally, our analysis reveals positive associations between audit fees and auditor-specific variables (BUSY, BIG4, SP, LNTENURE and LNAF), as well as CEO-specific variables (DUAL and CEOEXP).
Correlation
| No. | Variables | (1) | (2) | (3) | (4) | (5) | (6) | (7) | (8) | (9) | (10) | (11) | (12) | (13) | (14) | (15) | (16) | (17) | (18) | (19) | (20) | (21) | (22) | (23) | (24) | (25) | (26) | (27) |
|---|---|---|---|---|---|---|---|---|---|---|---|---|---|---|---|---|---|---|---|---|---|---|---|---|---|---|---|---|
| (1) | LAF | 1.000 | ||||||||||||||||||||||||||
| (2) | LNPEN | 0.368*** | 1.000 | |||||||||||||||||||||||||
| (3) | LNNUM | 0.374*** | 0.900*** | 1.000 | ||||||||||||||||||||||||
| (4) | LIQ | −0.351*** | −0.230*** | −0.232*** | 1.000 | |||||||||||||||||||||||
| (5) | CA_TA | −0.219*** | −0.242*** | −0.268*** | 0.469*** | 1.000 | ||||||||||||||||||||||
| (6) | INVREC | −0.085*** | −0.026*** | −0.040*** | 0.056*** | 0.613*** | 1.000 | |||||||||||||||||||||
| (7) | ROA | −0.048*** | −0.005 | −0.019* | 0.049*** | 0.153*** | 0.099*** | 1.000 | ||||||||||||||||||||
| (8) | LOSS | −0.122*** | −0.051*** | −0.051*** | 0.098*** | 0.026*** | −0.087*** | −0.503*** | 1.000 | |||||||||||||||||||
| (9) | INTANG | 0.241*** | −0.005 | −0.028*** | −0.240*** | −0.478*** | −0.279*** | −0.042*** | −0.135*** | 1.000 | ||||||||||||||||||
| (10) | GC | −0.009 | −0.014 | −0.013 | −0.008 | 0.017* | 0.011 | −0.037*** | 0.056*** | −0.012 | 1.000 | |||||||||||||||||
| (11) | MW | 0.022** | −0.016 | −0.021** | −0.004 | 0.006 | 0.017* | −0.085*** | 0.039*** | 0.013 | 0.030*** | 1.000 | ||||||||||||||||
| (12) | RESTATE | −0.011 | −0.018* | −0.018* | 0.007 | 0.023** | 0.011 | −0.036*** | 0.026*** | −0.027*** | −0.002 | 0.122*** | 1.000 | |||||||||||||||
| (13) | LEV | 0.311*** | 0.163*** | 0.173*** | −0.354*** | −0.455*** | −0.200*** | −0.081*** | −0.018* | 0.236*** | 0.017* | 0.011 | −0.007 | 1.000 | ||||||||||||||
| (14) | Z | −0.313*** | −0.169*** | −0.175*** | 0.523*** | 0.397*** | 0.104*** | 0.482*** | −0.110*** | −0.208*** | −0.019* | −0.047*** | −0.014 | −0.495*** | 1.000 | |||||||||||||
| (15) | SIZE | 0.729*** | 0.365*** | 0.378*** | −0.255*** | −0.244*** | −0.255*** | 0.285*** | −0.209*** | 0.173*** | −0.041*** | −0.082*** | −0.051*** | 0.197*** | 0.029*** | 1.000 | ||||||||||||
| (16) | MERGER | 0.163*** | 0.014 | 0.000 | −0.099*** | −0.107*** | −0.002 | 0.039*** | −0.125*** | 0.340*** | 0.007 | −0.014 | −0.013 | 0.040*** | −0.069*** | 0.104*** | 1.000 | |||||||||||
| (17) | FRGN | 0.343*** | 0.007 | −0.012 | 0.032*** | 0.104*** | 0.084*** | 0.124*** | −0.205*** | 0.124*** | −0.019* | −0.017* | −0.014 | −0.017* | 0.024** | 0.256*** | 0.141*** | 1.000 | ||||||||||
| (18) | LNSEG | 0.360*** | 0.203*** | 0.211*** | −0.164*** | −0.140*** | 0.049*** | −0.026*** | −0.089*** | 0.144*** | −0.012 | −0.003 | −0.022** | 0.111*** | −0.194*** | 0.188*** | 0.141*** | 0.179*** | 1.000 | |||||||||
| (19) | LNGEO | 0.311*** | −0.001 | −0.012 | 0.088*** | 0.085*** | 0.037*** | −0.044*** | −0.032*** | 0.046*** | −0.007 | 0.003 | −0.021** | −0.037*** | −0.031*** | 0.168*** | 0.090*** | 0.440*** | 0.394*** | 1.000 | ||||||||
| (20) | BUSY | 0.107*** | 0.062*** | 0.075*** | −0.046*** | −0.166*** | −0.120*** | −0.065*** | 0.022** | 0.045*** | 0.015 | −0.006 | −0.010 | 0.119*** | −0.076*** | 0.042*** | 0.008 | 0.007 | 0.047*** | 0.073*** | 1.000 | |||||||
| (21) | BIG4 | 0.295*** | 0.112*** | 0.110*** | −0.171*** | −0.137*** | −0.077*** | 0.014 | −0.069*** | 0.047*** | 0.005 | −0.012 | −0.004 | 0.148*** | −0.157*** | 0.241*** | 0.041*** | 0.058*** | 0.080*** | 0.050*** | 0.026*** | 1.000 | ||||||
| (22) | SP | 0.111*** | 0.050*** | 0.073*** | −0.070*** | −0.038*** | 0.021** | −0.032*** | −0.013 | −0.037*** | −0.005 | 0.021** | 0.005 | 0.059*** | −0.062*** | 0.054*** | −0.005 | −0.012 | 0.061*** | −0.005 | 0.044*** | 0.062*** | 1.000 | |||||
| (23) | LNTENURE | 0.227*** | 0.116*** | 0.113*** | −0.098*** | −0.085*** | −0.038*** | 0.019* | −0.027*** | 0.035*** | −0.029*** | −0.045*** | −0.035*** | 0.135*** | −0.056*** | 0.254*** | −0.007 | 0.067*** | 0.074*** | 0.072*** | 0.010 | 0.274*** | 0.041*** | 1.000 | ||||
| (24) | AUD_CH | −0.087*** | −0.040*** | −0.037*** | 0.036*** | 0.024** | 0.011 | −0.007 | 0.008 | −0.008 | 0.032*** | 0.024** | 0.030*** | −0.024** | 0.021** | −0.074*** | −0.005 | −0.006 | −0.018* | −0.011 | −0.010 | −0.126*** | −0.015 | −0.538*** | 1.000 | |||
| (25) | LNAF | 0.647*** | 0.241*** | 0.234*** | −0.245*** | −0.169*** | −0.098*** | 0.041*** | −0.133*** | 0.227*** | −0.011 | −0.022** | −0.012 | 0.216*** | −0.201*** | 0.538*** | 0.149*** | 0.253*** | 0.254*** | 0.207*** | 0.047*** | 0.238*** | 0.069*** | 0.152*** | −0.074*** | 1.000 | ||
| (26) | DUAL | 0.106*** | 0.133*** | 0.143*** | −0.079*** | −0.036*** | 0.027*** | 0.028*** | −0.020** | −0.036*** | 0.000 | −0.039*** | −0.008 | 0.007 | −0.039*** | 0.132*** | 0.006 | 0.011 | 0.073*** | −0.007 | 0.065*** | −0.006 | 0.010 | −0.018* | −0.009 | 0.106*** | 1.000 | |
| (27) | CEOEXP | 0.018* | 0.016 | 0.019* | −0.019* | −0.011 | 0.008 | 0.005 | 0.012 | −0.003 | −0.001 | 0.006 | −0.005 | 0.010 | −0.001 | 0.009 | 0.002 | −0.011 | 0.004 | 0.001 | −0.006 | 0.013 | −0.002 | 0.033*** | −0.007 | 0.017* | −0.020** | 1.000 |
*, ** and *** indicate significance (two-tailed) at 0.10, 0.05 and 0.01 levels, respectively. The definition and measurement of the variables are described in Appendix
5.3 Regression analysis
The regression results of the association between non-financial misconduct and audit fees are reported in Table 4. In Columns 1 and 2, LNPEN and LNNUM are used as test variables, respectively [7]. The adjusted R-squared values across all models fall within the range of 79.4%–79.5%. Furthermore, the variance inflation factors for all variables in both Columns are below 5, indicating that multicollinearity is unlikely to be a problem in interpreting the regression results.
Non-financial misconduct and audit fees
| Variables | (1) | (2) |
|---|---|---|
| LAF | LAF | |
| LNPEN | 0.011*** (7.618) | |
| LNNUM | 0.116*** (7.236) | |
| LIQ | −0.026** (−2.512) | −0.027*** (−2.600) |
| CA_TA | 0.175 (1.616) | 0.193* (1.775) |
| INVREC | 0.729*** (5.331) | 0.716*** (5.240) |
| ROA | −1.882*** (−10.551) | −1.857*** (−10.407) |
| LOSS | −0.089*** (−2.721) | −0.085*** (−2.612) |
| INTANG | 0.035 (0.447) | 0.047 (0.595) |
| GC | 0.338 (1.277) | 0.333 (1.255) |
| MW | 0.298*** (7.736) | 0.300*** (7.783) |
| RESTATE | 0.135** (2.190) | 0.137** (2.223) |
| LEV | 0.405*** (5.228) | 0.405*** (5.231) |
| Z | −0.023*** (−3.775) | −0.023*** (−3.763) |
| SIZE | 0.365*** (33.948) | 0.362*** (33.198) |
| MERGER | 0.006 (0.420) | 0.007 (0.427) |
| FRGN | 0.129*** (5.574) | 0.131*** (5.657) |
| LNSEG | 0.162*** (7.636) | 0.158*** (7.435) |
| LNGEO | 0.118*** (5.016) | 0.121*** (5.092) |
| BUSY | 0.072*** (2.830) | 0.071*** (2.777) |
| BIG4 | 0.225*** (4.526) | 0.228*** (4.553) |
| SP | 0.169*** (4.408) | 0.161*** (4.263) |
| LNTENURE | −0.042** (−2.226) | −0.041** (−2.194) |
| AUD_CH | −0.179*** (−4.357) | −0.179*** (−4.350) |
| LNAF | 0.099*** (14.187) | 0.099*** (14.139) |
| DUAL | −0.015 (−0.820) | −0.017 (−0.953) |
| CEOEXP | 0.195** (2.171) | 0.190** (2.048) |
| Intercept | 10.386*** (53.955) | 10.434*** (59.196) |
| Year and industry FE | Yes | Yes |
| N | 10,233 | 10,233 |
| Adjusted R2 | 0.794 | 0.795 |
*, ** and *** indicate significance (two-tailed) at 0.10, 0.05 and 0.01 levels, respectively. Standard errors are robust to heteroscedasticity and clustered by firm
The results in Column 1 reveal a positive and significant coefficient on LNPEN (coeff = 0.011; p-value < 0.001). The results are similar when we use LNNUM to proxy for non-financial misconduct in Column 2. Specifically, the coefficient on the natural logarithm of the number of non-financial violations, LNNUM, is 0.116 and is significant at 1% significance level. In addition, our results are economically significant. Using the estimated coefficient of 0.116 on LNNUM from Table 4 Column 2 and mean value of number of non-financial misconducts (1.224) and standard deviation of number of non-financial misconducts (2.772) from Table 2 Panel A, we find that a one-standard-deviation increase in the number of misconducts corresponds to a 14.71% increase in audit fees, calculated as follows:
Given a mean audit fee of $4.304m, this increase translates into an incremental audit fee of approximately $633,171, computed as 4,306,000 × 14.71%. Finally, as expected, most of our control variables (firm-, auditor- and CEO-specific) are in the predicted direction and have a significant association with dependent variable. Overall, these results suggest that when a client firm experiences greater penalties resulting from non-financial violations or engages in frequent non-financial violations during the previous year, auditors perceive greater audit risks, which are associated with audit fees.
6. Additional analyses
6.1 Different types of non-financial misconduct
Non-financial misconduct includes violations related to competition, consumer protection, employment, environmental compliance, government contracting, health care and workplace safety. It is plausible that misconduct related to government contracting or health care, for instance, conveys a different level of regulatory scrutiny and potential legal exposure than labor- or environment-related violations. Accordingly, this study examines whether distinct categories of non-financial misconduct are differentially associated with audit fees. We hypothesize that auditors’ risk assessments and, consequently, the audit fee premiums they demand vary systematically with the nature of the violation.
To conduct this test, we decompose non-financial misconduct into four distinct categories and explore auditors’ responses to each type of violation. Consistent with Raghunandan (2021), we classify non-financial misconduct into four categories: labor-related, consumer-related, environment-related and other. The other category encompasses government contracting, health care, competition and miscellaneous violations. We then substitute LNPEN (LNNUM) with LNPEN_Labor (LNNUM_Labor), LNPEN_Consumer (LNNUM_Consumer), LNPEN_Environment (LNNUM_Environment) and LNPEN_Other (LNNUM_Other) and rerun the regressions. LNPEN_Labor (LNNUM_Labor), LNPEN_Consumer (LNNUM_Consumer), LNPEN_Environment (LNNUM_Environment) and LNPEN_Other (LNNUM_Other) represent the natural logarithm of a client firm’s total monetary penalties from (the number of) violation records because of labor-related, consumer-related, environment-related and other (i.e. government contracting, health care, competition and miscellaneous violations) violations in the prior year, respectively.
The results are presented in Table 5. The results for labor-related non-financial misconduct are reported in Columns 1 and 6; consumer-related non-financial misconduct in Columns 2 and 7; environment-related non-financial misconduct in Columns 3 and 8; and other non-financial misconduct in Columns 4 and 9. The results show that the coefficients on all four types of non-financial misconduct variables are positive and significant. In other words, audit fees are higher for firms when they are involved in labor-related, consumer-related, environment-related or other non-financial misconduct. In Columns 5 and 10, we include all four categories of non-financial misconduct in the model and re-run the regression. A closer look at the results in Columns 5 and 10 reveals that the coefficient for “other” misconduct is not only positive and significant but also has the largest magnitude among all categories. This suggests that auditors perceive violations in the “other” category of non-financial misconduct as the most severe, likely because of the significant financial penalties and heightened regulatory scrutiny associated with them [8]. Overall, our findings indicate that auditors factor in all types of non-financial misconduct, though the magnitude of the association varies by type.
Different types of non-financial misconduct and audit fees
| Variables | (1) | (2) | (3) | (4) | (5) | (6) | (7) | (8) | (9) | (10) |
|---|---|---|---|---|---|---|---|---|---|---|
| LAF | LAF | LAF | LAF | LAF | LAF | LAF | LAF | LAF | LAF | |
| LNPEN_Labor | 0.010*** (6.309) | 0.009*** (5.530) | ||||||||
| LNPEN_Consumer | 0.012*** (3.850) | 0.008*** (2.770) | ||||||||
| LNPEN_Environment | 0.010*** (4.758) | 0.007*** (3.570) | ||||||||
| LNPEN_Other | 0.014*** (6.890) | 0.012*** (6.165) | ||||||||
| LNNUM_Labor | 0.111*** (6.078) | 0.092*** (5.243) | ||||||||
| LNNUM_Consumer | 0.210*** (3.805) | 0.139*** (2.622) | ||||||||
| LNNUM_Environment | 0.119*** (4.839) | 0.074*** (3.261) | ||||||||
| LNNUM_Other | 0.265*** (6.713) | 0.233*** (6.047) | ||||||||
| Intercept | 10.447*** (59.032) | 10.404*** (55.449) | 10.332*** (51.430) | 10.434*** (56.175) | 10.475*** (57.203) | 10.466*** (58.471) | 10.403*** (55.438) | 10.335*** (55.232) | 10.434*** (56.153) | 10.495*** (59.502) |
| Control variables | Yes | Yes | Yes | Yes | Yes | Yes | Yes | Yes | Yes | Yes |
| Year and industry FE | Yes | Yes | Yes | Yes | Yes | Yes | Yes | Yes | Yes | Yes |
| N | 10,233 | 10,233 | 10,233 | 10,233 | 10,233 | 10,233 | 10,233 | 10,233 | 10,233 | 10,233 |
| Adjusted R2 | 0.793 | 0.791 | 0.792 | 0.792 | 0.795 | 0.794 | 0.791 | 0.792 | 0.792 | 0.795 |
*, ** and *** indicate significance (two-tailed) at 0.10, 0.05 and 0.01 levels, respectively. Standard errors are robust to heteroscedasticity and clustered by firm. The control variables used in Columns 1–8 are obtained from Model 1
6.2 Effect of executive turnover
Extant studies show that companies often replace top executives in response to credibility damage from misconduct, including regulatory sanctions, financial restatements or earnings management (Bereskin et al., 2020; Casu et al., 2023; Hazarika et al., 2012; Barua and Smith, 2012; Feldmann et al., 2009). Consequently, CEO turnover signals to stakeholders that the firm is addressing past wrongdoing and strengthening corporate governance. Prior research finds that such leadership changes mitigate perceived litigation and fraud risks among investors and auditors, as management integrity is linked to perceptions of client risk (Barua and Smith, 2012; Feldmann et al., 2009). Relatedly, Feldmann et al. (2009) document that auditors perceive lower risk following CEO turnover after financial restatements and, consequently, charge lower audit fees. We extend these insights to non-financial misconduct and posit that firms experiencing such misconduct may similarly benefit from a CEO change. Accordingly, we expect that CEO turnover would weaken the positive association between non-financial misconduct and audit fees:
The positive association between non-financial misconduct and audit fees is mitigated by a CEO turnover.
We test this hypothesis by introducing an additional independent variable for CEO turnover (TURNOVER) and interact it with the non-financial misconduct proxies. TURNOVER is an indicator variable that equals 1 for the presence of a CEO turnover in the current year. The result of this test is presented in Table 6. Column 1 shows that the effect of LNPEN on audit fees remains positive and significant. In addition, the interaction between non-financial misconduct proxy and CEO turnover (LNPEN × TURNOVER) is negative and significant, thus supporting our proposition. The results in Column 2 are qualitatively similar to Column 1. The negative and significant coefficient on the interaction term, LNNUM × TURNOVER (coeff = −0.037), indicates that CEO turnover significantly mitigates the financial penalty imposed by auditors following misconduct. In economic effect term, firms with CEO turnover pay $221,183 less in audit fee premiums for the same one standard deviation increase in the number of non-financial violations compared to firms without turnover [9].
The effect of executive turnover on the relationship between non-financial misconduct and audit fees
| Variables | (1) | (2) |
|---|---|---|
| LAF | LAF | |
| LNPEN | 0.011*** (7.599) | |
| LNPEN × TURNOVER | −0.004* (−1.701) | |
| LNNUM | 0.116*** (7.224) | |
| LNNUM × TURNOVER | −0.037* (−1.895) | |
| TURNOVER | 0.051*** (3.254) | 0.051*** (3.321) |
| Intercept | 10.387*** (54.107) | 10.436*** (59.497) |
| Control variables | Yes | Yes |
| Year and industry FE | Yes | Yes |
| N | 10,233 | 10,233 |
| Adjusted R2 | 0.794 | 0.795 |
*, ** and *** indicate significance (two-tailed) at 0.10, 0.05 and 0.01 levels, respectively. Standard errors are robust to heteroscedasticity and clustered by firm. LNPEN × TURNOVER is the mean-centered interaction term measured as (LNPEN – mean value of LNPEN) × (TURNOVER – mean value of TURNOVER). LNNUM × TURNOVER is the mean-centered interaction term measured as (LNNUM– mean value of LNNUM) × (TURNOVER – mean value of TURNOVER). The control variables used in Columns 1–2 are obtained from Model 1
To further validate the remediation effect of CEO turnover, we implement a staged timing design. This analysis posits that non-financial misconduct is associated with governance interventions, which are in turn linked to the auditor’s risk assessment and subsequent audit scope. Specifically, we first investigate whether prior misconduct predicts CEO turnover using a probit model. The results indicate that both the monetary penalty and the frequency of misconduct at year t – 1 are statistically significant predictors of CEO turnover at year t. When incorporating the turnover indicator into audit fee model, we observe that the coefficients for our misconduct proxies are partially attenuated compared to the baseline results in Model 1. This suggests that auditors observe governance remediation efforts and downwardly revise their assessments of inherent client risk [10]. Taken together, these results suggest that while non-financial misconduct initially is associated with higher audit fees, this association is moderated when firms undertake visible governance reforms, such as leadership changes, that signal improved tone at the top. For brevity, the staged results are not tabulated but are available upon request.
6.3 Mechanisms linking non-financial misconduct to audit fees
To further understand the economic drivers behind the relationship between non-financial misconduct and audit fees, we examine three potential channels: audit effort, engagement risk and auditor specialist demand.
First, we examine the audit effort and complexity channel and report the results in Table 7 Panel A. As discussed in the hypothesis development, non-financial misconduct may prompt auditors to expand substantive testing and devote greater audit effort. We test this possibility by regressing our two measures of non-financial misconduct on audit report lag (LAG), a proxy for audit effort. We measure LAG as the natural logarithm of the number of calendar days between fiscal year-end to the audit report signing date and present the result of this test in Columns 1–2 of Table 7 Panel A. We find that LNNUM is positively associated with LAG at 10% level, while LNPEN show no significant relationship. Thus, our results suggest that auditors spend more effort in auditing clients involved in non-financial misconduct. In addition, we investigate whether the positive association between non-financial misconduct and audit fees is further exacerbated by complexity. We interact foreign operations (FRGN), a proxy for operational complexity, with non-financial misconduct variables and rerun Model 1. The results presented in Columns 3 and 4 reveal that both interaction terms are positive and statistically significant, indicating that fee response to non-financial misconduct increases with client complexity.
Mechanisms linking non-financial misconduct to audit fees
| Variables | (1) | (2) | (3) | (4) |
|---|---|---|---|---|
| LAG | LAG | LAF | LAF | |
| Panel A: Audit effort and complexity channel | ||||
| LNPEN | 0.000 (0.454) | 0.010*** (6.028) | ||
| LNPEN × FRGN | 0.006** (2.133) | |||
| LNNUM | 0.009* (1.671) | 0.102*** (6.008) | ||
| LNNUM × FRGN | 0.069*** (2.652) | |||
| FRGN | −0.003 (−0.368) | −0.003 (−0.354) | 0.120*** (5.119) | 0.118*** (5.056) |
| Intercept | 4.335*** (64.700) | 4.338*** (65.550) | 10.408*** (51.309) | 10.460*** (57.172) |
| Control variables | Yes | Yes | Yes | Yes |
| Year and industry FE | Yes | Yes | Yes | Yes |
| N | 10,231 | 10,231 | 10,233 | 10,233 |
| Adjusted R2 | 0.314 | 0.315 | 0.794 | 0.795 |
| Panel B: Engagement risk premium channel | ||||
| Variables | (1) | (2) | (3) | (4) |
| LAF | LAF | LAF | LAF | |
| LNPEN | 0.008*** (4.390) | 0.007*** (3.613) | ||
| LNPEN × BIG4 | 0.018** (2.033) | |||
| LNPEN × AF | 0.001*** (3.471) | |||
| LNNUM | 0.084*** (3.991) | 0.078*** (3.469) | ||
| LNNUM × BIG4 | 0.220** (2.275) | |||
| LNNUM × AF | 0.005*** (2.841) | |||
| BIG4 | 0.243*** (4.766) | 0.253*** (4.937) | 0.214*** (4.318) | 0.216*** (4.329) |
| AF | 0.000 (0.185) | 0.001 (0.475) | ||
| Intercept | 10.367*** (53.565) | 10.408*** (58.981) | 10.498*** (47.632) | 10.557*** (53.993) |
| Control variables | Yes | Yes | Yes | Yes |
| Year and industry FE | Yes | Yes | Yes | Yes |
| N | 10,233 | 10,233 | 9,974 | 9,974 |
| Adjusted R2 | 0.794 | 0.795 | 0.795 | 0.796 |
| Panel C: Specialist demand and auditor switching | ||||
| (1) | (2) | (3) | (4) | |
| Variables | ToSP | ToSP | LAF | LAF |
| LNPEN | 0.157*** (3.134) | 0.011*** (7.569) | ||
| LNNUM | 1.628** (2.322) | 0.117*** (7.310) | ||
| LNPEN × ToSP | 0.025* (1.739) | |||
| LNNUM × ToSP | 0.292 (1.579) | |||
| ToSP | −0.099 (−0.744) | 0.012 (0.109) | ||
| Intercept | −0.457 (−0.156) | −0.223 (−0.074) | 10.340*** (50.213) | 10.388*** (55.245) |
| Control variables | Yes | Yes | Yes | Yes |
| Year and industry FE | Yes | Yes | Yes | Yes |
| N | 304 | 304 | 10,233 | 10,233 |
| Adjusted R2 | 0.796 | 0.797 | ||
| Pseudo R2 | 0.611 | 0.602 | ||
Panel A: *, ** and *** indicate significance (two-tailed) at 0.10, 0.05 and 0.01 levels, respectively. Standard errors are robust to heteroscedasticity and clustered by firm. LNPEN × FRGN is the mean-centered interaction term measured as (LNPEN – mean value of LNPEN) × (FRGN – mean value of FRGN). LNNUM × FRGN is the mean-centered interaction term measured as (LNNUM– mean value of LNNUM) × (TURNOVER – mean value of FRGN). The control variables used in Columns 1–4 are obtained from Model 1. Panel B: *, ** and *** indicate significance (two-tailed) at 0.10, 0.05 and 0.01 levels, respectively. Standard errors are robust to heteroscedasticity and clustered by firm. LNPEN × BIG4 is the mean-centered interaction term measured as (LNPEN – mean value of LNPEN) × (BIG4 – mean value of BIG4). LNNUM × BIG4 is the mean-centered interaction term measured as (LNNUM– mean value of LNNUM) × (BIG4 – mean value of BIG4). LNPEN × AF is the mean-centered interaction term measured as (LNPEN – mean value of LNPEN) × (AF– mean value of AF). LNNUM × AF is the mean-centered interaction term measured as (LNNUM– mean value of LNNUM) × (AF – mean value of AF). The control variables used in Columns 1–4 are obtained from Model 1. Panel C: *, ** and *** indicate significance (two-tailed) at 0.10, 0.05, and 0.01 levels, respectively. Standard errors are robust to heteroscedasticity and clustered by firm. LNPEN × ToSP is the mean-centered interaction term measured as (LNPEN – mean value of LNPEN) × (ToSP – mean value of ToSP). LNNUM × ToSP is the mean-centered interaction term measured as (LNNUM– mean value of LNNUM) × (ToSP – mean value of ToSP). The control variables used in Columns 1–4 are obtained from Model 1. In Columns 1–2, control variables (i.e. LOSS, GC, MW, RESTATE, FRGN, BIG4, SP, LNTENURE, AUD_CH and CEOEXP) were omitted from the probit model because they perfectly predicted the outcome or lacked sufficient variation, which is necessary to ensure convergence and valid estimation
We also argue in the hypothesis section that non-financial misconduct increases auditors’ inherent risk. Big 4 auditors and those with highly visible clients possess substantial reputational capital and face greater public scrutiny. Consequently, they are more sensitive to these risk signals than their peers. Accordingly, we expect the positive association between non-financial misconduct and audit fees to be more pronounced for clients of such auditors. To test the possibility, we interact our non-financial misconduct variables (LNNUM and LNPEN) with auditor reputation (Big4) and analyst following (AF), which proxy for client visibility, and rerun Model 1. We measure AF as the number of analysts following the firm. Our findings in Panel B show significant coefficients on LNPEN × BIG4 and LNNUM × BIG4, indicating that Big 4 auditors, who have greater reputation capital to protect, price misconduct risk more aggressively. Furthermore, the positive coefficient on LNPEN × AF and LNNUM × AF support the view that auditors increase fee premiums for highly followed firms to compensate for heightened litigation and regulatory exposure.
Although our primary analyses focus on the association between non-financial misconduct and audit fees, specifically through increases in auditor’s assessment of risk and subsequent effort, an alternative explanation is that the observed relation is driven by firms’ strategic choices. In particular, firms implicated in misconduct may proactively switch to higher-quality auditors to signal improved governance and restore market confidence. As industry specialists and higher-tier auditors typically command a price premium, such strategic transitions could mechanically lead to higher audit fees (Bae et al., 2019). Consequently, we examine whether auditor switching influences the association between non-financial misconduct and audit fees. In Columns 1–2 of Panel C of Table 7, we use a probit model to test if misconducts predict a shift toward industry specialists. The results show that both the penalty amount (LNPEN) and the number of violations (LNNUM) are significantly and positively associated with the likelihood of switching to an industry specialist auditor (ToSP) in the subsequent period. Further, we examine the fee implications of these transitions in Columns 3–4. The interaction between LNPEN and ToSP is positive and significant. This suggests that while misconduct generally increases fees, the premium is particularly pronounced when firms proactively seek out higher-tier specialists to restore organizational credibility and improve financial oversight following a non-financial misconduct.
7. Robustness tests
7.1 Firm fixed effect
To mitigate the effect of unobservable time-invariant client firm characteristics such as corporate culture or managerial integrity, that may simultaneously affect both non-financial misconduct and audit fees, we run Model 1 with year and firm fixed effects. The results, as reported in Table 8, remain qualitatively similar to our main findings. The positive and significant coefficient on LNPEN (LNNUM) confirms that the positive association between non-financial misconduct and audit fees is not driven by these unobservable, time-invariant factors [11].
Control for firm fixed effects
| Variables | (1) | (2) |
|---|---|---|
| LAF | LAF | |
| LNPEN | 0.002*** (2.974) | |
| LNNUM | 0.028*** (3.841) | |
| Intercept | 13.094*** (96.234) | 13.096*** (96.542) |
| Control variables | Yes | Yes |
| Year and firm FE | Yes | Yes |
| N | 10,114 | 10,114 |
| Adjusted R2 | 0.956 | 0.956 |
*, ** and *** indicate significance (two-tailed) at 0.10, 0.05 and 0.01 levels, respectively. Standard errors are robust to heteroscedasticity and clustered by firm. The control variables used in Columns 1–2 are obtained from Model 1
7.2 Control for financial misconduct and propensity score match
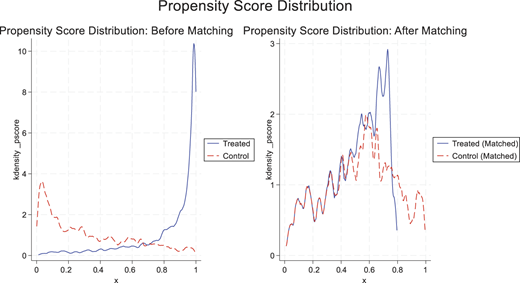
Existing literature suggests that firms involved in non-financial misconduct are more likely to misreport their financial statements (Kedia et al., 2017; Miller, 2024). As a result, a question arises as to whether our results are capturing the association between financial misconduct and audit fees instead of non-financial misconduct. To address this issue, we exclude all firms with a history of financial misconduct from our sample. We classify firm-year observations involving non-financial violations as the treatment group and firms with no record of non-financial misconduct during the sample period as the control group. A dummy variable, TREAT, is assigned to a value of 1 for the treatment group and 0 for the control group. Using logistic regression with TREAT as the dependent variable, we estimate propensity scores based on the control variables from Model 1, along with industry and year fixed effects. We match each treated firm-year observation with a control observation using nearest-neighbor matching within a 0.2 caliper and without replacement, yielding a balanced sample of 1,362 observations (681 treated and 681 control). To validate the matching procedure, we conduct a series of diagnostic tests. Table 9 Panel A reports covariate balance before and after matching, showing a substantial reduction in selection bias across all covariates. The mean differences in nearly all covariates between treatment and control groups become statistically insignificant (p > 0.10), confirming improved balance. To provide visual documentation of the matching effectiveness, in Table 9 Panel B, we present a plot of the propensity score distribution for both the treatment and control groups. The plot illustrates a substantial overlap in the common support region, confirming that the matched pairs are statistically similar. Finally, we re-estimate Model 1 on the matched sample and report the results in Table 9 Panel C. The findings reveal a significant positive association between non-financial misconduct and audit fees, consistent with our main results.
Control for financial misconduct and propensity score match
| Variables | (1) | (2) | (3) | (4) | |||||
|---|---|---|---|---|---|---|---|---|---|
| Unmatched (U) | Mean | Standardized | |Bias| | t-test | |||||
| Matched (M) | Treated | Control | Bias% | Reduction% | t | p > |t| | |||
| Panel A: Covariate balance before and after propensity score matching | |||||||||
| LIQ | U | 1.959 | 3.082 | −60.8 | −21.860 | 0.000 | |||
| M | 2.378 | 2.324 | 2.9 | 95.2 | 0.730 | 0.466 | |||
| CA_TA | U | 0.385 | 0.497 | −60.6 | −19.850 | 0.000 | |||
| M | 0.436 | 0.430 | 3.0 | 95.0 | 0.570 | 0.569 | |||
| INVREC | U | 0.246 | 0.215 | 24.2 | 7.550 | 0.000 | |||
| M | 0.241 | 0.238 | 2.8 | 88.5 | 0.510 | 0.610 | |||
| ROA | U | 0.112 | 0.101 | 11.8 | 3.950 | 0.000 | |||
| M | 0.107 | 0.107 | 0.1 | 99.1 | 0.020 | 0.982 | |||
| LOSS | U | 0.044 | 0.109 | −24.6 | −8.390 | 0.000 | |||
| M | 0.048 | 0.054 | −2.2 | 91.0 | −0.490 | 0.624 | |||
| INTANG | U | 0.253 | 0.263 | −4.9 | −1.570 | 0.115 | |||
| M | 0.291 | 0.279 | 5.6 | −13.9 | 1.010 | 0.311 | |||
| GC | U | 0.000 | 0.001 | −1.4 | −0.480 | 0.629 | |||
| M | 0.001 | 0.001 | 0.0 | 100.0 | 0.000 | 1.000 | |||
| MW | U | 0.017 | 0.024 | −5.0 | −1.640 | 0.101 | |||
| M | 0.026 | 0.025 | 1.0 | 79.4 | 0.170 | 0.864 | |||
| RESTATE | U | 0.000 | 0.000 | ||||||
| M | 0.000 | 0.000 | |||||||
| LEV | U | 0.271 | 0.206 | 35.7 | 11.670 | 0.000 | |||
| M | 0.237 | 0.247 | −5.2 | 85.3 | −0.960 | 0.337 | |||
| Z | U | 3.798 | 5.768 | −41.5 | −14.820 | 0.000 | |||
| M | 4.423 | 4.373 | 1.1 | 97.5 | 0.240 | 0.814 | |||
| SIZE | U | 8.886 | 7.477 | 97.2 | 30.210 | 0.000 | |||
| M | 7.828 | 7.959 | −9.0 | 90.7 | −1.800 | 0.073 | |||
| MERGER | U | 0.575 | 0.515 | 12.0 | 3.810 | 0.000 | |||
| M | 0.590 | 0.592 | −0.3 | 97.5 | −0.060 | 0.956 | |||
| FRGN | U | 0.722 | 0.663 | 12.9 | 4.120 | 0.000 | |||
| M | 0.695 | 0.699 | −1.0 | 92.6 | −0.180 | 0.860 | |||
| LNSEG | U | 2.090 | 1.696 | 63.9 | 20.270 | 0.000 | |||
| M | 1.899 | 1.902 | −0.4 | 99.3 | −0.080 | 0.940 | |||
| LNGEO | U | 2.096 | 2.037 | 9.1 | 2.860 | 0.004 | |||
| M | 2.063 | 2.065 | −0.3 | 97.1 | −0.050 | 0.963 | |||
| BUSY | U | 0.671 | 0.577 | 19.6 | 6.270 | 0.000 | |||
| M | 0.623 | 0.621 | 0.3 | 98.4 | 0.060 | 0.955 | |||
| BIG4 | U | 0.972 | 0.892 | 32.1 | 11.280 | 0.000 | |||
| M | 0.930 | 0.937 | −3.0 | 90.8 | −0.540 | 0.588 | |||
| SP | U | 0.067 | 0.033 | 15.8 | 4.770 | 0.000 | |||
| M | 0.054 | 0.051 | 1.4 | 91.4 | 0.240 | 0.809 | |||
| LNTENURE | U | 2.395 | 2.163 | 38.8 | 12.530 | 0.000 | |||
| M | 2.251 | 2.281 | −5.0 | 87.1 | −0.930 | 0.355 | |||
| AUD_CH | U | 0.014 | 0.024 | −7.1 | −2.370 | 0.018 | |||
| M | 0.018 | 0.015 | 2.1 | 70.1 | 0.430 | 0.668 | |||
| LNAF | U | 13.340 | 12.223 | 66.8 | 21.130 | 0.000 | |||
| M | 12.755 | 12.752 | 0.2 | 99.7 | 0.030 | 0.973 | |||
| DUAL | U | 0.589 | 0.422 | 33.7 | 10.720 | 0.000 | |||
| M | 0.419 | 0.443 | −5.1 | 85.0 | −0.930 | 0.353 | |||
| CEOEXP | U | 0.003 | 0.001 | 5.5 | 1.600 | 0.111 | |||
| M | 0.001 | 0.001 | 0.0 | 100.0 | 0.000 | 1.000 | |||
| Panel B: Propensity score distribution | |||||||||
 | |||||||||
| Panel C: Propensity score matching results | |||||||||
| Variables | (1) | (2) | |||||||
| LAF | LAF | ||||||||
| LNPEN | 0.020*** (4.439) | ||||||||
| LNNUM | 0.219*** (4.499) | ||||||||
| Intercept | 9.655*** (31.365) | 9.656*** (31.254) | |||||||
| Control variables | Yes | Yes | |||||||
| Year and industry FE | Yes | Yes | |||||||
| N | 1,362 | 1,362 | |||||||
| Adjusted R2 | 0.734 | 0.736 | |||||||
*, ** and *** indicate significance (two-tailed) at 0.10, 0.05 and 0.01 levels, respectively. Standard errors are robust to heteroscedasticity and clustered by firm. The control variables used in Columns 1–2 are obtained from Model 1.
7.3 The big 4 subsample
Previous studies have shown that Big N auditors charge higher fees than non-Big N auditors (Francis, 1984). As firms involved in misconduct tend to be larger (Christensen, 2016) and more likely to engage Big 4 auditors (Eshleman and Guo, 2014), there is a concern that our results may be driven by fee scheme differences between Big 4 and non-Big 4 auditors. To ensure that our results reflect the association between non-financial misconduct and audit fees, rather than capturing the differences between Big 4 and non-Big 4 auditors, we restrict our sample to Big 4 auditors. We report the result of this restrictive sample in Table 10. The coefficient on non-financial misconduct (LNPEN and LNNUM) is positive and significant in both Column 1 (coeff = 0.011) and Column 2 (coeff = 0.119), respectively. We find the results show consistency when compared to our main analysis in Table 4. Specifically, the coefficient for LNPEN (0.011 in the Big 4 subsample vs 0.011 in the main sample) is identical, and the coefficient for LNNUM (0.116 vs 0.119) is only slightly smaller. This near-identical magnitude suggests that the fee premium charged in response to non-financial misconduct is not attributable to Big 4 auditors.
The big 4 subsample
| Variables | (1) | (2) |
|---|---|---|
| LAF | LAF | |
| LNPEN | 0.011*** (7.808) | |
| LNNUM | 0.119*** (7.496) | |
| Intercept | 10.478*** (55.853) | 10.531*** (62.244) |
| Control variables | Yes | Yes |
| Year and industry FE | Yes | Yes |
| N | 9,566 | 9,566 |
| Adjusted R2 | 0.785 | 0.786 |
*, ** and *** indicate significance (two-tailed) at 0.10, 0.05 and 0.01 levels, respectively. Standard errors are robust to heteroscedasticity and clustered by firm. The control variables used in Columns 1–2 are obtained from Model 1
7.4 Two-year lag of non-financial misconduct
Our main analysis already addresses the immediate timing issue by testing the association of misconduct occurring in prior year (i.e. one-year lagged) on audit fees in the current year. However, the concern remains that the audit pricing may be finalized before auditors become fully informed of non-financial violations, particularly when such incidents are revealed late in the fiscal year or through delayed regulatory disclosures. To ensure that audit fee adjustments are appropriately aligned with the timing of auditor awareness of non-financial misconduct, we perform a robustness test by replacing LNPEN and LNNUM with their respective two-year lagged variables (LNPEN2 and LNNUM2) in Model 1. By incorporating a two-year lag, we allow sufficient time for the misconduct to be recognized and reflected in the auditor’s risk assessment.
As shown in Table 11, the results remain robust, with a continued positive association between non-financial misconduct and audit fees. In addition, the coefficient for LNPEN is identical (0.011 in both one-year lagged and two-year lagged models), and the coefficient for LNNUM is only marginally larger in the two-year lagged model (0.118 vs 0.116). This consistency across the one-year and two-year lagged tests confirms that the audit fee premium is not limited to immediate awareness but persists as auditors fully incorporate the associated risk into their audit pricing.
Two-year lag of non-financial misconduct
| Variables | (1) | (2) |
|---|---|---|
| LAF | LAF | |
| LNPEN2 | 0.011*** (7.456) | |
| LNNUM2 | 0.118*** (7.273) | |
| Intercept | 10.510*** (71.109) | 10.534*** (71.295) |
| Control variables | Yes | Yes |
| Year and industry FE | Yes | Yes |
| N | 10,032 | 10,032 |
| Adjusted R2 | 0.795 | 0.795 |
*, ** and *** indicate significance (two-tailed) at 0.10, 0.05 and 0.01 levels, respectively. Standard errors are robust to heteroscedasticity and clustered by firm. The control variables used in Columns 1–2 are obtained from Model 1
7.5 Instrumental variable approach
To address potential endogeneity between non-financial misconduct and audit risk, given that weak governance may elevate multiple risks simultaneously, we use an instrumental variable (IV) approach as a robustness test. In the first stage, we regress LNPEN (LNNUM) on the instruments, LNPEN_LOCAL (LNNUM_LOCAL), along with the control variables from Model 1. The instrument is defined as the average LNPEN (LNNUM) of all other firms in the same city, excluding the focal firm. The instrument is relevant because firm culture and compliance are shaped by local environments, for example, shared media scrutiny, talent pools and peer pressure generate spillovers that make city averages strong predictors of a client’s own misconduct. At the same time, the misconduct of unrelated local firms is unlikely to directly affect a client’s audit fees, supporting the exclusion restriction [12].
As reported in Table 12, the first-stage results show that our instruments in Columns 1 and 3 are highly significant (p < 0.001). To ensure the validity of our IV approach, we provide several diagnostic tests. Our first-stage F-statistics (621.22 and 720.33) far exceed the Stock and Yogo (2002) 10% maximal IV critical value of 16.38, indicating that both our instruments are not weak. Additionally, the Shea’s partial R2 values (0.058 and 0.066) confirm that the instruments retain significant explanatory power after controlling for other covariates. Finally, the Kleibergen–Paap rank LM statistics (146.58 and 59.63) reject the null hypothesis of under-identification (p < 0.001). In the second stage, we use the predicted values of LNPEN and LNNUM (P_LNPEN and P_LNNUM) from the first stage as test variables in Model 1. The results of this test, presented in Table 12, show that the coefficients on both P_LNPEN and P_LNNUM remain positive and significant.
Instrumental variable approach
| Variables | (1) | (2) | (3) | (4) |
|---|---|---|---|---|
| LNPEN | LAF | LNNUM | LAF | |
| LNPEN_LOCAL | 0.642*** (10.554) | 0.660*** (14.809) | ||
| P_LNPEN | 0.014* (1.835) | |||
| LNNUM_LOCAL | ||||
| P_LNNUM | 0.124* (1.779) | |||
| Intercept | −2.746** (−2.268) | 10.389*** (54.068) | −0.646*** (−2.862) | 10.438*** (59.842) |
| Control variables | Yes | Yes | Yes | Yes |
| Year and industry FE | Yes | Yes | Yes | Yes |
| N | 10,233 | 10,233 | 10,233 | 10,233 |
| Adjusted R2 | 0.338 | 0.794 | 0.441 | 0.795 |
| Diagnostic tests: | ||||
| First-stage F-statistic | 621.22 | 720.327 | ||
| Shea’s Partial R2 | 0.058 | 0.066 | ||
| Kleibergen–Paap LM statistic | 146.582*** | 59.633*** |
*, ** and *** indicate significance (two-tailed) at 0.10, 0.05 and 0.01 levels, respectively. Standard errors are robust to heteroscedasticity and clustered by firm. The control variables are obtained from Model 1
7.6 Sensitivity analyses for unobserved confounding
We further conduct a series of sensitivity analyses to evaluate the robustness of our results to potential omitted variable bias. We first implement the selection-on-observables framework proposed by Altonji et al. (2005) and formally extended by Oster (2019). This method assesses how much stronger the selection on unobservable factors would need to be, relative to the selection on observables, to nullify our estimated association between non-financial misconduct and audit fees. Following standard literature benchmarks and assuming a maximum R2 (Rmax = 0.90), we calculate proportionality ratios (δ) of 1.0805 for LNPEN and 1.1191 for LNNUM. Both values exceed the critical threshold of 1.0, indicating that unobserved factors would need to be more influential than our entire set of observed controls to overturn the results. Next, we perform an Impact Threshold for a Confounding Variable analysis. We find that 74.27% (LNPEN) and 72.91% (LNNUM) of our estimates would need to be because of bias to invalidate the results. Corresponding Robust Inference Recovery values are 7,600 and 7,461, respectively, demonstrating substantial robustness to omitted variable bias. Finally, we implement Lewbel’s (2012) heteroskedasticity-based internal instruments. As shown in Table 13, both predicted values of LNPEN and LNNUM remain positively and significantly associated with audit fees (p < 0.05 and p < 0.01, respectively). Diagnostic tests, including First-stage F-statistics, Shea’s partial R2 and Kleibergen–Paap LM statistics, confirm the validity and strength of these instruments [13]. Together, these analyses provide strong evidence that our results are robust to unobserved confounding and potential endogeneity.
Lewbel (2012) heteroskedasticity-based identification
| Variables | (1) | (2) |
|---|---|---|
| LAF | LAF | |
| P_LNPEN | 0.005** (1.985) | |
| P_LNNUM | 0.077*** (3.314) | |
| Intercept | 10.380*** (54.816) | 10.414*** (58.140) |
| Control variables | Yes | Yes |
| Year and industry FE | Yes | Yes |
| N | 10,233 | 10,233 |
| Adjusted R2 | 0.793 | 0.794 |
| Diagnostic tests: | ||
| First-stage F-statistic | 34.88 | 73.616 |
| Shea’s Partial R2 | 0.256 | 0.421 |
| Kleibergen–Paap LM statistic | 530.303*** | 351.145*** |
*, ** and *** indicate significance (two-tailed) at 0.10, 0.05 and 0.01 levels, respectively. Standard errors are robust to heteroscedasticity and clustered by firm. The control variables are obtained from Model 1
8. Conclusion
In this paper, we investigate the relation between non-financial misconduct and audit fees. Prior research links non-financial misconduct to weak internal controls, unethical corporate culture, increased financial misstatements and greater litigation and regulatory risk, all of which heighten overall firm risk. From an audit perspective, such misconduct signals concerns about management integrity and control effectiveness, leading auditors to assess higher inherent and control risk and respond by increasing audit effort. As greater audit effort raises audit costs, the literature predicts a positive association between non-financial misconduct and audit fees.
Using a sample of US firms from 2007 to 2022, we regress the natural logarithm of audit fees on both the number and monetary value of non-financial misconduct penalties. Our results show that auditors charge significantly higher fees to clients involved in such misconduct. This effect is robust across various specifications and is particularly pronounced for violations related to government contracting, health care, competition and other miscellaneous categories. We also find that CEO turnover moderates this relationship by reducing the audit fee premium following misconduct. Finally, we document that increased audit effort, heightened engagement risk for high-reputation auditors and those serving highly visible clients and greater demand for specialist auditors serve as mechanisms liking non-financial misconduct to audit fees. Our findings carry practical implications for auditors, regulators and corporate boards. For auditors, the audit fee premium suggests that non-financial misconduct is a material risk factor that should be explicitly incorporated into audit planning and risk assessments. For regulators, our evidence underscores the financial consequences of misconduct and the importance of effective enforcement. The moderating role of CEO turnover highlights the potential for leadership changes to restore stakeholder confidence and reduce audit-related costs.
Finally, our study provides avenues for future research. Subsequent studies could examine whether similar dynamics are held in international contexts or among privately held firms. In addition, future research could explore in greater depth why certain types of non-financial misconduct pose greater audit risk than others or how governance mechanisms beyond CEO turnover influence auditors’ risk perceptions.
Notes
We refer restatements, securities class action lawsuits and Accounting and Auditing Enforcement Releases (AAERs) to as financial misconduct in this paper.
Violation Tracker data from 2000 to 2021 shows US companies paid approximately $575bn in fines for non-financial violations, exceeding the $276bn in fines for financial violations (Heese, 2024).
We measure non-financial misconduct using objective regulatory records to ensure consistency and replicability. Although penalties reflect ex-post outcomes, they serve as a key proxy for “tone at the top”. Following PCAOB AS Number 9, auditors consider management integrity and the regulatory environment, so enforcement actions act as high-visibility signals that may prompt reassessment of audit risk and planning.
One limitation of the Violation Tracker data is that it reports instances only after a firm has been caught and fined for misconduct which introduces two key assumptions in our methodology. First, we assume auditors are unaware of non-financial misconduct until a fine is issued. However, in practice, auditors may identify risk-related behaviors during investigations, even before penalties are imposed. Second, we assume that firms not receiving fines are free of misconduct, which may result in misclassification in cases where misconduct occurred but has not yet been detected or penalized. As we do not have access to data on undetected or pre-penalty cases, we are unable to perform sensitivity tests on this issue. Nevertheless, we believe that this limitation does not materially affect our findings, as it likely introduces a conservative bias making it harder to detect significant results.
The sum up of the first column of Table 1, Panel C exceeds 3,715 because a single firm-year may be associated with multiple types of misconduct.
As an additional robustness check, we re-estimate our main model using an alternative proxy, a dummy variable, which equals 1 for firms with non-financial misconduct in the prior year and 0 otherwise. The untabulated results still show the non-financial misconduct significantly increase audit fees.
While the “Other” category provides descriptive richness, we acknowledge that it aggregates heterogeneous misconducts, such as health-care fraud and anti-competitive practices, which may have distinct implications for financial reporting risk. Although our results indicate that this category carries the largest fee premium, we suggest that auditors may be responding to the heightened regulatory scrutiny and significant litigation risks common to these specific sectors.
The calculation uses the sample mean of the number of non-financial misconducts (1.224), its standard deviation (2.772) and the coefficient on LNNUM (0.116). We first calculate the percentage change in audit fees for a one standard deviation increase in number of non-financial misconducts without CEO turnover is 14.71%. This is calculated using the formula [(1 + 2.772/1.224)0.116 – 1]. This is applied to the mean audit fee of $4.306m, resulting in the premium without CEO turnover: $4,306,000 × 14.71% = $633,171.The marginal effect of number of non-financial misconducts when CEO turnover is present is 0.116 + (−0.037) = 0.079. Using this coefficient, the one standard deviation increases results in a 9.8% increase in audit fees – measured as [(1 + 2.772/1.224)0.079 – 1] – which translates to a dollar premium of $421,988 ($4,306,000 × 9.8%).The mitigation effect is the difference between the audit fee premium without turnover ($633,171) and the premium with turnover ($421,988), equaling $221,183.
While we focus on CEO turnover as an indicator of governance reform, we acknowledge that such leadership changes likely signal a broader remediation effort. This may include concurrent improvements in entity-level controls and compliance systems that inform auditors’ downward revisions of risk assessments.
While the results in Table 8 confirm that the positive association between non-financial misconduct and audit fees survives the inclusion of firm fixed effects, the attenuation of coefficients relative to the baseline model suggests that time-invariant firm characteristics account for a meaningful share of the explained variation. This pattern implies that much of the audit fee premium may reflect persistent differences in firm-level risk profiles rather than sharp, discrete responses to specific misconduct events. Misconduct may, therefore, serve as a salient and observable signal that is partially embedded in the broader, long-term risk character of the firm. We urge readers to interpret our results with appropriate caution.
While our instrument is grounded in prior research on local norms and spillovers, the exclusion restriction cannot be empirically verified and relies on theoretical assumptions. Factors such as local enforcement intensity, specific audit market conditions, or regional governance norms may directly affect audit fees. Thus, despite all the validity tests, we understand that there is still a possibility that our instrumental variable is not an appropriate instrument that will address endogeneity concerns. As a result, we caution readers when interpreting the results.
We find Shea’s partial R2 values of 0.256 and 0.421 for LNPEN and LNNUM, respectively, and First-stage F-statistics (34.88 and 73.62) that comfortably exceed standard thresholds. Finally, the Kleibergen-Paap rank LM statistics (530.30 and 351.15) reject the null hypothesis of under-identification (p < 0.01).
References
Further reading
Appendix
Variable definitions
| Variable | Definition |
|---|---|
| Dependent variables | |
| LAF | The natural logarithm of a client firm’s audit fees in the current year |
| Variables of interest | |
| LNPEN | The natural logarithm of One plus a client firm’s total monetary penalties because of non-financial violations in the prior year |
| LNNUM | The natural logarithm of One plus a client firm’s total number of non-financial violations in the prior year |
| LNPEN_labor (consumer, environment or other) | The natural logarithm of One plus a client firm’s total monetary penalties because of labor-related (consumer-related, environment-related, or other) violations in the prior year; the other category encompasses government contracting, health care, competition and miscellaneous violations |
| LNNUM_labor (consumer, environment or other) | The natural logarithm of One plus a client firm’s total number of labor-related (consumer-related, environment-related or other) violations in the prior year; the other category encompasses government contracting, health care, competition and miscellaneous violations |
| Control variables | |
| LIQ | Current assets divided by current liabilities |
| CA_TA | Current assets divided by total assets |
| INVREC | The proportion of total assets in receivables and inventory |
| ROA | Operating income after depreciation divided by total assets |
| LOSS | Equals 1 if the client firm reports a negative operating income after depreciation, else 0 |
| INTANG | Intangible assets divided by total assets |
| GC | Equals 1 if the client firm receives a going concern opinion, else 0 |
| MW | Equals 1 if the client firm reports a material weakness of internal controls, else 0 |
| RESTATE | Equals 1 if the firm announces a financial restatement in current year, else 0 |
| LEV | Total liabilities divided by total assets. |
| Z | Following Altman (1968), the Z-score is calculated using the following model: Altman Z-Score = 1.2A + 1.4B + 3.3C + 0.6D + 1.0E Where: A = working capital / total assets B = retained earnings / total assets C = earnings before interest and tax / total assets D = market value of equity / total liabilities E = sales / total assets |
| SIZE | The natural logarithm of the market value of equity |
| MERGER | Equals 1 if the firm engaged in a merger or acquisition in the current year, else 0 |
| FRGN | Equals 1 if the firm has foreign operations, else 0 |
| LNBUS | The natural logarithm of the number of business segments |
| LNGEO | The natural logarithm of the number of geographic segments |
| BUSY | Equals 1 if the client firm’s fiscal year ends in December, else 0 |
| BIG4 | Equals 1 if the audit office is a Big 4 auditor, else 0 |
| SP | Equals 1 if the auditor is both a city-level and a national-level specialist, else 0; city-level (national-level) specialist is the audit office has the largest market share in a city (in nation) based on audit fees in the client’s two-digit SIC industry and its market share is at least 10 percentage points greater than that of the next audit office (following Mayhew and Wilkins, 2003; Balsam et al., 2003); we define a city as a Metropolitan Statistical Area (MSA) |
| LNTENURE | The natural logarithm of the number of years an audit office served as the auditor of the client |
| AUD_CH | Equals 1 if there is an auditor change in the current year, else 0 |
| LNAF | The natural logarithm of non-audit fees |
| DUAL | Equals 1 if CEO is also served as chairman at the client firm, else 0 |
| CEOEXP | Equals 1 if CEO is also a financial expert, else 0 |
| TURNOVER | Equals 1 if the client firm experiences a CEO turnover in current year, else 0 |
| LAG | The natural logarithm of the number of calendar days between fiscal year-end to the audit report signing date |
| AF | The number of analysts following the firm |
| ToSP | Equals 1 if the client firm switches its auditor from non-specialist (i.e. SP = 0) to specialist (i.e. SP = 1), else 0 |
| Variables used in robustness tests | |
| TREAT | Equal to 1 for the treatment group and 0 for the control group used in PSM approach in Section 7.2 |
| LNPEN2 | The natural logarithm of 1 plus a client firm’s total monetary penalties because of non-financial violations in the t – 2 year |
| LNNUM2 | The natural logarithm of 1 plus a client firm’s total number of non-financial violations in the t – 2 year |

