
This paper describes the installation and interpretation of strain gauges embedded in the sprayed concrete lining of the concourse tunnel at Heathrow Terminal 4 station, with readings taken over nearly 20 years. The rate of flow method was used to back-calculate stresses from the measured strains, which were then compared with the stresses obtained from pressure cells at the same locations. Interpretation of the pressure cell data and the pressure cell results have been published in earlier papers. The resulting 20-year history of stress and strain gives precious insights into the short- and long-term behaviour of a sprayed concrete lining. An increase in compressive strain up to 3 years followed by a slight decrease over the subsequent 15–16 years has been revealed. It is hypothesised that this is due to radial groundwater flow through the primary lining followed by the gradual application of hydrostatic water pressure to the waterproof membrane and secondary lining. The sprayed concrete primary lining was not designed for permanent loads but nevertheless appears to be supporting all of the effective stress, whereas the secondary lining is not supporting any ground loads but may be loaded by groundwater pressure.
Notation
- a1, b1, a2, b2
coefficients used in the Byfors (1980) equation for compressive strength development
- B
relaxation time
- dJ/dt
creep compliance rate
- E
Young’s modulus
- fc
compressive strength
- G
shear modulus
- GK
Kelvin spring stiffness
- K
bulk modulus
- n
number of current timestep
- t
time (or age of sprayed concrete)
time at current timestep n
time at previous timestep (n−1)
timestep duration ()
strain
flow strain between timesteps (n−1) and n
sum of strain in the generalised Kelvin element due to stress at timestep n and the delayed elastic strain between (n−1) and n
strain at timestep n
shrinkage strain at age t
shrinkage strain between timesteps (n−1) and n
ultimate shrinkage strain
thermal strain between timesteps (n−1) and n
product of the relaxation time B and GK, such that when t = B, 0.632 = (1− e−t/B)
- σ
stress
1. Introduction
Strains are interesting in and of themselves, but the stress state of a geotechnical structure is of more interest to designers, whose design is based on limit states of stress. This paper presents a case history of tangential strains measured by two arrays of 24 strain gauges embedded in the sprayed concrete primary lining of the Heathrow Express Terminal 4 concourse tunnel, constructed in 1996. An attempt to back-calculate the tangential stresses in the lining is described and compared with measurements made by tangential pressure cells and radial pressure cells presented in a recent paper (Jones et al., 2023).
In order to back-calculate stresses from a history of measured strains, the strains due to thermal expansion and contraction, shrinkage and creep must first be removed. The remaining strain is then due to stress. Since creep is dependent on stress level, concrete age and time, a timestepping algorithm was proposed by England and Illston (1965) called the ‘rate of flow method’, in which the strain is broken down into:
- ▪
instantaneous elastic strain
- ▪
delayed elastic strain (‘recoverable creep’ or ‘primary creep’)
- ▪
flow (‘irrecoverable creep’ or ‘secondary creep’).
For sprayed concrete loaded at an early age, shrinkage strains and thermal strains during hydration are important. Therefore, terms have been added to England and Illston’s formulation to take account of these effects, initially by Schubert (1988) with further developments by Golser et al. (1989), Golser and Brandl (1996) and Golser and Kienberger (1997).
The basic timestep formulation of the rate of flow method will include an elastic and a delayed elastic part represented by a generalised Kelvin model with one or sometimes two Kelvin elements, a flow part often represented by a power law, and a shrinkage and thermal strain part as follows (Schubert, 1988):
where n is the current timestep, ε(f) is the flow strain between timesteps (n − 1) and n, ε(sh) and ε(th) are the shrinkage and thermal strains between (n − 1) and n, respectively, and ε(K) is the sum of the strain in the generalised Kelvin element due to stress at timestep n and the delayed elastic strain between timesteps (n − 1) and n.
England and Illston (1965) used two Kelvin elements, representing a slow and a fast component, although the principles of the rate of flow method may be used with any constitutive law. Thomas (2003) used a single Kelvin element in a creep model for numerical analysis of a sprayed concrete tunnel, which for the uniaxial case is given by:
where is stress, K is the bulk modulus, G is the shear modulus, GK is the Kelvin spring stiffness, and ηK is the product of the relaxation time B and GK, such that when t = B, 0.632 = (1 − e−t/B). The elastic stiffness parameters G and K are age-dependent. This element is shown in Figure 1(a) and the effect of loading and unloading this element over time is illustrated in Figure 1(b).
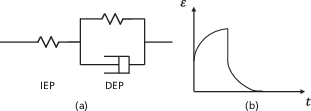
(a) Generalised Kelvin element with instantaneous elastic part (IEP) and delayed elastic part (DEP). (b) Effect of loading and unloading element
(a) Generalised Kelvin element with instantaneous elastic part (IEP) and delayed elastic part (DEP). (b) Effect of loading and unloading element
Based on this model, the delayed elastic effects of previous load increments in previous timesteps are still ongoing in the current increment. This means that an additional Kelvin element is added at every timestep and Equation 2 becomes Equation 3 (Jones et al., 2005), where the delayed elastic strains of all previous stress increments (r) are considered:
The age-dependent stiffness parameters were calculated from the following relationship between Young’s modulus and compressive strength proposed by Chang and Stille (1993):
where fc is the compressive strength, given by Equation 5 based on the work of Byfors (1980) and Kuwajima (1999), and also used in Jones et al. (2023) where a fuller explanation is given.
In Equation 5, t is the age of the sprayed concrete (in hours), fc,28d is the compressive strength at 28 days, a1 = 0.30%, b1 = 2.676, b2 = 0.188 and a2 = 29.446%.
This generalised Kelvin model within the framework of the rate of flow method was applied to strains measured during early-age uniaxial creep tests performed on cylinders cored from sprayed concrete panels prior to the Heathrow Terminal 5 works. The calculated stresses were found to give good agreement with the applied loads (Jones et al., 2005).
The flow strain at timestep n (ε(f)n) may be given by the relationship proposed by Acker and Ulm (2001):
where dJ/dt is the compliance rate at age t days:
The shrinkage model is the same as that used for interpretation of the tangential pressure cells (Jones et al., 2023) and is based on the ACI (1978) formula as follows:
where εsh is the shrinkage strain at age t (in days), εsh,∞ is the ultimate value of shrinkage strain and B is a constant that determines how quickly the final value is reached. Jones (2007) found B = 55 days for a sprayed concrete test panel from the Heathrow Terminal 5 works and this value is used here. Shrinkage is assumed to stop when the waterproof membrane is installed inside the primary lining, preventing further drying.
The ultimate shrinkage strain was assumed to be 500 με. Values in the sprayed concrete literature vary, with most values in the range 500–1000 με (e.g. 900 με at 140 days (Zghondi and Armand, 2018), 700–800 με at 90 days (Malmgren et al., 2005) and 575–700 με at 81 days (Min et al., 2010)). These tests were on small specimens allowed to dry in a laboratory and therefore may not be appropriate for a thick lining drying only at the intrados. Golser et al. (1989) performed in situ shrinkage tests in the tunnel lining and found that shrinkage varied from zero at the invert to an ultimate shrinkage tending towards 500 με at the crown, with shrinkage on the sidewalls approximately 50% of this value. The value of 500 με was chosen for the Heathrow Terminal 4 concourse tunnel because it gave the best agreement between stresses measured by tangential pressure cells and stresses back-calculated from strain gauges (see later in this paper and Jones and Clayton (2021)), and also fitted in well with values of stress induced by shrinkage strain in a sprayed concrete test panel from Heathrow Terminal 4 (Clayton et al., 2002).
2. Heathrow Express Terminal 4 station concourse tunnel
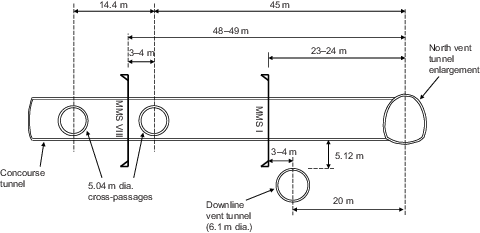
The layout, geology, construction sequence and construction details of the concourse and platform tunnels have been described by van der Berg et al. (2003), Clayton et al. (2006) and Jones et al. (2023), but important details are replicated here. The layout of the Heathrow Express Terminal 4 station is shown in Figure 2. It consists of two platform tunnels with a central concourse tunnel at the northeastern end. These tunnels are connected by a series of cross-passages and connected to the north and south ventilation tunnels at each end, which were constructed after the concourse tunnel. The downline ventilation tunnel, which connects the north ventilation tunnel to the downline platform tunnel, underpassed the concourse tunnel while the concourse tunnel was itself being constructed. These events will be highlighted when the strain results are presented.
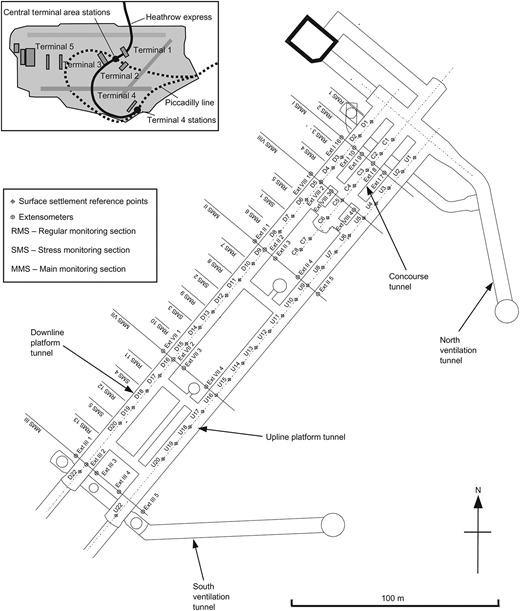
Plan of tunnels at Heathrow Express Terminal 4 station, showing location of concourse tunnel and layout of monitoring points and instruments (source: van der Berg et al., 2003)
Plan of tunnels at Heathrow Express Terminal 4 station, showing location of concourse tunnel and layout of monitoring points and instruments (source: van der Berg et al., 2003)
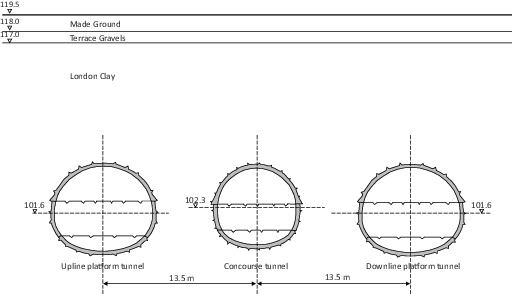
The platform tunnels are over 220 m long with a cross-sectional area of 62 m2. The concourse tunnel is 64 m long with a cross-sectional area of 49 m2. A cross-section of the concourse and platform tunnels is provided in Figure 3, which also shows the surface level and geological strata. The concourse tunnel axis is 17.2 m below ground level and the tunnel is entirely within London Clay. Piezometers across the site and at different depths indicated a piezometric level in the Terrace Gravels at approximately ground level with a hydrostatic distribution from there down to the basal beds of the London Clay, well below the tunnel horizon (van der Berg et al., 2003). The centreline spacing between the concourse tunnel and the platform tunnels is 13.5 m, as shown in Figure 3.
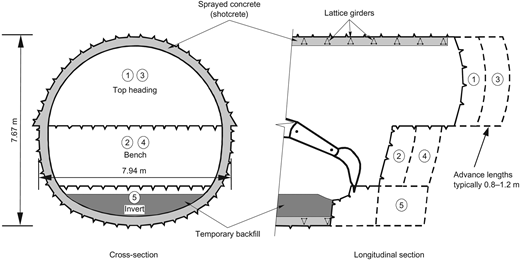
The construction sequence for the concourse tunnel used a top heading, bench, top heading, bench, double-invert sequence. The invert was closed five rounds from the face. The construction sequence is schematically illustrated in Figure 4. A detailed description is provided in the online supplementary material. The primary support for the concourse tunnel consisted of 350 mm of sprayed concrete (shotcrete), reinforced with two layers of welded wire mesh and full-section lattice girders.
This paper will focus on the strain gauges installed in main monitoring section I (MMS I) and main monitoring section VIII (MMS VIII) of the concourse tunnel. The locations of these sections are shown in Figure 5 and in the location plan (Figure 2).
At each section, 24 strain gauges were installed, all in a tangential orientation. A pair of strain gauges, one near the intrados and one near the extrados, were installed at each of the 12 positions shown in Figure 6.
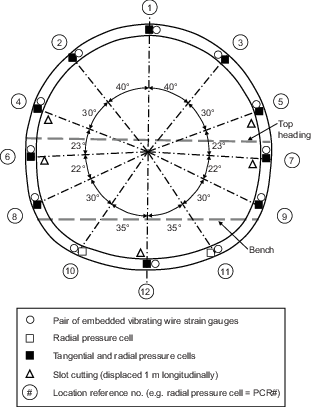
Main monitoring section schematically showing locations of pressure cells and strain gauges embedded in the sprayed concrete primary lining
Main monitoring section schematically showing locations of pressure cells and strain gauges embedded in the sprayed concrete primary lining
3. Field measurements obtained by strain gauges
The mounting blocks at each end of the strain gauges were welded to a 500 mm long 8 mm dia. steel reinforcement bar, which was then tied to either the inner (denoted -INT) or outer (denoted -EXT) layer of welded wire mesh. The outer strain gauges were sprayed with sprayed concrete before the inner layer of mesh and inner strain gauges were fixed and then subsequently they too were sprayed in. The theoretical positions of the strain gauges give them 40–50 mm concrete cover at the extrados and intrados of the 350 mm thick lining, meaning they are approximately 250 mm apart.
Tangential strains measured by the strain gauges are shown in Figure 7 for MMS I and Figure 8 for MMS VIII. In these figures, the data are plotted on three different timescales, for clarity. In this section, the strains presented will include elastic, delayed elastic and creep (flow) strains due to loading, shrinkage strain, and thermal strains due to a difference between the coefficients of thermal expansion of the strain gauge and the surrounding concrete. An attempt to remove these effects and back-calculate the tangential stress will be presented later in the paper.
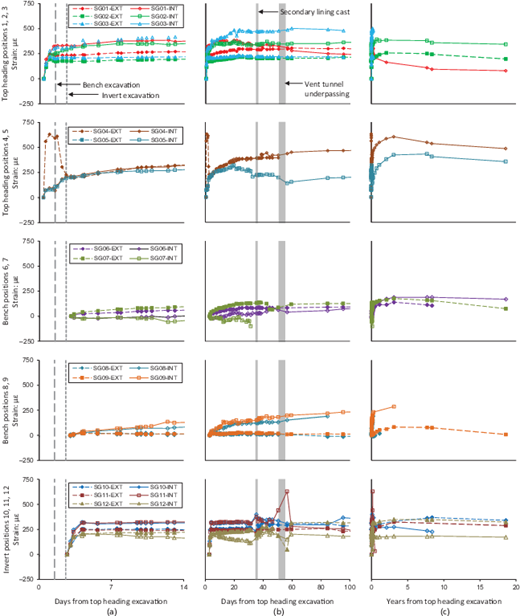
MMS I tangential strains: (a) the first 14 days; (b) the first 100 days; (c) full 20-year history. Compression is positive
MMS I tangential strains: (a) the first 14 days; (b) the first 100 days; (c) full 20-year history. Compression is positive
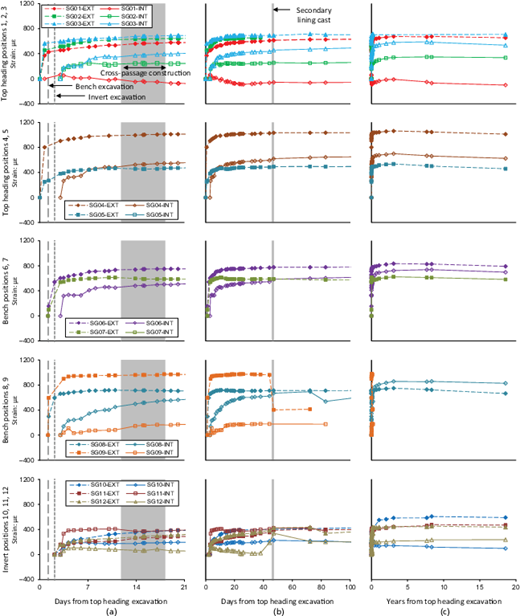
MMS VIII tangential strains: (a) the first 21 days; (b) the first 100 days; (c) full 20-year history. Compression is positive
MMS VIII tangential strains: (a) the first 21 days; (b) the first 100 days; (c) full 20-year history. Compression is positive
3.1 MMS I tangential strains
One very important thing to note about the MMS I strain gauges is that, unlike the pressure cells, there was a significant delay before the first readings were obtained. The first reading of the top heading strain gauges (positions 1–5) occurred 9 h after the first reading of the pressure cells, for the bench strain gauges (positions 6–9) the delay was 37 h and for the invert strain gauges the delay was 3 h. This means that significant early strains will have been missed and this explains why the magnitude of strains in MMS I is generally lower than in MMS VIII, where the delay was shorter for many of the strain gauges. Survivability and missing data are discussed in the online supplementary material.
During the first 14 days (Figure 7(a)), compressive strain was generally increasing with time. In the upper part of the top heading (positions 1–3), there was a clear difference between the strain gauges near the extrados (EXT) and those near the intrados (INT), with the intrados experiencing more compressive strain than the extrados. This therefore indicates a hogging bending moment (an increase in lining curvature) at this location. The lower part of the top heading (positions 4 and 5 (second row of graphs in Figure 7) tells a different story, with strain gauge SG04-EXT rising quickly to a marked peak and then returning to a similar value to the intrados strain gauges at around the time of ring closure. Unfortunately, strain gauge SG05-EXT was not functioning, so this behaviour could not be corroborated on the other side of the tunnel.
Due to the long delay before first reading, the bench strain gauges (positions 6–9 (third and fourth rows of graphs in Figure 7)) only showed changes in strain after ring closure at the invert. At positions 6 and 7 there was a sagging bending moment increment (a decrease in lining curvature) and at positions 8 and 9 there was a hogging increment.
In the invert (positions 10–12), strains increased rapidly in the first 24–36 h after ring closure. Strains at positions 10 and 11 were larger than at position 12 in the centre of the invert, which one might expect given the distribution of ground pressure measured by the radial pressure cells (Jones et al., 2023), with higher values measured at positions 10 and 11 than at position 12. At positions 10 and 11, the intrados strains were larger than the extrados strains, indicating a hogging moment. At position 12, the intrados and extrados strains were initially similar but diverged with time into a sagging moment. This is exactly what one would expect to happen given the flattened shape of the sprayed concrete lining at the invert.
When the secondary lining invert was cast at 35 days (Figure 7(b)), there was no noticeable effect on the top heading and bench strain gauges. At the invert, however, the sagging deformation at position 12 was partially reversed, which was caused by the weight of the secondary lining invert concrete. At positions 10 and 11, intrados strains increased and then decreased again, and extrados strains decreased and then increased again. The reason for this is not certain but it could be the temperature increase caused by secondary lining hydration interacting with the added weight.
Underpassing of the vent tunnel had a much more dramatic effect (Figure 7(b)). The changes in strain in the top heading and bench were small, but large changes occurred in the invert. At position 12 there was a reduction in compressive strain due to unloading as the vent tunnel approached, followed by a return to approximately the previous level of compressive strain as it passed. SG11-INT experienced a dramatic increase in compressive strain, followed by a reduction, while SG10-INT experienced a gradual reduction of compressive strain. SG10-EXT and SG11-EXT did not change noticeably. To give some meaning to the strain changes, if the Young’s modulus of the sprayed concrete were assumed to be 30 GPa, the change of approximately 200 με experienced by SG11-INT and SG12-EXT would represent a change in stress of 6 MPa.
Over the long term (Figure 7(c)), there was a general trend of a slight increase in compressive strain between 100 days and about 3 years, followed by a slight decrease in compressive strain over the subsequent 15–16 years.
3.2 MMS VIII tangential strains
Figure 8 shows the tangential strains measured by strain gauges in MMS VIII. The first readings after installation were taken soon after the extrados strain gauges had been sprayed in, earlier than for MMS I and resulting in larger measured strains (note the difference in vertical scales in Figure 8 and Figure 7). However, the first readings of the intrados strain gauges were delayed significantly. In the top heading, the delay was 16.5 h for SG01-INT and 71.5 h for SG02-INT, SG03-INT and SG04-INT. In the bench the delay was 43 hours and in the invert the delay was 20.5 hours.
During the first 21 days (Figure 8(a)) compressive strain generally increased monotonically with time. The intrados (INT) strain gauges registered smaller compressive strains than the extrados (EXT) strain gauges. This is due, at least in part, to the construction sequence – the outer layer was sprayed first allowing it to gain stiffness and take on ground load earlier than the inner layer of sprayed concrete – but also to the long delay between the first reading of the extrados strain gauges and the intrados strain gauges, resulting in missed strains at a time when they should be increasing rapidly. Note that the upper top heading at positions 1, 2 and 3 in MMS I showed higher compressive strains at the intrados, whereas the pattern was reversed in MMS VIII because of the delay before the first readings of the intrados strain gauges.
At the invert, in the short term, a similar pattern emerged as for MMS I, where a sagging bending moment was generated in the centre of the flattened invert at position 12, while hogging moments were generated at positions 10 and 11 where the lining profile had a high curvature and hence higher stiffness.
Figure 8 shows that the nearby construction of cross-passages did not have a dramatic effect on the tangential strains at MMS VIII, although an increase in compressive strain at the intrados at the sides of the tunnel is evident. This is consistent with the behaviour observed in the radial and tangential pressure cells (Jones et al., 2023).
Casting the in situ concrete secondary lining invert section at 46.5 days had an effect on strains around the invert (Figure 8(b)). As for MMS I, the weight of the secondary lining to some extent reversed the sagging moment in the centre of the invert at position 12. SG09-EXT also measured a dramatic drop in compressive strain at this time. This was repeated for a subsequent reading, but then the strain gauge stopped functioning, so these readings were possibly due to a fault.
In the long term, as for MMS I, the strain readings remained very stable and more or less constant, with a slight increase in the first 3 years followed by a slight decrease over the subsequent 15–16 years (Figure 8(c)).
4. Back-calculation of stress using the rate of flow method
The back-calculation algorithm was implemented in Matlab version R2017b. Timesteps were set at 1 min intervals for the first 2 h, then 6 min intervals up to 2 days, then 1 h intervals from then on. The algorithm took 10 min to back-calculate stresses for each strain gauge using a computer with a 2.7 GHz 4-core CPU. An example showing the breakdown of strains calculated using the rate of flow method for a single strain gauge is shown in Figure 9 for the first 200 days. The delayed elastic, flow and shrinkage strains were subtracted from the strain after temperature correction to arrive at the elastic strain at each increment, and the elastic strain was then converted to a stress using age-dependent elastic moduli.
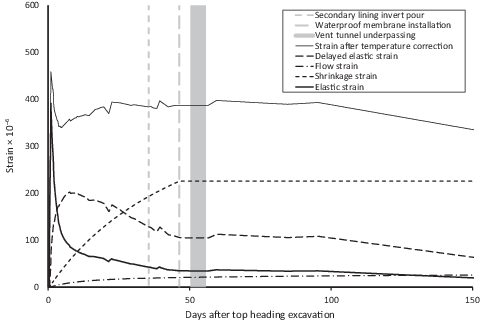
Components of strain calculated from MMS I strain gauge SG01-EXT using the rate of flow method
Components of strain calculated from MMS I strain gauge SG01-EXT using the rate of flow method
The relative importance of the different strain components in Figure 9 should be noted. Thermal, shrinkage and delayed elastic strains were of a similar or greater order of magnitude than the elastic strains. Therefore, it is not possible to calculate concrete stresses by simply multiplying the strain by the Young’s modulus without introducing gross errors, particularly at early age. It also means that the rate of flow method is sensitive to the input parameters, especially the shrinkage parameter (B) and the ultimate shrinkage (εsh,∞).
The tangential stresses back-calculated from strain gauges SG01-EXT and SG01-INT in MMS I are shown in Figure 10, along with the tangential stress measured by tangential pressure cell PCT1 at the same location.
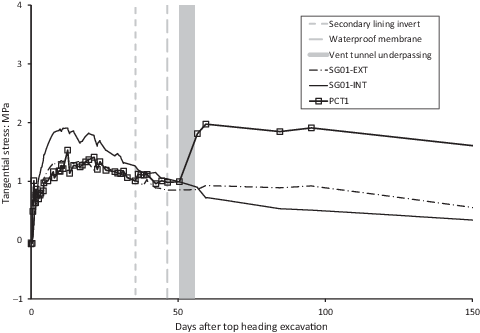
Tangential stress at MMS I position 1 measured by tangential pressure cell PCT1 and back-calculated from strains measured by SG01-EXT and SG01-INT
Tangential stress at MMS I position 1 measured by tangential pressure cell PCT1 and back-calculated from strains measured by SG01-EXT and SG01-INT
Given that the strain gauges are near the extrados and intrados and the tangential pressure cell is at the centre of the section, one cannot expect the magnitudes of the stresses to be the same; indeed, it would be remarkable if they were. However, the general pattern of stresses was similar until the underpassing of the vent tunnel occurred. PCT1 measured a marked increase in stress during underpassing of the vent tunnel, whereas the strain gauges indicated a small increase in stress at the extrados and a small decrease at the intrados.
4.1 MMS I back-calculated tangential stresses
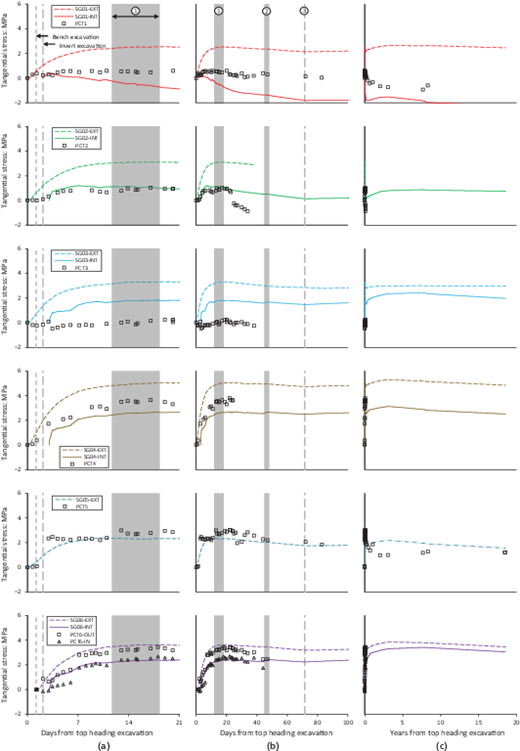
Figure 11 shows the back-calculated stresses for each of the MMS I strain gauge positions (as before, the data are plotted on three different timescales, for clarity). Also shown on the graphs are the results from the tangential pressure cells. Since there were no tangential pressure cells at positions 10 and 11, results from the neighbouring pressure cells are presented. The circled numbers in Figure 11 denote pouring of the secondary lining invert (①), installation of the full-round waterproof membrane (②) and underpassing of the vent tunnel (③).
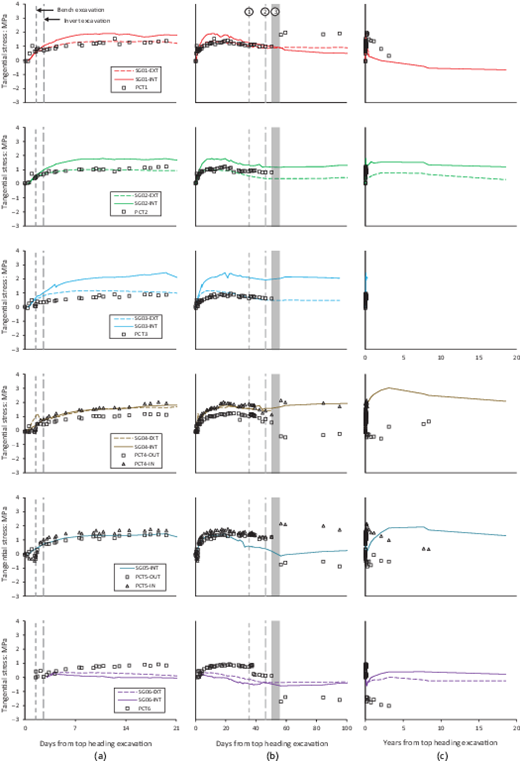
MMS I tangential stresses back-calculated from strains: (a) the first 21 days; (b) the first 100 days; (c) the full 20-year history. Each row shows one position (cf. Figure 5). The circled numbers denote pouring of the secondary lining invert (①), installation of the full-round waterproof membrane (②) and underpassing of the vent tunnel (③)
MMS I tangential stresses back-calculated from strains: (a) the first 21 days; (b) the first 100 days; (c) the full 20-year history. Each row shows one position (cf. Figure 5). The circled numbers denote pouring of the secondary lining invert (①), installation of the full-round waterproof membrane (②) and underpassing of the vent tunnel (③)
Top heading positions 1–5 show a similar tangential stress from back-calculation and from the tangential pressure cells. The 9 h delay between the first reading of the pressure cells and the first reading of the strain gauges had little effect because very little load had come onto the lining in the first 9 h. Pouring the secondary lining invert section and installation of the full-round waterproofing membrane seem to have little effect on the tangential stresses from the pressure cells or back-calculated from the strain gauges. The underpassing of the vent tunnel, however, did have a significant effect on the stresses measured by the pressure cells, but a much smaller effect on the stresses back-calculated from the strain gauges. The reason for this is not certain but it could be that pressure cells are particularly sensitive to bending stresses or that the strain gauges are measuring strains in the steel reinforcement bars whereas the pressure cells are measuring stress in the sprayed concrete and, due to cracking or plasticity, the strains are not fully compatible.
At bench positions 6–9, the delay to the first reading of the strain gauges was 37 h, which explains the relatively low or even negative strains measured at these locations and the concomitantly low values of back-calculated stress. Again, the underpassing of the vent tunnel had a dramatic effect on the tangential pressure cells, but only a small effect on the stress back-calculated from the strain gauges. This is consistent with the fact that only small changes in strain were measured (cf. Figure 7).
At invert positions 10–12, stresses back-calculated from strains are compared to tangential pressure cell results from positions 8, 9 and 12 since there were no tangential cells installed at positions 10 and 11. PCT12 experienced loss of contact at about 20 days as the concrete gradually cooled after the hydration peak and was only restored by crimping at 37 days (Jones et al., 2023) – hence the gap in the data. The stresses back-calculated from strains did change significantly during underpassing of the vent tunnel, particularly at SG11-INT, which showed a marked but transient increase in compressive stress, indicating a hogging bending moment, and at both SG12-INT and SG12-EXT, which showed a marked but mostly transient reduction in compressive stress. It is interesting to note that during the underpassing, the changes in strain and hence back-calculated stress tended to be transient and the changes in stress measured by the tangential cells tended to be permanent, which may be further evidence that plasticity or microcracking disrupted the stress concentrations around the edges of the tangential cells built up by shrinkage and temperature effects.
In the long term (Figure 11(c)), the back-calculated stresses followed a similar pattern to the strains, with an increase in compressive stress in the first 3 years, followed by a slight gradual decrease over the subsequent 15–16 years. This behaviour was not discernible in the tangential stresses measured by the pressure cells.
4.2 MMS VIII back-calculated tangential stresses
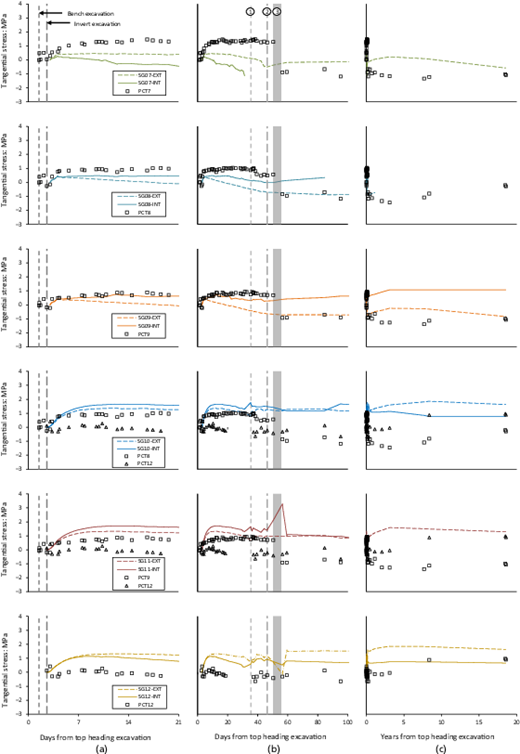
Figure 12 shows the back-calculated stresses for each of the MMS VIII strain gauge positions in the same way as for MMS I in Section 4.1, except that in this case the circled numbers denote construction of the nearby cross-passage (①), casting of the invert section of the secondary lining (②) and installation of the full-round waterproof membrane (③). At all positions, the first readings of the extrados (EXT) strain gauges were taken at the same time as the pressure cells, soon after installation. However, the intrados strain gauges had a delay to first reading of 16.5 h at SG01-INT, 71.5 h at SG02-INT, SG03-INT and SG04-INT, a delay of 43 h for all the bench intrados strain gauges and a delay of 20.5 h for all the invert intrados strain gauges.
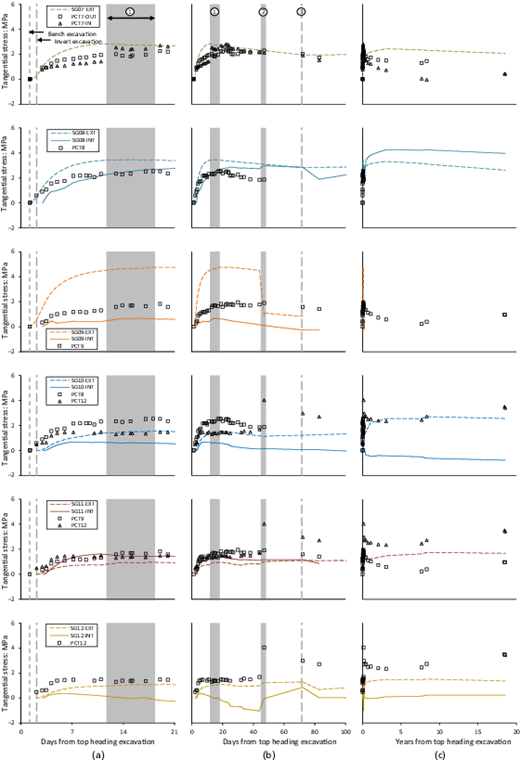
MMS VIII tangential stresses back-calculated from strains: (a) the first 21 days; (b) the first 100 days; (c) the full 20-year history. Each row shows one position (cf. Figure 5). The circled numbers denote construction of the nearby cross-passage (①), casting of the invert section of the secondary lining (②) and installation of the full-round waterproof membrane (③)
MMS VIII tangential stresses back-calculated from strains: (a) the first 21 days; (b) the first 100 days; (c) the full 20-year history. Each row shows one position (cf. Figure 5). The circled numbers denote construction of the nearby cross-passage (①), casting of the invert section of the secondary lining (②) and installation of the full-round waterproof membrane (③)
At position 1, the tangential stress from the pressure cell was widely bracketed by the stresses back-calculated from strains, with a higher compressive stress at the extrados and a lower compressive stress at the intrados, becoming tensile after 7 days. This implies a sagging bending moment, the opposite of the hogging bending moment found at MMS I positions 1–3, although this may be caused or exaggerated by the delay (of 16.5 h) for the first reading of SG01-EXT. In all of the top heading positions 1–5, the rise in back-calculated stress at the extrados was very consistent, if differing in magnitude between approximately 2 MPa and 5 MPa. The increase in back-calculated stress at the intrados at positions 2–4 was also consistent and may have been of similar magnitude or even higher than at the extrados if there had not been a delay of 71.5 h to first reading. The effect of nearby cross-passage construction was not noticeable, except perhaps in a slight increase in tangential stress measured by PCT4 and PCT5.
The bench stresses showed a similar pattern to the top heading in the first 21 days (Figure 12(a)). The back-calculated stresses at the extrados were higher than at the intrados, due to the delay to first reading of the intrados strain gauges of 43 h. The agreement between back-calculated stress and stress measured by the tangential cells was reasonably good, though the extrados stress was generally higher. The agreement between SG06-EXT and PCT6-OUT and between SG06-INT and PCT6-IN was very good, helped by the fact that PCT6-IN measured very little increase in stress in the first 43 h. The effect of nearby cross-passage construction was only clearly evident in PCT7-IN, but unfortunately SG07-INT was not functioning to give a comparison.
Around the invert, the higher compressive stress at SG11-INT compared to SG11-EXT, despite having a delay to first reading of SG11-INT of 20.5 h, indicates a hogging bending moment. At position 10, the same behaviour was not seen but hogging bending may have been present if a strong increase in compressive strain had occurred at SG10-INT before readings began. SG12-EXT and SG12-INT indicate the likelihood of sagging bending at the centre of the invert. The nearby cross-passage construction does not appear to have had a significant effect on any of the invert stresses. Casting the invert section of the secondary lining caused an increase in compressive stress at position 12 only, with a larger increase at the intrados than at the extrados, indicating the hogging bending moment (increase of lining curvature) one would expect from application of a vertical load. The increase in compressive stress measured by PCT12 was higher than that back-calculated from the strain gauges.
In the long term (Figure 12(c)), the back-calculated stresses followed a similar pattern to the strains, with an increase of compressive stress in the first 3 years, followed by a slight gradual decrease over the subsequent 15–16 years. Again, this behaviour was not discernible in the tangential stresses measured by the pressure cells.
5. Discussion
The fact that the back-calculated stresses gave similar results to the tangential pressure cells at many locations gives confidence that the parameters used in the back-calculation were approximately correct. In particular, the shrinkage strain parameters have an important effect on the interpretation of the tangential pressure cells and on the back-calculation of stresses from strains. At a sprayed concrete Young’s modulus of 30 GPa, an increase in shrinkage strain of 100 με would require a correction of approximately 0.5 MPa to the recorded pressure measured by a tangential pressure cell (Jones and Clayton, 2021; Jones et al., 2023). In the rate of flow method, the same assumed increase in shrinkage strain would reduce the back-calculated stress by 0.3 MPa. This difference in effect means that if the magnitude or rate of shrinkage strain were assumed to be higher or lower, the back-calculated stress and tangential pressure cell stress would diverge. Therefore, broad agreement between stress back-calculated from strains and stress measured by tangential pressure cells indicates that the assumed values for shrinkage strain must be approximately correct.
In general, the pressure cells were more sensitive to small changes in stress than the strain gauges, particularly when the sprayed concrete had matured. In particular, the installation of the invert section of the secondary lining, the underpassing of the vent tunnel and the construction of nearby cross-passages had a much larger effect on the radial and tangential pressure cells than on the strain gauges (see also Jones et al. (2023)). A large reduction in stress measured by a tangential pressure cell could be due to the formation of microcracks, increased creep or plasticity, that released or redistributed stress concentrations around the edges of the embedded pressure cell. These stress concentrations build up due to crimping, shrinkage and temperature sensitivity (Jones and Clayton, 2021; Jones et al., 2023).
In the long term, strains and back-calculated stresses increased over the first 3 years and then experienced a slight decrease over the subsequent 15–16 years. This occurred at virtually all strain gauge locations. However, the stresses measured by both the radial and tangential pressure cells did not exhibit the same pattern of behaviour, but mostly remained relatively constant (Jones et al., 2023). Therefore, there is no evidence of a significant change in loading due to secondary creep, consolidation or swelling of the London Clay. A potential explanation is that this is due to water movement. Over the first 3 years, water was flowing towards the tunnel until the accessible pores and any construction joints or cracks in the sprayed concrete lining and any space between the sprayed concrete and the waterproof membrane were filled. During this time, water pressure was being applied to the primary lining. From 3 years up to the present day, water pressure at the interface between the primary sprayed concrete and cast secondary lining has gradually increased, causing a reduction in the sprayed concrete primary lining’s effective stress and hence a reduction in compressive strain. Since pressure cells measure total stress, they do not care where the water pressure is acting and therefore have not registered any change. Without long-term pore pressure measurements and/or instrumentation of a secondary lining as well as a primary lining, it is not possible to definitively prove or disprove this hypothesis.
The back-calculation worked well and gave reasonable results. Its accuracy could be much improved by obtaining stiffness, shrinkage and creep parameters for the sprayed concrete at appropriate levels of temperature and humidity, as well as by taking readings more frequently, particularly at early age. Unloaded sprayed concrete panels kept in the tunnel under the same environmental conditions and fitted with strain gauges could also assist in the determination of parameters. In reality, shrinkage and temperature will vary significantly across the thickness of the sprayed concrete and at different locations around the lining, but they were assumed to be constant here. More complex models could be implemented in the future to take account of these effects on the strains and stresses in a sprayed concrete lining. Slot cutting showed that the inner 100 mm of the sprayed concrete lining was either at zero stress or in tension, but the steel mesh reinforcement was in compression (Jones et al., 2023), so it is likely that the compressive strains and the stresses back-calculated using the rate of flow method at most locations around the intrados were measuring compression in the steel mesh reinforcement rather than the sprayed concrete. For these reasons it is a very complex problem, but it is hoped that this paper has led the reader many steps in the right direction.
6. Conclusions
A unique case study of strains in a sprayed concrete primary lining over nearly 20 years has been presented. This will be of use to designers and researchers who wish to calibrate numerical models or who are making field measurements themselves.
As well as the development of strains during construction, a long-term increase up to 3 years followed by a slight decrease over the subsequent 15–16 years has been revealed. It is hypothesised that this is due to radial groundwater flow followed by the gradual application of hydrostatic water pressure to the waterproof membrane and secondary lining. The sprayed concrete primary lining was not designed for permanent loads but nevertheless appears to be supporting all of the effective stress. The secondary lining is not supporting any ground loads after 20 years but will eventually support all of the water loads. In modern sprayed concrete tunnels it is common to design the primary lining as a permanent durable part of the structure for the whole design life; therefore cost and carbon savings could be made on the thickness of the secondary lining if it is only designed for groundwater pressure. Instrumentation of both primary and secondary linings at the same location is needed to substantiate this.
Using a modified rate of flow method, tangential stresses were back-calculated from measured strains by modelling temperature, shrinkage and both reversible and irreversible creep. A large proportion of the strains were not due to loading, so simple elastic models will underpredict deformations and simple methods of back-calculation will overpredict stresses. As demonstrated by Thomas (2003), modelling creep will have a significant effect on the stresses predicted in a sprayed concrete tunnel lining, and it is likely that modelling thermal and shrinkage strains will also have a significant effect. In order to validate these kinds of design models, more field measurements of stresses and strains in sprayed concrete linings are needed.
Acknowledgements
This work has spanned many years and there have been many people and organisations involved. The authors thank Heathrow Express and BAA for allowing the long-term monitoring to continue into the operational phase of the tunnel. The instruments were installed by Balfour Beatty, who constructed the tunnels at Terminal 4 and took construction-phase readings. The monitoring plans were developed by Mott MacDonald. Part of the interpretation work was done by Dr Benoît Jones as part of his EngD at the University of Southampton, supervised by Prof. Chris Clayton and sponsored by Mott MacDonald and EPSRC. Long-term readings were taken by Dr Jones with assistance from Dr Alun Thomas, David Watson and Charly Grand. The back-calculation of stresses from strains was programmed in Matlab by Charly Grand as part of an MSc project at the University of Warwick co-supervised by Prof. Vincent Labiouse at the École Polytechnique Fédérale de Lausanne, and Charly’s visit to Warwick was sponsored by the Zeno Karl Schindler Foundation. This Matlab program was subsequently refined by Dr Jones. Time and expenses for this long-term project have variously been covered by Mott MacDonald, the University of Southampton, the University of Warwick and Inbye Engineering Limited.
