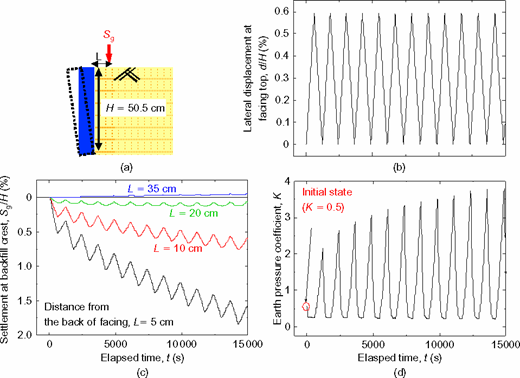
The authors have reported an extensive 1g small-scale model test program on integral abutments backfilled with unreinforced and reinforced Toyoura sand. The peak value of earth pressure was observed to increase significantly with cyclic loading in all cases (Figure 11 in their paper). The authors attribute this observation to a dual ratchet mechanism (Figure 15 in their paper). They also suggest that build-up of stresses is associated with volumetric settlement, e.g. densification of soil, at least for the active wedge in Figure 15.
To investigate the intrinsic behavior of soil behind integral abutments we have carried out laboratory stress path testing at the University of Southampton to study the development of earth pressure in granular materials behind frame integral abutments (Xu et al. 2007a), and in natural stiff clay behind embedded integral abutments (Xu et al. 2007b). Soil element tests were performed utilizing an automated triaxial cyclic loading system, which was developed based on a Bishop & Wesley apparatus. The axial and radial strains were measured locally at the specimen mid-height using submersible LVDTs. The specimens were 100 mm in diameter and approximately 200 mm high (Xu 2005). The specimens were subjected to the stress paths and levels of cyclic straining that a typical embedded integral abutment might impose on its retained soil, e.g. a constant vertical stress and a constant cyclic horizontal strain of 0.05%, 0.1% and 0.2%.
Leighton Buzzard sand, which is a light brown sub-rounded, uniform, natural, uncrushed silica sand, was used for part of the investigation. Glass ballotini were also studied in separate tests to investigate the influence of granular particle shape. The stiff clay used in the testing was undisturbed Atherfield clay, which is a Lower Cretaceous heavily overconsolidated clay with a very dense and anisotropic arrangement of platy particles.
Leighton Buzzard sand specimens were pluviated with different densities, varying from loose (Dr = 18%) to very dense (Dr = 92%). During each radial extension excursion, the earth pressure coefficient K decreased sharply, and the specimen quickly approached the active conditions. During each radial compression excursion, K increased to its maximum value. The maximum earth pressure coefficient Kmax in each cycle was found to continue to build up without stabilizing under all cyclic strain ranges, eventually reaching or approaching the passive stress state. In contrast, the glass ballotini and the stiff clay exhibited a resilient behavior after the first cycle, with no obvious accumulation of maximum horizontal stress observed with cycling. Our results also demonstrated that the build-up of the maximum horizontal stress in the Leighton Buzzard sand specimens was not necessarily associated with densification: although the loose and dense specimens experienced volumetric contraction during cycling, the very dense specimen was found to dilate during cycling, even as the maximum K value increased.
The underlying mechanism of the stress build-up in the Leighton Buzzard sand specimens was explored, and appeared to result from increased grain interlocking, achieved progressively as non-spherical sand particles rotated when close to or at the active state in each cycle (Skinner 1969). Particle shape (Clayton et al. 2009) was shown to have an important effect on the behavior of granular materials under this type of cycling.
We would therefore ask the authors to present a more detailed description of the Toyoura sand that they used in their experiments, e.g. origin, mineralogy, particle size distribution, and particularly particle shape, preferably with the assistance of photographic evidence of the form, angularity and roughness of the sand particles. In addition, justification needs to be given for the conclusions that they have drawn from their 1g small-scale model test, since such tests do not replicate the actual stress levels in the field, which could be expected to affect soil behavior significantly.
Response by F. Tatsuoka1, D. Hirakawa2, M. Nojiri3, H. Aizawa4, H. Nishikiori5, R. Soma6, M. Tateyama7 and K. Watanabe8
1Professor, Department of Civil Engineering, Tokyo University of Science, 2641 Yamazaki, Noda, Chiba, 278-8510, Japan, Telephone: +81 4 7122 9819, Telefax: +81 4 7123 9766, E-mail: tatsuoka@rs.noda.tus.ac.jp
2Assistant Professor, National Defense Academy of Japan, 1-10-20, Hashirimizu, Yokosuka City, Kanagawa Prefecture, 239-8686, Japan, Telephone: +81 46 841 3810 (ext. 3513), Telefax: +81 46 844 5913, E-mail: hirakawa@nda.ac.jp
3Engineer, Kawasaki Geological Engineering Co. Ltd, Kyushu Branch, Technical Division, Geotechnical Engineering Group, 1-40, Gion Machi, Hakata-Ku, Fukuoka City, Fukuoka Prefecture, 812-0038, Japan, Telephone: +81 92 271 9201, Telefax: +81 92 271 9209, E-mail: nojirim@kge.co.jp
4Engineer, Japan Railway Construction, Transport and Technology Agency, Construction Bureau for Hokuriku Shinkansen, 94, Sakuragi, Itoigawa City, Niigata Prefecture, 949-1354, Japan, Telephone: +81 26 223 9643, Telefax: +81 26 223 9681, E-mail: h.aizawa@jrtt.go.jp
5Engineer, Ibaraki Prefecture, Department of Civil Engineering, Port and Harbor Section, 978-6, Kasahara ChoMito City, Ibaraki Prefecture, 310-0852, Japan, Telephone: +81 29 301 4530, E-mail: nickey_1012@yahoo.co.jp
6Graduate student, Department of Civil Engineering, Tokyo University of Science, 2641 Yamazaki, Noda-shi, Chiba-ken, Tokyo, 278-8510, Japan
7Chief, Structure Engineering Division, Railway Technical Research Institute, Japan, 2-8-38, Hikari-Cho, Kokobunji City, Tokyo, 185-8540, Japan, Telephone: +81 42 573 7260, Telefax: +81 42 573 7369, E-mail: tate@rtri.or.jp
8Engineer, Structure Engineering Division, Railway Technical Research Institute, Japan, 2-8-38, Hikari-Cho, Kokobunji City, Tokyo, 185-8540, Japan, Telephone: +81 42 573 7261, Telefax: +81 42 573 7248, E-mail: nabeken@rtri.or.jp
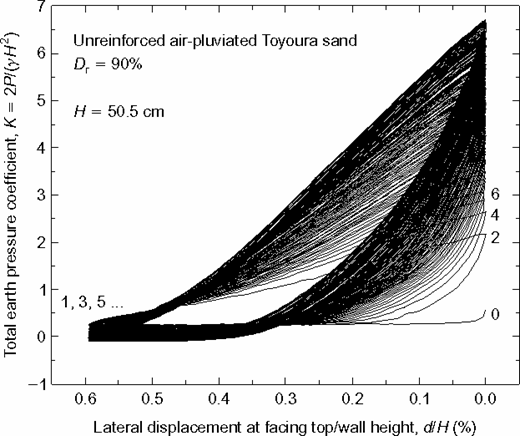
The authors would like to thank the discussers for their comments on and interest in our paper The authors would also like to appreciate the relevant comments of the discussers on the draft of this closure. When the abutment of an integral bridge is cyclically displaced in the lateral direction by seasonal thermal deformation of a continuous girder, although the lateral displacement amplitude is usually very small (much less than 1% of the abutment height), eventually (1) an active failure may take place in the unreinforced backfill, and (2) the earth pressure at the passive state may increase toward the passive earth pressure. Figure 9 presents a test result typically showing the above. As explained in the paper, the authors consider that both phenomena are due mainly to a specific interaction between the backfill and the abutment, called the dual ratchet mechanism, while an increase in the earth pressure is due also to an intrinsic stress–strain property of soil, called the cyclic strain-hardening effect, which is seemingly the same phenomenon as the ‘grain interlocking' addressed by the discussers. Although the discussion addresses only an increase in the earth pressure by cyclic loading (i.e. phenomenon (2)), the following three major points addressed in the discussion are all very important, and essential to understanding why and how both phenomena, (1) and (2), take place by a fixed small amplitude of cyclic loading:
• physical model tests or element tests, or both;
• effects of particle shape; and
• 1g and centrifuge model tests.
The authors respond below to these three discussion points. The increase in the active earth pressure due to post-peak strain-softening during cyclic loading, discussed in the paper, is not addressed in this closure.
PHYSICAL MODEL TESTS OR ELEMENT TESTS, OR BOTH
The first discussion point is whether the two phenomena, (1) and (2), are better simulated or understood either by physical model tests or by element tests (i.e. laboratory stress–strain tests), or by both. Like some other researchers (e.g. Ng et al. 1998; England et al. 2000), the authors performed a series of physical model tests to simulate and understand these two phenomena, and in particular to evaluate the interaction between the backfill and the abutment taking place associated with the development of highly non-uniform strain fields in the backfill with the strain changing with distance at a rate that changes continuously, or discontinuously (where a shear band or shear bands develop(s)). Moreover, the earth pressure problem in the field is often studied by assuming plane-strain conditions. The authors naturally performed physical model tests under plane-strain conditions, although they are small-scale and in 1g (under gravitational acceleration). In addition, the authors consider that the restraining effects of reinforcement on the development of an active failure plane (i.e. one of the main topics of the paper) can be properly evaluated by physical model tests. The authors also consider that the element test is relevant to evaluate the stress–strain behavior of soil elements under the cyclic loading conditions encountered in the backfill behind the abutment.
The authors consider that these two approaches correspond to the two classical earth pressure theories of Coulomb and Rankine. The Coulomb theory is relevant to explain the backfill behavior after the formation of an active failure plane (or a shear band), which easily develops at small active displacements of the wall (i.e. the abutment in the present case). The Coulomb theory assumes that the backfill deformation takes place only in shear bands (or only along failure planes). In the paper, the major mechanism causing the two phenomena, (1) and (2), observed in a single test is discussed as the ‘dual ratchet mechanism'. This mechanism can be explained in the framework of the Coulomb theory, as shown later in this closure. Yet the Coulomb theory assumes that the soil outside shear bands is rigid. This assumption is not realistic, particularly under passive conditions, where a large strain is necessary before the passive earth pressure state is reached.
On the other hand, the Rankine theory does not assume the development of any distinct shear band, but it does assume that the backfill behind the wall (i.e. the abutment in the present case) is all at the peak stress state (i.e. at failure), where an infinite number of failure planes have developed. If the deformation of the backfill is uniform, without any distinct shear bands, an increase in the earth pressure by cyclic loading can be evaluated solely by relevant element tests based on the Rankine theory. To realize this situation, however, the boundary between the bottom of the backfill and the supporting ground should be frictionless, which is not realistic in the usual field cases. The authors consider that the second important factor for an increase in the earth pressure at the passive state in the backfill during cyclic lateral loading is the ‘cyclic strain-hardening effect': that is, the peak-to-peak secant modulus of the hysteresis stress–strain loop for a fixed strain amplitude increases with cyclic loading. England and Dunstan (1994) also evaluated this intrinsic stress–strain property of sand to understand the mechanism of the build-up of the earth pressure by cyclic loading. The discussers (Clayton et al. 2006; Xu et al. 2007a) also performed stress path tests using a triaxial apparatus on a solid cylindrical specimen. The discussers call the ‘cyclic strain-hardening effect' the ‘grain-interlocking mechanism'.
In the following, analyses of the two phenomena by the two approaches are presented in more detail than in the paper.
Dual ratchet mechanism in physical model tests
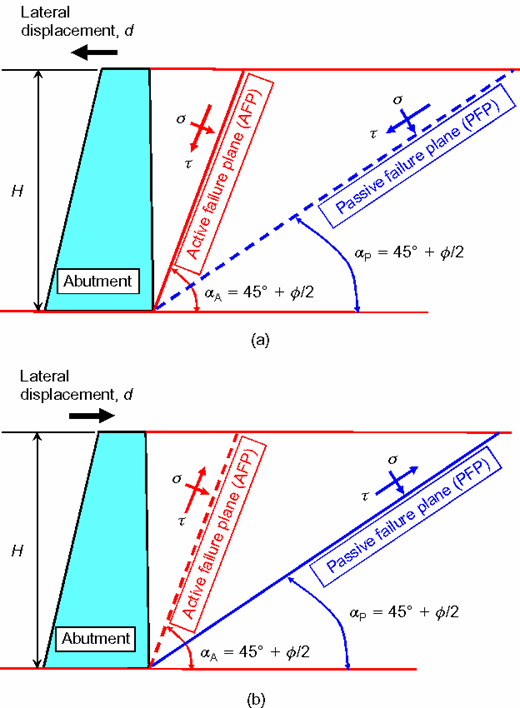
Although Coulomb did not analyze the passive pressure state (Golder 1948), following tradition in geotechnical engineering, both active and passive pressure states are analyzed in the same framework of the Coulomb theory. For the simplest wall configuration (Figure 45), it is assumed that the active failure plane (AFP) and the passive failure plane (PFP) (i.e. shear bands) have already developed in the backfill, while the other part of the backfill is kept rigid. This assumption means that the wall is translating without rotation. In actuality, the deformation inside the active and passive wedges cannot be ignored, particularly because the abutment rotates cyclically about its bottom edge. It is also assumed that the back face of the wall is frictionless, and that the crest of the backfill is level. Furthermore, the cyclic strain-hardening mechanism (explained later) could be important, and the anisotropy in the strength and deformation characteristics is significant for air-pluviated Toyoura sand in the small-scale 1g tests described in the paper (Tatsuoka et al. 1986; Tatsuoka 1987; Yasin et al. 1999). The analysis presented below does not take these factors into account: therefore the analysis is an approximate one.
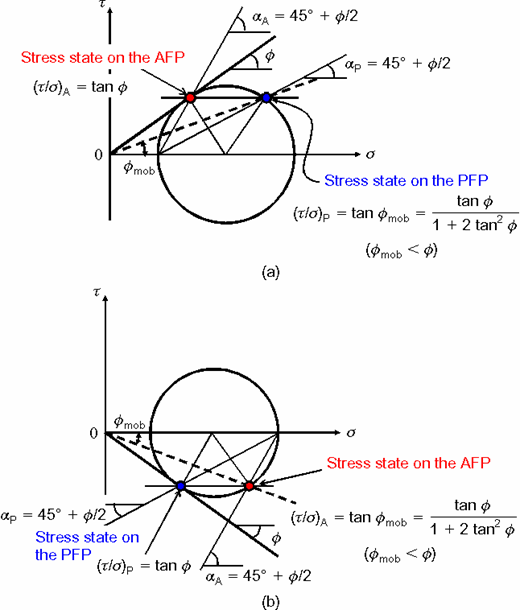
First, the stress states on the AFP and PFP when the backfill is at either an active or a passive earth pressure state (i.e. the failure state) are obtained. Suppose that the abutment has displaced in the active direction, and the active earth pressure has developed (Figure 45a). By applying the Mohr–Coulomb failure criterion with zero cohesion intercept for sand to the stress states on these failure planes (AFP and PFP), we obtain, for the stress ratio on the PFP (Figure 46a),
This stress ratio is significantly lower than the peak stress ratio (τ/σ)A = tan φ mobilized on the AFP.
Then, suppose that the abutment has displaced in the passive direction, and the passive earth pressure has developed (Figure 45b). Compared with the peak stress ratio (τ/σ)P = tan φ mobilized on PFP, the stress ratio on the AFP is significantly lower (Figure 46b):
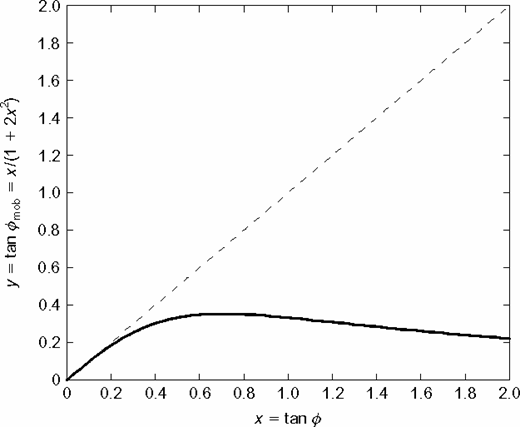
Figure 47 shows the relationship between tan φmob and tan φ according to Equations 1 and 2. For a wide range of tan φ the value of tan φmob is fairly constant, at around 0.35. It is seen from the above that the stress state cannot become the peak state simultaneously on both the AFP and PFP in either the active or the passive earth pressure state.
It can readily be seen that the following equations, similar to Equations 1 and 2, are valid when the mobilized stress ratio is below the peak value on the AFP in the active state or the PFP in the passive state.
Figure 47 also show the relationship between tan (φmob)A and tan (φmob)P according to Equations 3 and 4. Such differences in the stress ratio between the AFP and PFP, as shown above, constitute the essence of the dual ratchet mechanism, explained below.
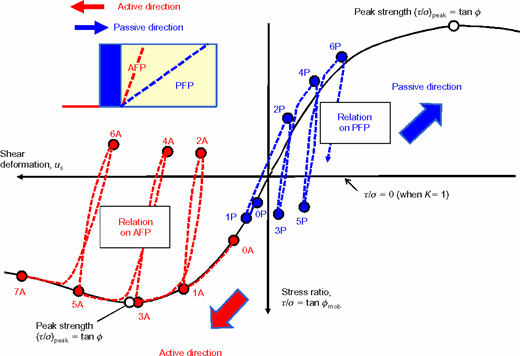
Second, the relationships between the stress ratio and the shear deformation on the AFP and PFP in a physical model test such as those shown in Figure 9 are inferred based on the analysis shown above. Figure 48 shows the relationship between the total earth pressure coefficient, K, and the ratio of the lateral displacement at the top of the facing (i.e. the abutment), δ, to the facing height, H, from a model test presented in Figure 9. Figure 49 shows schematically the inferred relationships between the stress ratio and the shear deformation on the AFP and PFP in this model test. The stress–strain curves for continuous monotonic loading (ML) on the PFP and AFP are approximated as a rough bound for those during cycling loading by ignoring the cyclic strain-hardening effects (described later). It is also assumed that, for the same lateral displacement of the abutment top, the shear deformation on the AFP when the abutment is displaced in the active direction is much greater than the shear deformation on the PFP when the abutment is displaced in the passive direction. This is because, in reality, the active and passive wedges are not rigid, and the deformation of the passive wedge when the abutment is displaced in the passive direction is much greater than that of the active wedge when the abutment is displaced in the active direction by the same amount. The shear stress τ is defined as positive when activated in the counter-clockwise direction on the AFP and PFP illustrated in Figure 45. Then τ is positive when the abutment is displaced in the active direction. In Figure 49 the positive direction of τ is taken as downwards and that of the shear deformation us is taken as leftwards. The relations between stress ratio (τ/σ) and shear deformation (us) on the AFP and PFP, depicted in Figure 49, are explained step by step below. The numbers 0, 1, 2 etc. correspond to those indicated in Figure 48.
• Initial stage 0: It is assumed that the initial stage is at rest under the K0 condition, which is closer to the active earth pressure state than to the passive earth pressure state. The stress ratio τ/σ on the AFP at this stage, denoted as 0A, is much higher than that on the PFP at 0P.
• First active loading towards stage 1: The stress/strain state on the AFP reaches 1A, where τ/σ is quite high, while the state on the PFP reaches 1P, where τ/σ is much lower (see Figure 47). Although both the AFP and the PFP exhibit large-scale yielding following the respective primary τ/σ–us relations, the yielding is much more significant on the AFP than on the PFP. The width at the same level of the active wedge may increase as it settles down, associated with active shear displacements along AFP (as illustrated in Figure 15c of the paper). This geometric change is compensated for by passive shear displacements along the PFP at the next stage (as illustrated in Figure 15d of the paper).
• First passive loading towards stage 2: The state on the PFP moves from 1P towards 2P, exhibiting significant yielding in nearly the same way as the primary passive loading, associated with a large decrease in τ/σ from +(tan φmob)P by Equation 3 towards −(tan φmob)P in Equation 4. On the other hand, the state on AFP moves from 1A towards 2A, essentially exhibiting unloading with no significant yielding. The absolute value of τ/σ on the AFP at 2A is significantly lower than that on the PFP at 2P.
• Second active loading towards stage 3: The state on the AFP first moves from 2A to 1A, exhibiting first reloading with no significant yielding, with a large increase in τ/σ from −(tan φmob)A by Equation 4 to +(tan φmob)A in Equation 3 and then towards 3A, exhibiting significant yielding while rejoining the primary τ/σ–us relation. In Figure 49 it is assumed that τ/σ at 3A is close to the peak value. On the other hand, the state on the PFP moves from 2P towards 3P, essentially exhibiting unloading. The value of τ/σ on the PFP at 3P is significantly lower than that on the AFP at 3A.
• Second passive loading towards stage 4: The state on the PFP moves from 3P towards 4P, while τ/σ increases largely by first reloading with no significant yielding, and then by significant yielding while rejoining a τ/σ–us relation similar to the primary relation. On the other hand, the state on the AFP moves from 3A towards 4A, essentially exhibiting unloading. The absolute value of τ/σ on the AFP at 4A is significantly lower than that on the PFP at 4P.
The process described above is repeated as long as cyclic displacement of the abutment continues.
The ratchet mechanism is defined as the process in which the yielding behavior takes place in only one direction during two-way cyclic loading. As seen from the above, the dual ratchet mechanism (i.e. two independent ratchet mechanisms in opposite directions) results from the following factors.
1. The stress ratio/shear deformation states on AFP and PFP move along completely separate paths.
2. The whole τ/σ–us relation on AFP is located mainly in the regime where the shear stress τ and the shear displacement us are both positive. This trend of behavior occurs because large-scale yielding in the active direction takes place only when and whenever the abutment is displaced in the active direction in the course of cyclic loading. This mechanism explains why active yielding develops in each cycle, and why eventually active failure develops, even though the lateral displacement of the abutment in each cycle is kept to a small fixed value.
3. Similarly, the whole τ/σ–us relation on the PFP is located in the regime where τ and us are negative (except for the very first part). This trend occurs because large-scale yielding in the passive direction takes place only when and whenever the abutment is displaced in the passive direction. This mechanism explains why passive yielding develops in each cycle, and eventually large passive pressure develops, despite a fixed small lateral displacement of the abutment in each cycle.
4. In the τ/σ–us relations on the AFP and PFP depicted in Figure 49, in every cycle a similar amount of yielding takes place, which is accumulated in the course of cyclic loading, without showing a sign of the cease of yielding. This explains the trend seen in the test results presented in Figures 9 and 48, as well as other similar figures presented in the paper.
The dual ratchet mechanism described above does not occur if the backfill is an elastic material always exhibiting the same reversible stress–strain behaviors on the AFP and PFP. Furthermore, even when the backfill is an elasto-plastic or elasto-viscoplastic material, if analysis is made based on the average stresses, such as the major and minor principal stresses, in the backfill, which are common with the AFP and PFP, the dual ratchet mechanism cannot be explained.
The authors do not suggest in the paper that the build-up of earth pressure during cyclic lateral displacements of the wall (i.e. the abutment) is associated with densification of the backfill. That is, the volume of the backfill when the lateral earth pressure is equal to the initial value may decrease with cyclic loading as a result of cyclic straining effects. However, this intrinsic soil property is not the cause of an increase in the earth pressure with cyclic loading when the facing displaces in the passive direction.
Cyclic strain-hardening effect in soil element tests
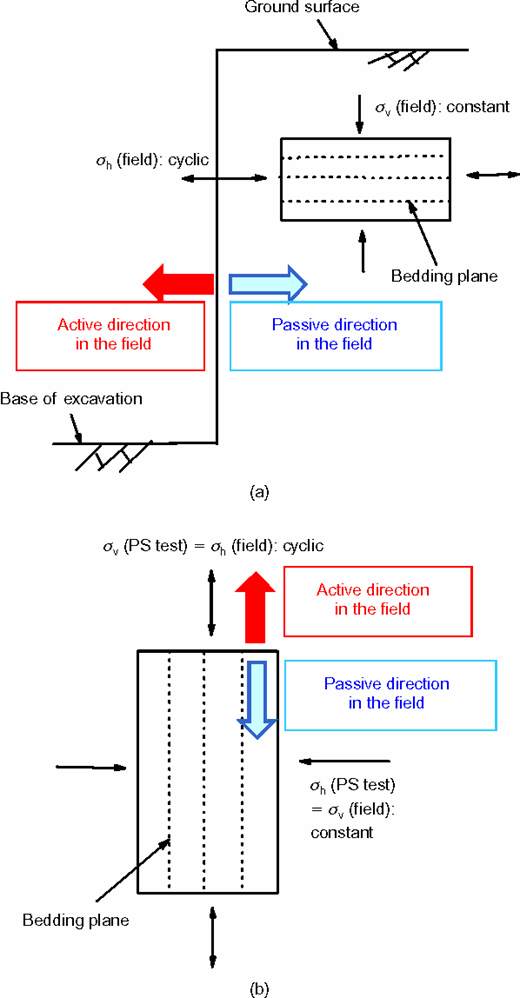
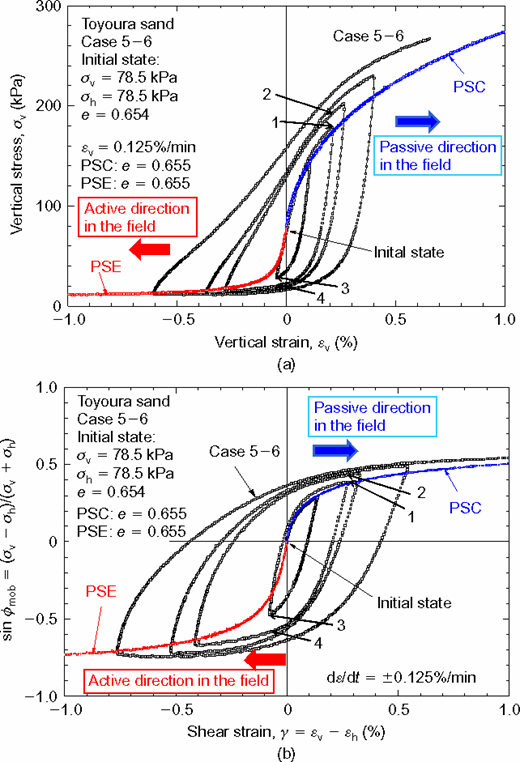
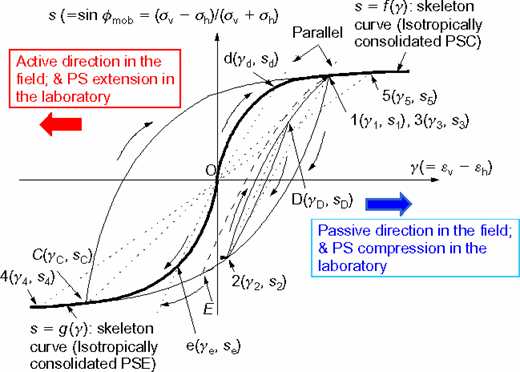
Clayton et al. (2006) and Xu et al. (2007a) evaluated the grain-interlocking mechanism (i.e. the cyclic strain-hardening effect) by performing stress-path test utilizing an automated triaxial cyclic loading system in which the specimens were subjected to a constant vertical stress and a constant amplitude of cyclic horizontal strain. The authors also examined this mechanism by performing cyclic plane-strain (PS) tests on specimens of Toyoura sand (Figure 50b). The specimens were produced by air pluviation and then rotated by an angle of 90° so that the vertical stress and strain in the PS specimens became the horizontal stress and strain in a soil element behind a wall subjected to cyclic lateral displacements (Figure 50a). By so doing, a ‘delicate history of small lateral strain in the field' was accurately controlled by means of a precise gear loading system (Tatsuoka et al. 1994b; Santucci de Magistris et al. 1999) and measured by means of a local gauge called the local deformation transducer (Goto et al. 1991). Figure 51a compares the stress–strain relation from a typical cyclic PS test in which the strain amplitude was increased in the course of cyclic loading with those from two continuous ML tests: a PS compression test (i.e. loaded in the field passive direction) and a PS extension test (i.e. loaded in the field active direction). The data shown in Figure 51a are re-plotted in Figure 51b. By comparing the stress value at the maximum vertical strain in a certain cycle with that at the same vertical strain in the next cycle (e.g. comparisons between points 1 and 2, and between points 3 and 4), it may be seen that the stress value at the same maximum strain increases by cyclic loading, while becoming noticeably larger than the value at the same strain during continuous ML. This result indicates that the vertical stress at the same maximum vertical strain (i.e. the horizontal stress at the same maximum horizontal strain in the field) increases with cyclic loading, even when the amplitude of cyclic vertical strain (i.e. the amplitude of cyclic horizontal strain in the field) is kept constant. This trend of behavior was also observed in cyclic triaxial tests on sand with a fixed axial strain amplitude (Tatsuoka and Ishihara 1974). The authors called this phenomenon the ‘cyclic strain-hardening effect', which may imply the same phenomenon as the grain-interlocking mechanism.
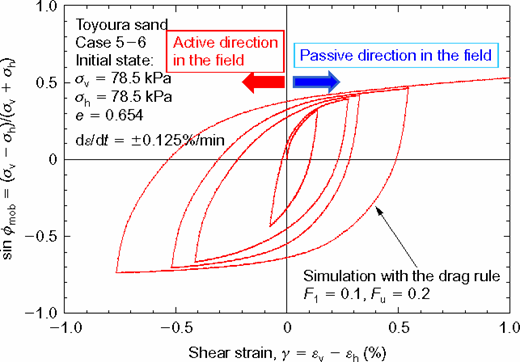
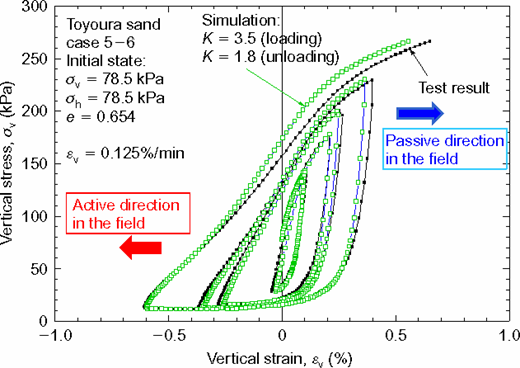
As a result of the effects of inherent anisotropy, the air-pluviated Toyoura sand is noticeably softer and weaker in the ML PSC test than in the ML PSE test in Figure 51b. Despite this, the overall stress ratio and shear strain relations are essentially symmetrical about the origin, unlike the one presented in Figure 51a. Hysteretic stress–strain relations such as these are often modeled by the proportional rule that does not incorporate the cyclic strain-hardening effect (Figure 52). In this modeling, the stress at the same maximum strain does not increase with cyclic loading: therefore this modeling cannot simulate the cyclic strain-hardening effect (i.e. the grain-interlocking mechanism). Tatsuoka et al. (2003) introduced the ‘drag rule' into the conventional proportional rule so that the stress amplitude for the same strain amplitude expands with cyclic loading. Figure 53 shows the simulation of the test result presented in Figure 51b by the modified modeling. Figure 54 compares the simulation converted from that presented in Figure 53 with the test result presented in Figure 51a. Good agreement may be seen between the measured and simulated relations. Yet it is true that such a cyclic strain-hardening effect, as seen from Figure 54, is not sufficient to explain ‘a fast development of active failure and a fast increase in the passive pressure with cyclic loading' observed in the physical model tests (as described in Figure 9).
In summary, the authors consider that both approaches (physical model tests and element tests) are necessary to fully understand the two phenomena (i.e. active failure and the development of high earth pressure approaching the passive earth pressure in the unreinforced backfill behind an abutment subjected to cyclic lateral displacements).
EFFECT OF PARTICLE SHAPE
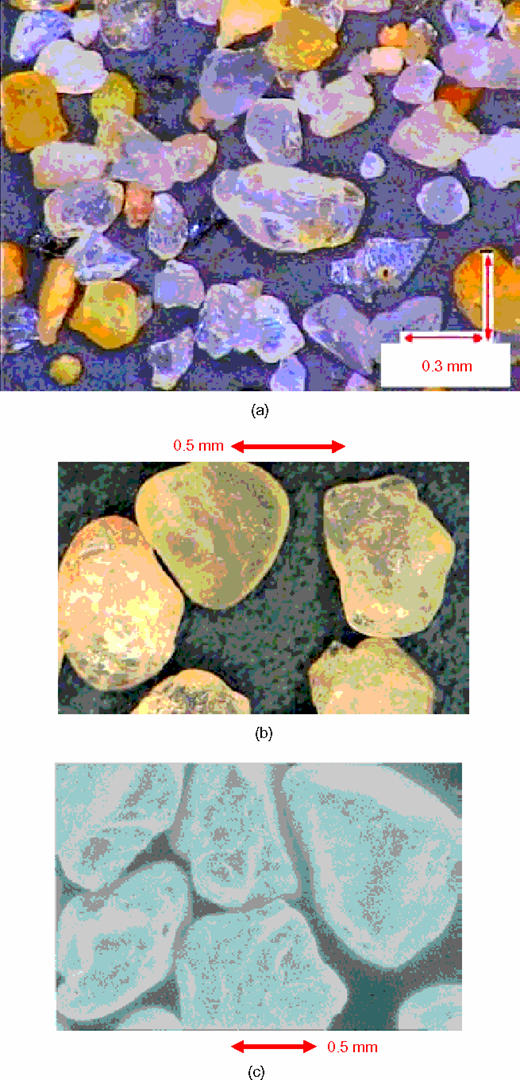
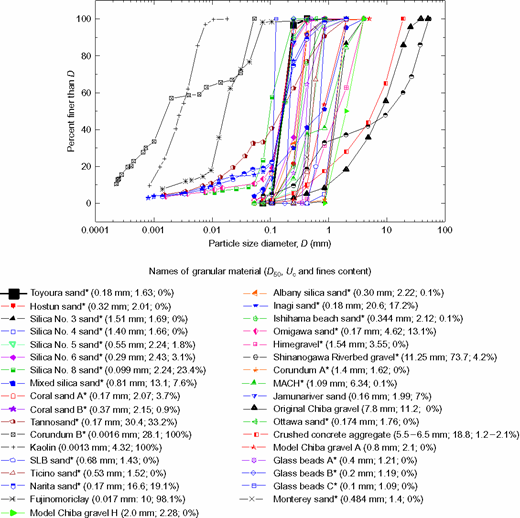
Toyoura sand, which is used in the physical model tests described in the paper, is a quartz-rich sand originating from weathered granite at Toyoura, Yamaguchi Prefecture, Japan. The particles are angular to sub-angular in shape (Figure 55a and Table 2) and almost uniformly graded between 106 and 355 μm (Figure 56), with D50 = 0.18 mm, Uc = 1.64, Gs = 2.65, emax = 0.99 and emin = 0.62. More detailed analysis of the particle shapes of Toyoura sand and other sands (including Silver Leighton Buzzard sand, explained below) are given by Yoshida et al. (1995) and Yoshida and Tatsuoka (1997).
For more than 20 years Toyoura sand has been extensively used in element and physical model tests by the authors (e.g. Tatsuoka et al. 1986, 1989, 2008; Tatsuoka 1987, 2001). In addition, the stress–strain properties of Toyoura sand were compared with those of other types of granular material, particularly of Silver Leighton Buzzard (SLB) sand (D50 = 681 μm, Uc = 1.43, Gs = 2.66, emax = 0.79 and emin = 0.49; Yasin et al. 1999).
In the stress path triaxial tests, the discussers used Leighton Buzzard sand (fraction B according to the discussers). The particles are much larger (about D50 = 1 mm) and more rounded (Figure 55c) than SLB sand. According to the discussers, the scalene ellipsoid equivalent sphericity, SEES (ratio of minor to major particle dimensions, calculated by Clayton et al. 2009) is about 0.55. Although the particles of SLB sand are slightly smaller than those of the LB sand (fraction B) used by the discussers, both are similarly rather round (Figures 55b and 55c). Clayton et al. (2006) and Xu et al. (2007a) evaluated the effect of particle shape in stress path tests and found that, by cyclic loading with a fixed amplitude of lateral strain, the peak lateral stress in the respective cycles increases considerably, approaching the passive earth pressure for LB sand (fraction B), where this is not the case for a spherical uniformly graded granular material, glass ballotini. Although LB sand (fraction B) and SLB sand are not spherical, they are much more round than Toyoura sand (Figure 55 and Table 2). Furthermore, much less uniformly graded sands, as shown in Figure 56, are usually used to construct the backfill behind bridge abutments. It is interesting to examine whether, in stress path tests, the increase in the confining pressure becomes more significant as a result of better grain-interlocking with sands that are more angular and/or less uniformly graded, or both, than LB sand (fraction B). The authors did not examine the effects of particle shape and grading characteristics on the backfill behavior in physical model tests such as those described in the paper. It would also be interesting to examine the issue of the development of earth pressure in the passive state, as well as the issue of active failure, by performing physical model tests using LB sand (fraction B) and glass ballotini, as well as other less uniformly graded sands, under the same test conditions.
1g AND CENTRIFUGE MODEL TESTS
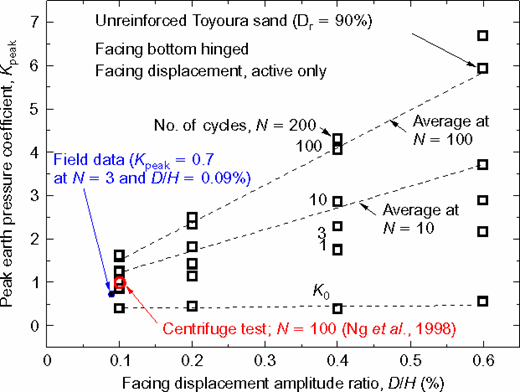
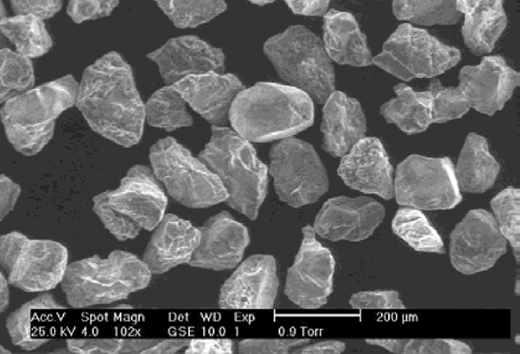
Whether such small-scale 1g tests as those performed by the authors are relevant and useful to understand and predict the behavior of the backfill behind an abutment of a full-scale integral bridge, when compared with centrifuge tests, has also been one of the serious concerns of the authors. Figure 57 shows the relationship between the peak earth pressure coefficient, Kpeak, in the respective cycles at different numbers of loading cycles, N, and the double-amplitude lateral displacement at the top of the facing, including the data presented in Figures 9 and 48. It may be seen that the result from the small-scale 1g model tests is not significantly different from the full-scale field behavior for three years (i.e. N = 3; Hirakawa et al. 2006, 2007). Perhaps because of significant difficulties in controlling small movements of a small model abutment accurately in a centrifuge test, only the work by Ng et al. (1998) could be found in the literature. The result from their centrifuge test using another type of Leighton Buzzard sand placed in a small sand box and loaded at 60g is plotted in Figure 57. It may be seen that the K value at N = 100 from the centrifuge test is noticeably lower than the corresponding value from the 1g model tests using Toyoura sand. The Leighton Buzzard sand used in the centrifuge tests is fraction E, according to the discussers. The particle size is 90–150 μm, similar to that of Toyoura sand, and the particles are angular to sub-angular in shape, as can be seen from Figure 58. Yet it seems that LB sand (fraction E) is less angular than Toyoura sand.
It is not known whether this difference between the results from the small-scale 1g tests and those from the centrifuge test is due to less significant grain interlocking with a less angular sand (i.e. LB sand, fraction E) than with a more angular sand (i.e. Toyoura sand), or to other different test conditions in terms of pressure level and other variables between the two types of model test. The comparison among 1g model tests, a centrifuge model test and field full-scale behavior presented in Figure 57 is not sufficient to reach any distinct conclusions in this respect.
Admittedly, it is difficult to predict field behavior quantitatively in an accurate manner only by such small-scale 1g tests as performed by the authors. Yet the authors believe that we can learn the basic mechanism and fundamental features of the behavior of the backfill from such small-scale 1g tests. Moreover, small-scale 1g model tests are useful to validate numerical analysis methods (including the FEM) (e.g. Siddiquee et al. 1999, 2001).
A shear band has a thickness of the order of 10–20 times the mean diameter, D50, which is fairly independent of pressure level (Yoshida et al. 1995; Yoshida and Tatsuoka 1997; Oie et al. 2003; Okuyama et al. 2003), and is independent of model size. Therefore any small-scale model test in which the development of shear bands has significant effects on the behavior of the backfill (whether in small-scale 1g tests, as described in the paper, or in centrifuge tests) cannot be free from particle size effects (e.g. Tatsuoka et al. 1989, 1994a; Tatsuoka 2001). That is, reproduction of the field pressure level in small-scale physical model tests may not be sufficient. Siddiquee et al. (1999, 2001) showed that the results from 1g and centrifuge model tests in which shear banding has important effects can be well simulated by numerical analysis only when the effects of the relevant factors on soil stress–strain property are accurately taken into account in the numerical analysis. These factors include:
• highly non-linear pre-peak stress–strain behavior;
• hypo-elastic property;
• non-associated flow characteristics; and
• particle-size effects on the post-peak stress–strain behavior associated with strain localization into shear bands.
In summary, the three discussions points addressed by the discussers are all relevant to a full (or at least a much better) understanding of the two very interesting and important phenomena taking place in backfill subjected to a fixed small amplitude of cyclic lateral displacement of the abutment (i.e. significant active failure and a significant increase in the earth pressure at the passive state). The response of the authors to these three discussion points can be summarized as follows.
1. Both of the following two research methodologies, which comprise different experimental methods, different concepts for the basic mechanism, and different theoretical frameworks, are necessary and useful:#b(a) physical model tests, by which the dual ratchet mechanism can be evaluated as the major factor of the interaction between the abutment and the backfill, which could be interpreted by the framework of the Coulomb earth pressure theory; and#b(b) element stress–strain tests, by which the grain-interlocking mechanism (or the cyclic strain-hardening effect) can be evaluated as the major related intrinsic stress–strain property of the backfill, from which the build-up of earth pressure with cyclic loading can be evaluated, based on the Rankine earth pressure theory.
2. To obtain any distinct conclusion with respect to the effects of particle shape on the grain-interlocking mechanism (i.e. the cyclic strain-hardening effect), as well as the dual ratchet mechanism, it is necessary and useful to perform not only element tests but also physical model tests using granular materials with a wider range of particle shape and grading than those used in previous studies.
3. To compare and evaluate the usefulness and limitations (i.e. advantages and disadvantages) of small-scale 1g and centrifuge model tests, it is necessary and useful to perform both types of physical model test under otherwise similar conditions. A relevant comparison of results from these model tests with full-scale field behavior is also essential. In analytical comparison among the results from 1g and centrifuge tests and field behavior, it is necessary to take into account not only the pressure level effect but also the particle size effect, among other important influencing factors.