


The design engineers’ responsibility is not limited to finding a safe solution but includes considering the environmental impact of the suggested design. In many cases a soil improvement becomes necessary when constructing an embankment on soft subsoil conditions. One of the alternative soil improvement methods is installing stone columns. A more recent alternative is installing Geosynthetic Encased Columns (GEC). In this study a comparison was made on the environmental impact both methods will create. As the measure of the environmental impact, the equivalent carbon dioxide (CO2eq.) emissions was taken. For this purpose, a soft subsoil condition was considered with three different levels of weakness and three different embankment heights. In the comparison, transportation distances of geosynthetic products and granular column materials have been estimated. Since GECs can use any granular material as fill, only one hauling distance was estimated. Stone columns necessitate a more specific granular fill; hence four different hauling distances were taken into consideration. It was determined that the GEC alternative produces a much smaller CO2 footprint than the stone column alternative. Furthermore, it was seen that the advantage of GEC solution becomes more efficient in terms of reducing the CO2 emission with increasing embankment height.
NOTATION
- Basic SI units are shown in parentheses
- A
area ratio (=As/AE) (unitless)
- A
improved area
- AC
column area
- AE
influence area of a column
undrained shear strength (kN/m²)
- c′
effective cohesion (kN/m²)
- Eoed.p_ref
constrained modulus (kN/m²)
- K
earth pressure coefficient (unitless)
- pref
reference pressure (kN/m²)
- γ
unit weight (kN/m³)
- γ′
effective unit weight (kN/m³)
- v
poissons ratio (unitless)
- ϕ′
effective friction angle (degree)
Abbreviations
- DIN
deutsches institut für normung
- EBGEO
recommendations for design and analysis of earth structures using geosynthetic reinforcement
- EC
eurocode
- EPD
environmental product declaration
- GEC
geosynthetic encased columns
- GESC
geosynthetic encased stone columns
- GHG
greenhouse gases
- ISO
international organization for standardization
- LCA
life cycle assessment
- OSC
ordinary stone columns
- SLS
serviceability limit state
1. INTRODUCTION
Granular columns, whether made of stone or sand, are widely employed in the construction of highway and railway embankments over soft clays or peaty soils due to their effectiveness in enhancing the foundation's properties (Bayati and Bagheripour 2019; Das and Deb 2019; Gu et al. 2022; McKenna et al. 1975; Munfakh et al. 1984; Zhou and Kong 2019). These columns serve to increase the bearing capacity, reduce settlement, accelerate the consolidation process and improve the overall stability of embankments. Installation of granular columns in extremely soft clay with an undrained shear strength of less than 15 kPa can lead to issues related to bulging and shear failures due to inadequate lateral confinement (Alamgir et al. 1996; McKenna et al. 1975). To address the issues related to excessive bulging and shear failures under static loading, various methods, such as application of cement grout (Ranjan 1989) and installation of horizontal layers of geogrid (Hasan and Samadhiya 2018), have been proposed. However, one of the most effective techniques involves encasing or wrapping granular columns with geosynthetic material, to create geosynthetic encased columns (GECs) (Raithel and Kempfert 2000). The geosynthetic encasement provides additional lateral confinement necessary for enhancing the efficiency of granular columns (Cengiz and Güler 2021; Murugesan and Rajagopal 2007).
Furthermore, GECs can be used to reduce the horizontal earth pressure on structures due to earth fill. The typical cases for such applications are piled piers and bridge abutments, among others. Schnaid et al. (2017) reported results based on a case study where GECs successfully reduced the magnitude of horizontal earth pressure on a piled bridge abutment constructed on soft soil. They reported results based on analytical and numerical analyses which were calibrated through an extensive monitoring program. The results demonstrated that the horizontal earth pressure acting on piles was reduced to approximately half of what had been expected for an untreated clay layer.
Stone columns and geosynthetic encased columns are two frequently implemented types of ground improvement techniques to achieve higher bearing capacity and less settlement upon construction on weak or compressible soils. Both techniques are widely used in various geotechnical engineering applications, including foundation design of flexible structures, highway construction, and embankment stabilization. Despite the similarities between the overall performance of stone columns and GECs, there are various conditions where the application of stone columns is either not preferred or technically infeasible (e.g. very soft subsoils).
Despite the similarities between the overall performance of stone columns and GECs, several studies have shown that geosynthetic encased columns can provide higher load-bearing capacity and lower settlement than stone columns. For example, Yoo and Abbas (2019) conducted a laboratory study comparing the performance of stone columns and geosynthetic encased columns and found that the latter provided lower settlement especially under cyclic loading conditions. Numerous scholars have investigated the bearing properties of GECs, or Geosynthetic Encased Stone Columns (GESC), focusing on the bearing capacity and deformation of individual piles (Grizi et al. 2022; Gu et al. 2016; Liu et al. 2023). Murugesan and Rajagopal (2010) conducted an experimental inquiry involving single and group pile models to reinforce saturated soft clay foundations using GECs. Their study revealed that the encasing sleeve significantly enhances the bearing capacity of the stone column while effectively managing pile deformation. Remarkably, the ultimate bearing capacity of GECs was approximately four times greater than that of the un-encased stone columns. In another study by Gniel and Bouazza (2009), a series of small-scale model tests were performed on GECs. They observed that pile expansion deformations predominantly occurred when the sleeves were partially wrapped. It was noted that pile deformations were minimized when the sleeve length matched the pile's length. Moreover, Lo et al. (2010) identified that the bearing capacity of end-bearing GECs, also known as an end-bearing pile, is heightened with an increase in sleeve stiffness. Notably, higher sleeve stiffness led to more uniform pile expansion deformation, reduced expansion magnitude, and diminished settlement (Yoo 2010).
It is further known that in the case of seismic loading the encasement brings additional benefits. Researchers have explored the dynamic response of granular columns in soft clay soils and the performance of GECs (Khabbazian et al. 2015; Tandel et al. 2017; Yoo 2010). Seismic loading on GEC supported foundations increases the level of complexity of the analysis required and the structural response. Cengiz and Güler (2018) have studied the seismic behavior of GECs under reflecting boundary conditions. In follow-on studies, Cengiz and Güler (2018) investigated the free-field response of GECs. Furthermore, the load bearing and settlement characteristics of GEC supported embankments were studied in a variety of dynamic loading conditions (Cengiz and Güler 2020). Liu et al. (2023) demonstrated that under the excitation of the same type and same peak amplitude of seismic wave, the dynamic pile-soil stress ratio of the GEC is about three times that of the traditional stone column because the geosynthetic material enhances the tensile and shear strength of the composite foundation’s soil mass through a reinforcement effect. All these studies show that geosynthetic encasement assures a much better foundation behavior compared to ordinary stone columns under earthquake loading conditions.
In summary, the stone columns generally require larger column diameters and smaller spacing to achieve the desired improvement in soil strength, whereas geosynthetic encased columns can be designed with smaller diameters and larger spacing due to the confinement provided by the geotextile or geogrid encasement. Moreover, geosynthetic encased columns can be designed to accommodate higher loads due to the higher confinement and lateral support provided by the encasement.
If the natural soil is a granular material, the stone column construction will be instrumental in densifying the in-situ soil. This cannot be achieved by a GEC, because the presence of the geosynthetic encasement will prevent the expansion of the column. Hence the GEC is not suitable if the in-situ soil is sand or gravel. But if the in-situ soil is cohesive and very soft the GEC is technically always superior to stone column.
Besides the technical criteria for comparing system performances, the environmental impacts of different solutions have become essential criteria in the overall ranking of engineering systems (Damians et al. 2017; Damians et al. 2018; Lee and Basu 2025). Shillaber et al. (2016) state that much of the climate change discussion has centered on emissions of greenhouse gases (GHGs) such as CO2. GHGs are those gases present in the atmosphere with the ability to absorb infrared radiation from the earth’s surface, preventing its escape into outer space. Emissions of GHGs may be presented in the form of an equivalent quantity of carbon dioxide (CO2eq.). It is also common to encounter the term carbon footprint as a descriptor relating to a set quantity of carbon emissions. In this frame, this paper aims to compare the performance and discuss the design considerations, and advantages and disadvantages of ordinary stone columns and geosynthetic encased columns as a ground improvement scheme, with a focus on their CO2eq. emissions.
2. DESIGN PRINCIPLES FOR ORDINARY STONE COLUMNS (OSC) AND GEOSYNTHETIC ENCASED COLUMNS (GEC)
The design of an embankment constructed on a weak subsoil improved with granular columns consists of three steps: (a) the vertical design of the soil-column system in accordance with the unit cell approach that deals with the vertical bearing and deformation behavior of the system while the embankment is considered as a surcharge and consequently the overall stability of the system is neglected; (b) the horizontal design of the soil-column-embankment system by considering load transfer to the granular columns in a stability analysis to determine the minimum required tensile strength of horizontal geosynthetic reinforcement on top of the columns that secures the stability of the system; and (c) as it is becoming the routine for geotechnical design, check the serviceability limit state (SLS), namely estimation of the total settlements.
2.1. Vertical design of columns (unit cell approach)
2.1.1. Stone columns
By installing granular columns, soil layers with low load-bearing capacity are improved in terms of load-bearing and deformation behavior. Stone columns are also known as Vibro Replacement and are installed by inserting a cylindrical probe with a vibrating tip into the soil and then filling the hole with crushed stones or gravel. The vibrations densify the stone, leading to an increase in its stiffness and bearing capacity. Stone columns have been used since the 1960s in Europe and since the 1970s worldwide (Schafer et al. 2016) and are widely recognized as an effective method for improving soft soils behavior.
In cohesive soils, the application of the stone columns is limited by the poor supporting capability of soft layers, expressed by the undrained shear strength. The efficiency of stone columns further depends on the soil properties, such as its plasticity, density, and water content. Another limitation of stone columns is the demand for special technical equipment. If the stone column is seen as a viable solution from design and construction perspectives, the improvement ratio, namely by how much the settlement is reduced with the applied ground improvement scheme, is usually determined according to Priebe (1995). Depending on the column diameter, the shear strength of the column material and the selected column grid and of course depending on the shear strength and compressibility of the soft in-situ soil, static calculations must be conducted. Priebe (1995) first developed the semi-empirical approach for Vibro replacement design in the 1970s, which was extended and published in 1995. That has been widely employed to design the stone columns. In this method, the subsoil is considered not to be affected by the column installation remaining at its initial state. Such an assumption is mainly valid for soft clays and silts. In the current design, we have assumed that the stone columns improve the overall performance of the subsoil, in comparison to the untreated state of subsoil. Hence as the number and diameter of stone columns in a unit area increases, the deformation modulus of the composite system also increases. As a consequence of the increased constrained modulus of the composite system, the settlements are reduced.
The suggested method foresees an unlimited load area on an unlimited column grid. In this case, a unit cell with area A is considered to consist of a single column with the cross-section Ac and the attributable surrounding soil (A-Ac). In this analysis also the following assumptions are made: i) The column is based on a rigid layer, ii) The column material is incompressible, iii) The bulk density of column and soil is neglected. This inherently implies that a loaded column would deform by expanding uniformly from head to toe, since no increase in lateral support of the soil with depth is considered. These assumptions eliminate the possibility of end bearing failure in the column where the settlement of loaded area results in a bulging of the column that remains constant over its entire length. It is further assumed that the surrounding soil reacts elastically, and that the column material undergoes shear stresses. Furthermore, Priebe (1995) assumes that because the soil is displaced laterally during stone column installation, the initial resistance corresponds to that of “liquid” stress state (i.e. K = 1.0). This is a reasonable assumption, given that cavity expansion usually implies that the earth pressure coefficient is greater than one. This approach is easy to use and gives good prediction of settlements, albeit with simplified assumptions.
Based on these assumptions and considering a Poisson’s ratio of ν = 0.33, the basic improvement factor n0 is determined. Although in the derivation of the improvement factor it is assumed that the column is incompressible, it is known that the column itself is compressible as well. Therefore, the columns will not only undergo bulging but also compression. The basic factor is then revised in two steps, taking into account column compressibility and increase in lateral support with depth. This gives the improvement factor, n2, used in actual design calculations. Subsequently, additional settlements from the non-rigid base are calculated. Having the friction angle of the column material, preferred area replacement ratio and the soils Poisson’s ratio, one can estimate the settlement reduction rather quickly. Importantly, the Priebe method has been used extensively over the years, with input parameters in various soil conditions well-calibrated to measured settlements (e.g. Wehr and Herle 2006).
Sonderman et al. (2016) summarizes the improvement and load bearing mechanisms of stone columns. They provide information on how the in-situ soil conditions, the construction (stone column installation) method and post-installation activities influence the outcome. They furthermore give an overview of several practical design methods and highlight some of the strengths and weaknesses of each approach.
2.1.2. GECs
The concept of GECs was first introduced by Van Impe in 1989 and has since been successfully applied in various projects involving the reinforcement of soft clay foundations to support embankments, dikes, or coal stockyards (Alexiew et al. 2011; Alkhorshid et al. 2019; Raithel and Kempfert 2000; Guler and Detert 2020). Researchers have made substantial progress in understanding the mechanism behind improving soft clay soils with GECs through unit cell models and two-dimensional (2-D) simulations (Ali et al. 2014; Almeida et al. 2013; Fattah and Majeed 2012a; Fattah and Majeed 2012b; Gniel and Bouazza 2009; Miranda and Da Costa 2016; Murugesan and Rajagopal 2007; Raithel and Kempfert 2000). While these models have provided valuable insights, they must be validated by real-world conditions in the field (Cengiz and Güler 2020; Khabbazian et al. 2015; Tandel et al. 2017; Yoo 2010). There is obviously the need for further research and field testing to enhance our understanding of GECs behavior in practical applications (Yu et al. 2016), however, in practice, the design guidelines presented by EBGEO (2011) have proven to be satisfactory.
The GEC system represents a further development of the stone column and has been used successfully in various projects, including highway/railway embankments, port facilities, dike constructions and storage tanks (Raithel et al. 2002; Muzammil et al. 2018). Contrary to stone columns any granular material with a minimum friction angle of 30° and confined stiffness of 5 MN/m2 at a reference pressure of 100 kPa (EBGEO 2011) can be used as the infill of the geosynthetic encasement and typically sand is used because generally it is more commonly available. The encasement tube can be made of geotextile or geogrid, which provides confinement and lateral support to the granular material.
The construction of GECs necessitates the driving of a pipe into the ground. It can be either a closed-ended pipe or an open-ended pipe which necessitates the soil within the pipe to be augered out. These two systems are called, respectively, displacement versus replacement method. In this study we considered the displacement method, since this is the more common procedure. After driving the pipe, the geosynthetic encasement is placed into the void and filled with granular material. Later the pipe is withdrawn which completes the process of construction.
The technique was developed as an alternative or extension, respectively, to stone columns and has several advantages over traditional stone columns, including better control over the column diameter, easier installation, applicability in very soft soils, filter stability and higher capacity.
By introducing a geotextile encasement with sufficient stiffness, the granular columns become supporting elements with higher modulus compared to the uncased columns. Also, as a consequence, the stone columns can be almost independent of the lateral support effect of the soft in-situ clay or peat layers.
The GEC system is dimensioned considering a single column with limited height resting on a bearing stratum. Tensile strength of the geotextile encasement and the expected primary settlement are determined. The stress concentration on the column head causes radial and outwardly directed horizontal stresses within the column. The special feature of the system is that these stresses are not only encountered by the inward earth pressure of the soft soil layer, but also by the tensile resistance of the geotextiles. So, the ring tension forces in the geotextile are mobilized to provide radial support and ultimately provide the needed equilibrium in the foundation system. As a result, the GEC foundation system can basically be used without any problem even in very soft soils, such as peat or mud soils with cu <15 kN/m2 where very little lateral support is available. In practice the usual range for GEC application is for in-situ soils with a cohesion of cu = 3 to 30 kN/m2. According to EBGEO (2011) with special measures, use of GECs in soils with cu < 3 kN/m2 is also permitted. For instance, this was the case in a land reclamation project in Hamburg, Germany (Raithel et al. 2002).
The mobilization of the ring tension forces is achieved by a radial expansion of the encasement as explained above, usually in the range between 2 and 5% elongation. This leads to radial deformation within the column, which causes settlement of the column head. The deformation behavior of the columns and surrounding ground is considered to be identical. Due to the high permeability of the GEC compared to the subsoil, a large part of the primary consolidation settlement occurs already during the construction phase. Eventually a state of equilibrium is reached, which is due to the shear resistance and the strength of the filling material, the radial counter-pressure of the soft layer and the ring tension of the geotextile encasement.
The vertical design of axisymmetric unit column cells aims to determine the hoop force in the ring direction of the encasement acting as a confinement to the column fill not only at failure (“tensile strength”) but also in the entire stress-strain range of geosynthetic behavior “tensile stiffness modulus” before failure. This allows calculation of the radial widening of the GEC based on the ring forces. As the settlements on the top of the column and soft soil are assumed to be equal in this analytical method, the vertical settlement on top of the GEC due the column widening will be taken to be equal to the average settlement of the embankment. The bearing elements (GECs) are assumed to be significantly stiffer than the subsoil and thus an identical settlement of subsoil and column required attraction of significantly higher stress on the GEC from the overlying embankment. Therefore, considering the balance of the forces, the pressure acting on the adjacent soil is lowered resulting in a reduction of the total settlements. The model proposed in EBGEO (2011) is developed based on the design approach from Priebe (1995), which focuses on granular columns and further enhanced to include the effect of the geotextile encasement. In the present study, the design approach proposed in EBGEO (2011) has been adopted.
2.2. Horizontal design of system (global stability of embankment)
For assessment of the slope stability of the embankment polygonal and circular slip surfaces have been analyzed with the block sliding method (force equilibrium) and Bishop’s method (moment equilibrium). The design strength of the horizontal reinforcement has been chosen in such a way that the degree of utilization (i.e. the ratio of the driving and resisting forces) is equal to or smaller than 1.0. The design was done in accordance with the EC7 (2004), DIN 1054 (2010) and EBGEO (2011).
Both column types have been simulated as discrete “columns” instead of using smeared parameter for the subsoil. As the stability design is a 2D calculation, the columns have not been simulated in their real dimension, but in relation to their area ratio. If the area ratio is for example 20%, then 20 cm of a 1 m wide soil section would have the properties of the column and 80 cm the properties of the soft soil.
To consider the contribution of the geotextile encasement on the global stability, an equivalent cohesion is derived from the activated ring tensile forces as described in Raithel (1999).
2.3. Settlement of the system
The settlements of the columns were calculated according to the previously described design method for stone columns according to Priebe (1995) and geotextile-encased granular columns according to Raithel (1999).
3. CO2 FOOTPRINT AS A MEASURE OF SUSTAINABLE METHODS IN GEOTECHNICAL CONSTRUCTION
Sustainability has become part of our daily lives as our living environment is being threatened by climate change. Despite the recent efforts to reduce the related risks, environmental sustainability has still not been reached. As a result, human-induced climate change is already affecting people, ecosystems, and livelihoods around the world. The fact that the construction industry is one of the largest users of global resources and is a major contributor of pollution and greenhouse gas emissions places a heavy responsibility on the industry to reduce its carbon footprint (Yoo 2023). In geotechnical soil improvement projects CO2 emissions dominate the produced greenhouse gases. Occasionally, depending on the type of natural soil, methane (CH4) or nitrous oxide (N2O) can play a role. Or if heavy machinery with cooling systems is employed, there could be minor Hydrofluorocarbons (HFC) emissions, especially if the equipment leaks. In summary, for all the activities including geotextile production, the kgCO2eq. values have been used, which incorporates all potential greenhouse gases. Since kgCO2eq. emissions contribute significantly to climate change, it is essential to understand the carbon footprint of construction materials and processes. Therefore, CO2eq. emissions have become a major concern in the construction industry, and there is an increasing interest in finding ways to reduce the carbon footprint of various construction materials and methods.
To date, there is no universally accepted approach for calculating greenhouse gas emissions resulting from construction activities. Typically, the determination of greenhouse gas emissions in special foundation engineering work is based on the standards ISO 14040 and ISO 14044. Concerning the deep soil improvement, the life cycle assessment (LCA) has been developed to enable optimization of the environmental impacts in the construction industry. The LCA includes additional material used, extra handling aspects in the construction stage, fuel consumption for transport and construction and corresponding CO2 emissions (Bunieski et al. 2023). When it comes to geosynthetics, the embodied carbon of a material can be defined as the amount of CO2 emissions released in the extraction, manufacturing and transportation of the geosynthetic. Embodied carbon of a material is calculated as kg of CO2 per mass of material (e.g. kgCO2eq/kg) (Raja et al. 2015). Raja et al. (2015) further conclude that there is a lack of geosynthetic-specific embodied carbon data in the literature for the calculation of carbon footprints in construction projects. However, Shillaber et al. (2015) state that geotechnical engineers can and should take a leading role in incorporating sustainable development goals into the selection of ground improvement design alternatives and construction methods through quantitative assessment of environmental impacts. From all valid design alternatives, overall cost and environmental impact should become the key factors in the decision process. Shillaber et al. (2015) further propose that estimates of carbon dioxide emissions may be used during the design process by geotechnical engineers to quantify some of the effects of ground improvement on the environment.
There are a limited number of publications on the CO2 emissions related to stone columns. Jefferson et al. (2010) investigated a number of issues significant to the evaluation of the environmental impact of vibro stone columns and discussed how a carbon dioxide emissions estimation tool could be developed for this area of ground improvement. The paper concluded that assessing the environmental impact of vibro stone column construction, in carbon dioxide emissions terms, is a complex process. To the best knowledge of the authors there is no published research related to the CO2 footprint of GECs.
Both stone column and GEC production contribute to CO2 emissions, like any other construction. The construction involves the use of heavy machinery, such as excavators, cranes, and drilling rigs, which require fossil fuels to operate. These fuels are burned, releasing CO2 into the atmosphere. The transportation of the stone material to the construction site also adds to the emissions. The extraction of the raw material may also be used for drilling, blasting and sieving in quarries. This process consumes a significant amount of energy and results in the emission of large amounts of CO2. Additionally, the granular fills used in the columns are transported from quarries to the construction site, also adding to the emissions. The amount of CO2 emitted during column construction depends on several factors, including the size of the project, the location of the quarry, and the efficiency of the machinery used.
In conclusion, while column production may be essential for construction, it also has significant environmental impacts, including CO2 emissions. Therefore, it is essential to explore and implement strategies to reduce the carbon footprint of this activity and promote sustainable construction practices. Using locally available materials and reducing the transportation distance can help reduce the carbon footprint of GEC production.
An additional factor contributing to CO2 emissions is the manufacturing process of the geosynthetic encasement used in GECs. Geotextiles used as encasement are typically made from polyesters, which are derived from fossil fuels. The production of these materials results in CO2 emissions, contributing to the overall carbon footprint of GECs. Horizontal reinforcement geosynthetics must be used for both stone columns and GECs and certainly these geotextiles also contribute to the CO2 footprint. However, the tensile strength of the horizontal reinforcement geotextile may change depending on the necessary replacement ratio and hence may differ from case to case.
4. CASE STUDY: OSC AND GEC SOLUTIONS IN ORGANIC SOFT SOILS WITH DIFFERENT STIFFNESS
For this research we chose as the in-situ soil an organic soft soil frequently encountered in practice and which does not allow the construction of an embankment without conducting a major soil improvement scheme. The thickness of this soft organic soil has been chosen as 10 m, which is also a good representative of commonly encountered soft soil thickness. We assumed the unit weight of this soft soil to be γ = 15 kN/m³. Typically, these problematic soft soils are fully saturated, therefore the effective unit weight of the in-situ soil was taken as γ′ = 5 kN/m³. The effective shear strength parameters used to represent the in-situ soil were c′ = 5 kN/m2 and ϕ′ =15°. The Poisson ratio was taken as ν = 0.4. The stiffness exponent (power law exponent) m that defines the amount of stress-dependency of the soil stiffness was taken as 0.9 because m is often assumed to be very close to 1.0 for very soft soils while 0.5 is more representative of medium dense to dense sand. In order to understand how the alternatives of stone column versus GEC compares in terms of design, the analyses were conducted for 3 different types of soft soils with identical shear strength parameters but with different confined stiffness values. Three different stiffness values that represent the range of typical soft clays were chosen as Eoed.p_ref = 500, 1,000 and 1,500 kN/m2. Since the stiffness is assumed to be stress dependent, the above given Eoed values correspond to a reference pressure (pref) of 100 kPa. The diameter of the stone columns and GECs was chosen as 0.8 m, so that the results would be easier to compare. Finally, the live load (i.e. traffic load) on the embankment surface, remaining on the safe side, was assumed to be 35 kPa. Furthermore, in the design the friction angle of the filling sand in GECs and the stone in the OSC were assumed to be 32.5° and 35°, respectively.
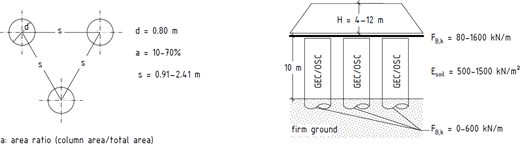
The settlement criteria are normally provided by the client. To make the comparison possible, the same amount of settlement was aimed for each case (namely, embankment height) while the overall target settlement of the system upon loading and consolidation of subsoil was chosen to be around 50 cm. It is also essential to mention that although the same settlement was considered as the design criteria to assure comparability of different systems in terms of the required materials to compensate the settlements, the ultimate limit state design has also been carried out to assure an acceptable factor of safety, namely utilization factor in conjunction with Eurocode 7 for vertical unit cell columns (column stability) and horizontal embankment system (slope stability analysis). In Table 1, the design results are given along with the exact calculated settlement values. As can be seen, both for the stone columns and GECs the mean calculated settlement ranged between 47 to 57 cm. This variation was within the desired range of 50 cm ± 10%, which was a satisfactory precision for the design. Figure 1 shows a schematic of the design output. It is important to mention that although extremely high replacement ratios (e.g. larger than 35%) are not technically reasonable, we decided to keep those calculation-based area ratios in Table 1 (marked with *) for the sake of comparability of different solutions.
Properties of investigated models of soil improvement for different conditions
| Case No. | Soil type | Subsoil constrained modulus (kN/m2) | Embankment height (m) | Type of soil improvement | Area ratio(%) | Spacing (m) | Required circumferential tensile strength of encasement (kN/m) | Required tensile strength of horizontal reinforcement (kN/m) | Calculated settlement (cm) |
|---|---|---|---|---|---|---|---|---|---|
| 1 | 1 | 500 | 4 | GEC | 10 | 2.41 | 500 | 80 | 47 |
| — | — | — | OSC | 40* | 1.20 | — | 80 | 48 | |
| 2 | — | — | 8 | GEC | 13 | 2.11 | 600 | 1400 | 57 |
| — | — | — | OSC | 56* | 1.02 | — | 200 | 58 | |
| 3 | — | — | 12 | GEC | 18 | 1.80 | 600 | 1000 | 55 |
| — | — | — | OSC | 70* | 0.91 | — | 400 | 54 | |
| 4 | 2 | 1000 | 4 | GEC | 10 | 2.41 | 400 | 80 | 48 |
| — | — | — | OSC | 20 | 1.73 | — | 150 | 48 | |
| 5 | — | — | 8 | GEC | 12 | 2.20 | 600 | 1400 | 51 |
| — | — | — | OSC | 39* | 1.22 | — | 400 | 51 | |
| 6 | — | — | 12 | GEC | 16 | 1.90 | 600 | 1400 | 55 |
| — | — | — | OSC | 51* | 1.07 | — | 800 | 55 | |
| 7 | 3 | 1500 | 8 | GEC | 11 | 2.30 | 600 | 1600 | 48 |
| 8 | — | — | — | OSC | 28 | 1.45 | — | 800 | 48 — |
*Calculated high area ratios that are shown for the sake of comparability of different solutions.
5. CO2 FOOTPRINT CALCULATIONS
The functional unit used for the carbon footprint analyses has been chosen as the unit surface area below the embankment. In order to compare the CO2 footprints of using either stone columns or GECs as a soil improvement scheme under an embankment to be built on soft subgrade, the CO2 emissions of materials and processes as well as hauling materials will be necessary. The various amounts of CO2 emissions used in this study to determine CO2 emissions per unit surface area are summarized in Table 2. The CO2 emissions due to installation of GECs and stone columns have not been derived theoretically. Rather, data from actual construction sites, where the diesel used for the installation equipment was monitored, has been evaluated. The fuel consumption for the installation has been converted to equivalent CO2 emissions and so the CO2 emissions were compared. Data from several different construction sites showed that the variance is very low and hence an average value was found to be a good approximation. The average value for stone column installations was 5.7 kg CO2eq. per linear meter of the stone column and for GECs the average was 5.5 kg CO2eq. per linear meter of the GEC. Considering that the data was coming from two different contractors and that the values were not significantly different, it was decided to use the same CO2eq. value. This decision was also made in order to not give the GEC an unjust advantage. In earthworks one of the most important parameters that affects the cost and hence the CO2 emissions is the hauling of materials. In this study it was assumed that the necessary earth fills to construct the GECs can be found in the project vicinity, since any granular fill, including sand, can be used. Therefore, we considered that the GEC infill material is transported from an average of 10 km. The stone columns require a more specific type of fill, which can or cannot be available in the near vicinity. Therefore, for the stones of the stone columns we considered four different distances, namely 10, 25, 50 and 100 km. It is even possible that the required stone cannot be found naturally, therefore we also considered cases where the stone has to be procured from a stone quarry.
CO2 emissions used in the calculations
| Source of CO2 emission | Reference | Unit | kg CO2 |
|---|---|---|---|
| Hauling of earth materials and geosynthetics with 16–32 metric ton lorry | Ecoinvent Centre. (2024) | ton-km | 0.172 |
| Unit weight of stone column and GEC fill material | — | ton/m3 | 1.7 |
| Diesel burned in construction machine | Ecoinvent Centre. (2024) | Liter | 3.34 |
| Crushed stone production (limestone was used as typical source) | Ecoinvent Centre. (2024) | ton | 4.84 |
| GEC installation (0.8 m diameter) | Based on project experience | m | 5.50 |
| Stone column installation (0.8 m diameter) | Based on experience by KASKTAS A.S. | m | 5.50 |
| Geosynthetic (for horizontal reinforcement and column encasement-PET) | EPD | kg | 4,63 |
The geotextile used is one of the sources of CO2 emission. In the design the required tensile strength of the horizontal reinforcement and encasement have been determined. However, the CO2 emission is controlled by the weight of the geotextile as indicated in Table 2. Therefore, the types of geotextiles foreseen and their unit weights are given in Table 3. The CO2 emissions of geotextile production have been determined based on the environmental product declaration (EPD) prepared by Kiwa BCS Öko-Garantie GmbH for the Huesker product Stabilenka (Kiwa 2021). Stabilenka is a woven geotextile for reinforcement, separation and filtration. The product is based on PET fiber and manufactured in Gescher and Dülmen, Germany. The EPD is based on the composition of the product grade Stabilenka 400/50 (unit weight 780 g/m2). The document states that the life-cycle assessment (LCA) results can also be transferred by scaling to all other Stabilenka products grades which mainly differ only in their unit weights and that this EPD is valid until 18/05/2026. From this EPD we have used the A1, A2 and A3 values, namely the components related to the production stage. EN 15804 (2012) and ISO 21930 (2017) defines A1 as the CO2 emission for the raw material supply, A2 as the transportation of the raw material to the geotextile manufacturing plant and A3 as the manufacturing process itself. A4 and A5 represent the construction process stage. A4 is related to the emissions from transporting the product from the factory to the construction site. Since the geosynthetic encasement is a material that is not as widely produced in different locations, the transportation of the geotextile was added separately. In this study, the hauling distance of the geotextiles used as a horizontal reinforcement was considered as 500 km. Since the encasement geotextile, at least currently, is not used as frequently, it was considered that it might need to be transported over larger distances and therefore this distance was assumed to be 1,000 km. Considering that the amount of geosynthetic (in terms of weight) is by order of magnitude smaller compared to the earthen materials, the analyses are typically less sensitive to the transportation distance of the geosynthetic products. In this study the stages of B1-B7 for geotextiles have been omitted, because these are related to use stage and are not relevant. Also, the end-of-life stage (C1-C4) has been omitted, because the minimum life expectancy of such embankments is foreseen as minimum of 100 years and most likely these materials will never be exhumed
Unit weights of geotextiles chosen as a result of the design analyses
| Tensile strength ofhorizontal reinforcement (kN/m) | Unit weight(g/m2) | Tensile strength of encasement(kN/m) | Unit weight(g/m2) | ||
|---|---|---|---|---|---|
| Machine direction | Cross-machine direction | Ring direction | Longitudinal direction | ||
| 80 | 45 | 200 | 400 | 100 | 750 |
| 150 | 50 | 300 | 500 | 100 | 850 |
| 200 | 45 | 400 | 600 | 100 | 1,000 |
| 400 | 50 | 750 | — | — | — |
| 800 | 100 | 1,400 | — | — | — |
| 1,000 | 100 | 1,700 | — | — | — |
| 1,400 | 100 | 2,230 | — | — | — |
| 1,600 | 100 | 2,640 | — | — | — |
6. RESULTS AND DISCUSSIONS
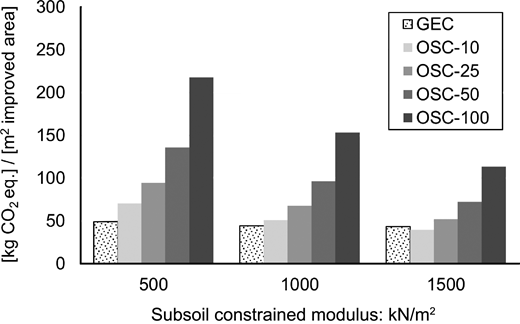
Figure 2 shows how the stiffness of in-situ soil effects the CO2eq. emissions for an embankment height of 8 m. It can be easily seen that the lower the constrained modulus of the subgrade, the higher the CO2eq. emissions. This is an expected result. However, when we compare the CO2eq. emission of GECs with OSCs, we see that even if the specific stone needed for the OSC is found in the near vicinity (10 km) for the in-situ soils with constrained modulus of 500 kN/m2 and 1000 kN/m2 the GEC alternative causes less CO2eq. emissions. If the in-situ soil has a constrained modulus of 1500 kN/m2 and a natural fill material of the OSC can be obtained from a distance of 10 km, the OSC alternative causes slightly less CO2eq. emissions. In cases of larger hauling distances for the stones to be used in the stone column construction, the difference in favor of GECs increases. For example, CO2eq. emissions per square meter of the to-be-improved area for a soil with E = 500 kN/m2 is 47 kg for GEC, where for the case that necessitates the stone to be transported from a distance of 100 km is 216 kg, in other words more than 4 times higher.
Comparison of CO2eq. footprint with changing constrained modulus of the in-situ soil for GEC with 10 km and OSCs with 10 to 100 km of hauling distances when natural granular column material is available for an embankment height of 8 m
Comparison of CO2eq. footprint with changing constrained modulus of the in-situ soil for GEC with 10 km and OSCs with 10 to 100 km of hauling distances when natural granular column material is available for an embankment height of 8 m
In order to provide more insight into how each component contributes to the total CO2eq. emissions, the presentation method used by Moncada et al. (2024) has been adapted where the bars have been divided according to each component of CO2 source. Figure 3 shows not only the comparison for the 8 m high embankments as was provided in Figure 2, but the results for all the models, provides also the breakdown of the CO2eq. In this graph the CO2eq. emissions of the production and transportation of geosynthetic encasement is given as a sum with the title: “GEC Encasement incl. Transport”. Similarly, the CO2eq. emissions of the production and transportation of horizontal reinforcement geotextile is given as a sum with the title: “Horizontal GTX incl. Transport”. Here it can be clearly seen that OSCs installation is causing a large percentile of the CO2eq. when the transportation distance of the granular fill material can be found in the near vicinity. As the transportation distance of the granular fill material increases, the CO2eq. contribution of the transportation of fill material starts to be the dominant source of CO2eq emissions.

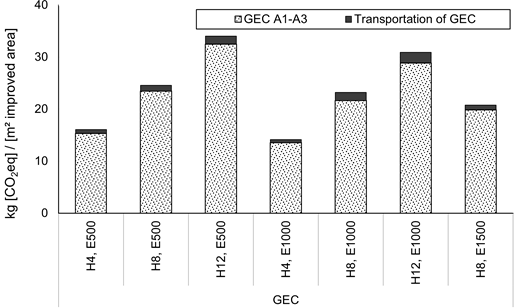
One of the reasons for showing the CO2eq. emissions necessary to produce the geotextiles and their transportation to the construction site in sum in Figure 3 is the fact that the transportation of the geotextiles causes a small fraction of the CO2eq. compared to the CO2eq. necessary for the geotextile production. This fact can be clearly seen in Figure 4 where the CO2eq. contributions of the encasement geotextiles production and transportation are shown. As can be seen from this figure, the transportation of the geotextile causes only a very small fraction of the CO2eq.
CO2eq. emission for the production and transportation of the encasement geotextile
CO2eq. emission for the production and transportation of the encasement geotextile
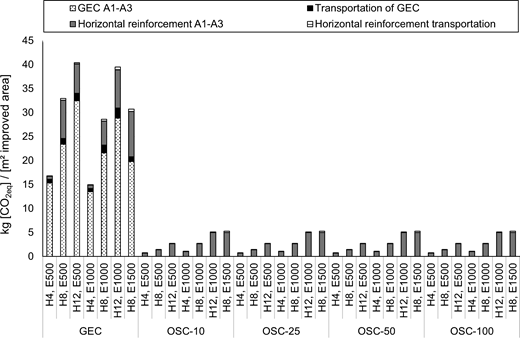
When we compare the CO2eq. contribution of all geotextiles, namely of the encasement geotextile used for GECs and the horizontal reinforcement geotextile (Figure 5), it can be seen that the GEC alternative has a much larger CO2eq. impact in terms of only geotextile production and transportation.
CO2eq. emission for the production and transportation of the encasement and horizontal reinforcement geotextile
CO2eq. emission for the production and transportation of the encasement and horizontal reinforcement geotextile
As can be seen in Figure 5, this is not only caused by the use of the encasement geosynthetic. Horizontal geotextile contribution for GEC solution is also larger than for the OSC, because typically the GEC solution allows a wider spacing between the columns. However, as was demonstrated in Figure 2, when we consider all the CO2eq. sources, the GEC alternative generally is advantageous for the CO2 footprint.
In Figure 6, the same comparison is made as in Figure 2, but this time for the case, when there is no natural source for the required stone material for OSCs is available in the vicinity, but the fill material has to be crushed stone produced in a stone quarry. For this case, for all the investigated in-situ soil constrained modulus values, the GEC alternative produces less CO2eq. emissions. This statement covers all in-situ soil types with constrained moduli of 500, 1000 and 1500 kN/m2. And again, when we compare the CO2eq. emission for the in-situ soil with E = 500 kN/m2 the CO2eq. emissions increase to 262 kg if the crushed stone needs to be transported from a distance of 100 km. This is more than 5 times the CO2eq. emissions of the ground improvement alternative using GECs.
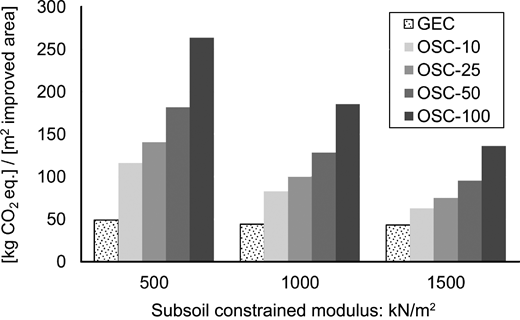
Comparison of CO2eq. footprint with changing constrained modulus of the in-situ soil for GEC with 10 km and OSCs with 10 to 100 km of hauling distances when crushed stone must be used as material for the granular column for an embankment height of 8 m
Comparison of CO2eq. footprint with changing constrained modulus of the in-situ soil for GEC with 10 km and OSCs with 10 to 100 km of hauling distances when crushed stone must be used as material for the granular column for an embankment height of 8 m
In Figure 7 the breakdown of CO2eq. is given similar to in Figure 3, but when a suitable fill material cannot be found, and crushed stone has to be used. It can be seen that the need to use crushed stone increases the CO2eq. significantly. There is no need for the GECs to use crushed stone, because here any grain size will do the job as long as it is a granular material.
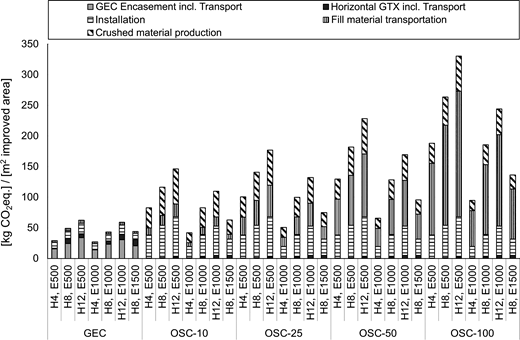
CO2eq. emission for all models with the breakdown according to the sources when crushed stone must be used for the columns
CO2eq. emission for all models with the breakdown according to the sources when crushed stone must be used for the columns
In Figure 8 the same data as in Figure 7 is shown in terms of percentile contributions of each CO2eq. source. It can be seen that the crushed stone production contributes a substantial percentage of CO2eq. emission. As expected, the transportation of the crushed stone gradually becomes more dominant as the transportation distance increases.
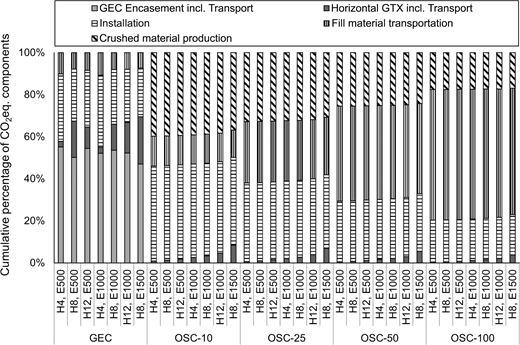
CO2eq. emission for the production and transportation of the encasement geotextile when crushed stone must be used for the columns
CO2eq. emission for the production and transportation of the encasement geotextile when crushed stone must be used for the columns
Figure 9 shows the effect of the embankment height for the in-situ soil with the lowest constrained modulus considered in the present study (E = 500 kN/m2) and when natural fill material for the OSCs is available. As seen in Figure 9, the CO2eq. emissions for the necessary soil improvement logically increase with increasing embankment height. However, we can further see in Figure 9 that the trend of CO2eq. emission with increasing embankment height is smaller for GEC than for stone columns. This is evident from the slope of the regression line. To express it numerically, the CO2 emission per square meter increases with a coefficient of approximately 4 with the increased height of embankment for GEC improved soil, where the same multiplier for the stone column alternative, depending on the distance from which the granular material is being transported, is 4.6 for 10 km, 6.2 for 25 km, 9.0 for 50 km and 14.5 for 100 km, respectively. As can be seen, with increasing the hauling distance of the suitable granular material for the stone column, the increase in CO2 emission becomes much more significant for higher embankments.
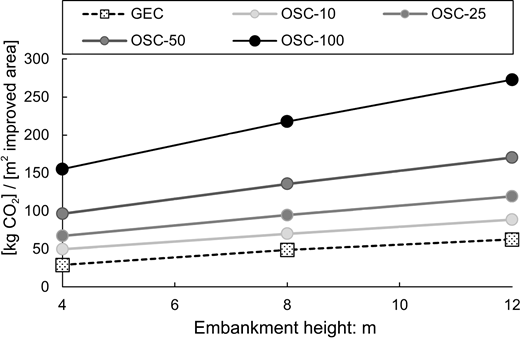
A similar trend is observed for the in-situ soil with a constrained moduli of 1,000 kN/m2 and 1,500 kN/m2. It is obvious that these trends are also valid for the condition where crushed stone must be used.
As mentioned earlier, we had assumed a relatively large transportation distance for the encasement geotextiles, namely 1000 km. This choice was made not to give the GEC alternative an unfair advantage. However, the effect of different transportation distances for the encasement geosynthetics was investigated by also repeating the analyses for 500 km and 1500 km transportation distances. This comparison was made for an embankment height of 8 m. In these analyses all other parameters were kept constant and only the geosynthetic encasement distance was changed. The results are given in Table 4. As can be seen, the effect of the transportation distance of the encasement is not very significant.
CO2eq. Emissions for different soil types and transportation distances of encasement geosynthetics
| Constrained modulus of soil(kN/m2) | Geosynthetic encasement transportation distance (km) | ||
|---|---|---|---|
| 500 | 1000 | 1500 | |
| 500 | 44.0 | 47.3 | 50.5 |
| 1000 | 40.2 | 43.2 | 46.3 |
| 1500 | 37.5 | 40.3 | 43.1 |
Similarly, the effect of transportation distance of the horizontal reinforcement geosynthetic has been analyzed. As was previously stated, this distance was assumed to be 500 km. New results were analyzed for horizontal geotextile transportation distances of 100 km and 1000 km. These analyses were conducted for an 8 m high embankment and for the subsoil that has a constrained modulus of 500 kN/m2. The findings are given in Table 5. Also, for the different transportation distance of horizontal reinforcement the CO2eq. emissions were not significantly affected.
CO2eq. Emissions in kg for different transportation distances of horizontal geotextile reinforcement
| Type of column | Distance of transportation for the horizontal reinforcement (km) | ||
|---|---|---|---|
| 100 | 500 | 1000 | |
| GEC | 46.4 | 47.3 | 48.4 |
| OSC-10 | 68.8 | 68.9 | 69.1 |
| OSC-25 | 93.3 | 93.5 | 93.7 |
| OSC-50 | 134.3 | 134.4 | 134.6 |
| OSC-100 | 216.1 | 216.3 | 216.5 |
The reason behind the transportation distance of geosynthetics not making a significant contribution to the CO2 footprint is because of their relatively small weight compared to that of earth materials.
Finally, it is important to note that although this article provides a clear overview of the environmental aspects associated with deep ground improvement with GEC and OSC as two typical solutions, there are still limitations on how such an technical design can be carried out. For instance, the current technical design assumed the same magnitude of settlement as the target design criteria for both methods in each case. However, other design aspects such as unrestricted determination of embankment height for each soil condition by targeting identical safety factor from overall stability analysis or similar replacement ratio among other possibilities could be realized in the technical design stage. Moreover, as the results presented in Table 1 reveal, the OSC is technically a less relevant ground improvement approach for the very soft subsurface condition such as case no. 1 to 3 where the constrained modulus of the soil is equal to 500 kN/m2. However, the design of the OSC system was considered without setting any technical precondition in the present study for the sake of comparison. The current study involves only an environmental assessment and hence considered only CO2eq. This is a limitation, because we did not encompass economic, social, functional and resilience considerations. However, this choice was made because of the CO2eq. is more straightforward to analyze and compare objectively.
7. CONCLUSIONS
In this study, a realistic design was conducted for an embankment which needs to be constructed on a very soft soil. Two alternatives were compared, namely stone columns and GECs as a soil improvement scheme. In this framework, a comparative design was conducted for three stiffness values of the in-situ soft soil, namely for constrained modulus values of 500, 1,000 and 1,500 kN/m2. To see how the embankment height effects the design, three embankments of different heights were also designed, namely 4, 8 and 12 m.
The following conclusions were drawn from the CO2 emission estimates:
For a very soft soil the use of GECs causes less CO2 emissions when compared with stone column for all cases when the constrained modulus value of the in-situ soil is 500 or 1,000 kN/m2.
For a soil with constrained modulus value of E = 1500 kN/m2, the stone column solution can provide a smaller CO2 emission than the GEC alternative, if the specific stone to be used for the stone column can be found from a natural source (without the need for crushing rock) in the near vicinity (10 km or less hauling distance).
If the specific material required for the stone column has to be hauled from a distance of 100 km, the use of GECs instead of stone column can reduce the CO2 emission by 4 or 5 times depending on the constrained modulus of the soil.
With increasing height of the embankment, the GEC alternative provides an even larger reduction in the CO2 emission compared to stone column installation.
It is a known fact that stone columns cannot be used as a ground improvement when the in-situ soil is a very soft clay. However, even if stone columns can be installed, a GEC alternative must be evaluated, because it may help reduce the CO2eq. and hence probably also the overall cost of the ground improvement.
DATA AVAILABILITY STATEMENT
All data used is included in the submitted article.

