


Extensive research has been conducted on tortuosity–porosity relationships for porous media. However, the relationship remains unclear, particularly when the porosity falls within the range 0·2–0·5, which covers most granular geomaterials. This study proposes a novel tortuosity–porosity model for estimating tortuosity in saturated porous media. Syringe tests were conducted by simulating seepage flow through a porous medium under Darcy’s law. The tortuosity was achieved after determining the porosity and permeability using the volumetric saturation method and constant-head method, respectively. Compared with existing models, the proposed model exhibited consistency at porosity values above 0·5 and improved smoothness as the porosity approached 0·2, which outperformed them in accurately predicting the tortuosities in these experiments. In addition, a sensitivity analysis against porosity demonstrated its precision, thereby facilitating its engineering application. These experimental results and model predictions provide valuable insights into the influence of pore geometry on flow paths and corresponding tortuosities.
NOTATION
- A
cross-sectional area of sample (m2)
- a
pore throat size between particles (m)
- B
a fixed value (–)
- Cc
coefficient of curvature (–)
- Cu
coefficient of uniformity (–)
- d
mean diameter of particles (m)
- d10
10% of particles finer than this size (m)
- h
constant hydraulic head (m)
- k
permeability (m2). Note that the symbol K may be used in the field
- L
length of sample (m)
- Le
effective length of a flow channel (m)
- Ls
straight-line distance through a porous media (m)
- P
a constant documented with specific values (–)
- p
hydraulic pressure (Pa)
- Q
volume of passing water (m3)
- Re
Reynolds number (–)
- t
time intervals (s)
- Vf
fluid volume (m3)
- Vs
volume of solid particles (m3)
- Vt
total volume of porous media (m3)
- Vv
void volume (m3)
- β
an exponent to be determined experimentally or numerically (–)
- τ
tortuosity (–)
- τ1
tortuosity for configuration in Fig. 2(b) (–)
- τ2
tortuosity for configuration in Fig. 2(c) (–)
- ϕ
porosity (–). Note that the symbols n or φ may be used in the field
- ϕt
threshold of porosity (–)
INTRODUCTION
Porous media permeability has attracted considerable attention because of its importance in the seepage of groundwater flow (Berg, 2014; Fu et al., 2021; Yang et al., 2019). Flow channels exhibit a longer path than a direct path connecting the source and destination in pore space morphology (Fig. 1) (Ehsan Samaei et al., 2021). Carman (1937) introduced tortuosity to reconcile estimated permeability with experimental results. However, tortuosity is frequently treated as a variable parameter in practical applications owing to the inherent complexity and variability of porous media in real-world scenarios (Ghanbarian et al., 2013); hence, its geo/petrophysical significance is limited. Therefore, a description of tortuosity that accurately reflects the actual flow path while being physically interpretable is required.
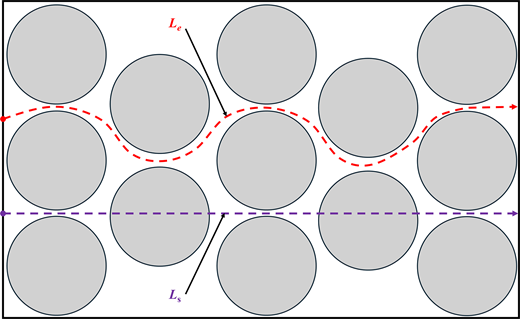
Concept of tortuosity. Here, Le is the effective length of a flow channel; Ls is the straight-line distance through a porous media. Grey circles represent solid particles (Cao et al., 2024b)
Concept of tortuosity. Here, Le is the effective length of a flow channel; Ls is the straight-line distance through a porous media. Grey circles represent solid particles (Cao et al., 2024b)
Theoretically, tortuosity is the ratio of the effective length (Le) of a flow channel to the straight-line distance (Ls) through porous media:
Hillel (2003) expressed tortuosity as the ratio Ls/Le, which is the inverse of Equation (1). Bear (1972) characterised tortuosity as the square of the inverse of Equation (1) (i.e. (Ls/Le)2), whereas Holzer et al. (2023) described it as the square of Equation (1) (i.e. (Le/Ls)2). However, tortuosity is fundamentally a geometric concept based on path length. Consequently, we adopt Equation (1). Table 1 summarises the relationships between tortuosity and porosity proposed in various studies.
Summary of tortuosity–porosity equations in published literature
| Researcher | Equation | Applicable conditions |
|---|---|---|
| Koponen et al. (1997) | τ becomes infinite at a threshold porosity ϕt = 0·33 | |
| Mota et al. (2001) | β is an exponent. The suggested value is 0·4; for saturated sand, the value is 1·33 (Millington & Quirk, 1961) | |
| Yu & Li (2004) | It only enables flow between square particles in an equilateral-triangle configuration with streamlined direction changes limited to multiples of 90° (Ghanbarian et al., 2013). | |
| Matyka et al. (2008) | P is a constant with specific values: 0·49 for beds with high porosity (Mauret & Renaud, 1997), 0·41 for spheres that are both monosized and polydisperse (Comiti & Renaud, 1989), and 0·77 for laminar fluid flow in a 2-D porous media comprising freely overlapping solid squares (Matyka et al., 2008). | |
| Ahmadi et al. (2011) | B is a fixed value of 1·209 for cubic packings and 1·108 for tetrahedral packings. τ becomes infinite at porosity values of 0·248 and 0·143, respectively. | |
| Conzelmann et al. (2022) | A linear model was developed based on artificial aggregates of different shapes. However, it gives τ = 0·95 at ϕ = 1, which is physically unreasonable as τ must be 1 in this limit. |
In existing tortuosity–porosity models (see the supplementary material for details), tortuosities have similar values when the porosities are greater than 0·4, except for Mota’s model. When the porosity is below 0·35, significant discrepancies arise. This could be attributed to the fact that the models were proposed specifically for the investigated materials and to match the experimental data by specifying the fitting factors or exponents (Seigneur et al., 2019). Consequently, uncertainties emanate when the porosity is between 0·2 and 0·5, which encompasses that of the majority of granular geomaterials. To address this gap, we developed a novel model based on spherical particles and geometric similarity used in previous research on porous media (Cao et al., 2024a; Yan et al., 2022). Following the intrinsic correlations among permeability, tortuosity and porosity, syringe tests were performed to replicate Darcy flow through saturated porous media and then the permeability of these syringes was determined under a constant hydraulic head. These tests provided data for characterising the tortuosity–porosity model.
THEORETICAL DEVELOPMENT
Conceptualisation and mathematical model
Natural geomaterials have a random topology and varied particle sizes, resulting in a highly heterogeneous soil structure at multiple scales. To extend the application of continuum mechanics and obtain statistically consistent void ratio and porosity, a representative elementary volume (REV) is applied to granular materials with a matrix of solid particles and void spaces (Bear, 1972; Cao et al., 2024a). Figure 2(a) shows a porous medium through which fluid seepage can be conceptualised as a collection of spherical particles at continuum scale (i.e. single-to-multiple REVs). Inspired by previous applications of geometric similarity for soil surrogates (Yan et al., 2022), Figs. 2(b) and 2(c) show that particle and pore matrices can be categorised under the loosest and densest packing conditions. While these conceptualisations and simplifications may not fully capture the complexity of real granular soils, they allow us to gain a clearer understanding of the underlying mechanisms in a controlled system.
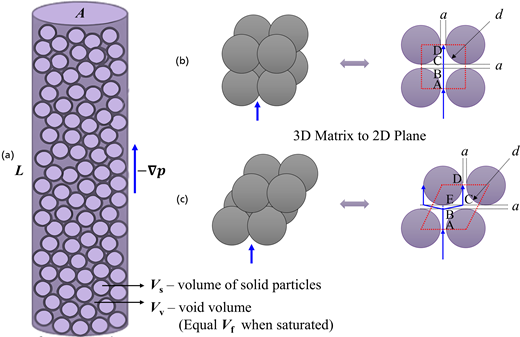
Idealised configurations of a porous media as a collection of spherical particles: (a) porous media has length (l) and cross-sectional area (a), spheres represent solid particles, and the void volume is equal to the volume of hydraulic conduits under saturated conditions; idealised configurations of seepage flow paths in the porous media under the (b) loosest and (c) densest packing conditions, with a REV shown by the red rectangles and the streamlines represented by the blue arrows
Idealised configurations of a porous media as a collection of spherical particles: (a) porous media has length (l) and cross-sectional area (a), spheres represent solid particles, and the void volume is equal to the volume of hydraulic conduits under saturated conditions; idealised configurations of seepage flow paths in the porous media under the (b) loosest and (c) densest packing conditions, with a REV shown by the red rectangles and the streamlines represented by the blue arrows
From Fig. 2, porosity (ϕ) is defined as
where Vt, Vv and Vf are the total volume of the porous medium, void volume and fluid volume under fully saturated conditions, respectively.
For a porous medium with nonoverlapping particles, the flow channel is assumed to follow the idealised pathway shown in Fig. 2(b). Based on this conceptual model, Vt and Vv of the REV are calculated as follows:
where d is the mean diameter of the particles (that is effective particle size upon grain size distribution (GSD) analysis), and a is the pore throat size between the particles.
Combining Equations (2)–(4) gives
When ϕ approaches 1, a yields infinite values. Owing to the spherical shape, ϕ cannot achieve a zero value, even if overlaps exist in the densest condition. Hence, the minimal value of ϕ would be 0·1. In addition, because streamline BC represents the vertical direction, Fig. 2(b) suggests that the actual length of the flow path is equal to the straight length along the hydraulic gradient. Therefore, the tortuosity τ1 = 1·0 according to Equation (1).
In addition, the random arrangement of particles in a real porous medium can cause the streamline to deviate from the configuration shown in Fig. 2(b). Hence, the configuration shown in Fig. 2(c) is considered for this purpose; this has a constant porosity owing to geometric similarity for Vt (red quadrangle shown in Figs. 2(b) and 2(c)) (Yan et al., 2022). In Fig. 2(c), the length of BC is:
Therefore, by implementing the effective strategies of Yu and Li (2004), the tortuosity for seepage flow through unrestrictedly overlapping particles (specifically in Fig. 2(c)) is given by
Ultimately, the true tortuosity can be determined by calculating the average across all potential configurations of the flow paths in the porous media. The results can be simplified by considering two idealised configurations. Hence, the tortuosity is calculated as the average of configurations shown in Figs. 2(b) and 2(c):
The proposed model in Equation (8) is dependent only on porosity and does not incorporate any empirical constant to account for the tortuosity in saturated porous media.
Applying conditions with assumptions
This proposed model applies to porous media, such as fine to coarse sand and their mixtures with negligible fine content, under the following assumptions.
- ▪
The soil matrix is fully saturated, with temperatures above 0°C, standard atmospheric pressure and no gas bubbles in the pore matrix.
- ▪
Porous media are considered to have uniform and isotropic REVs upon continuum mechanics, whereas particles are represented as idealised spheres with a representative diameter (i.e. highly uniform coarse soil).
- ▪
The void volume of the soil matrix remains constant, and the seepage flow regime is laminar, that is with a Reynolds number (Re) below 10.
Based on these assumptions, the proposed model does not apply to well-graded soils with a high fine content, particularly when the porosity is less than 0·20.
MATERIALS AND METHODS
Experimental setup
Previously, the relationship between porosity and tortuosity in porous media has been based on limited experimental data; particularly granular materials have been idealised. Hence, syringe tests were conducted at the Geosystems Research Laboratory at the University of Queensland in Brisbane, Australia. A plastic syringe (height: 116 mm; diameter: 25·4 mm) was employed as the cylindrical column with saturated porous media (Fig. 3(a)), providing an appropriate slenderness ratio of 4·5 (Banzhaf & Hebig, 2016; Lewis & Sjöstrom, 2010). In total, 15 syringes were filled with porous media, including 14 with glass beads and 1 with quartz sand. All syringes were placed in a vacuum desiccator and subjected to negative pressure until air bubbles were completely removed. Then, these syringes underwent a 24-h saturation process, during which capillarity allowed deionised water to flow into the syringes and ultimately fill up the pore matrix (Fig. 3(b)).
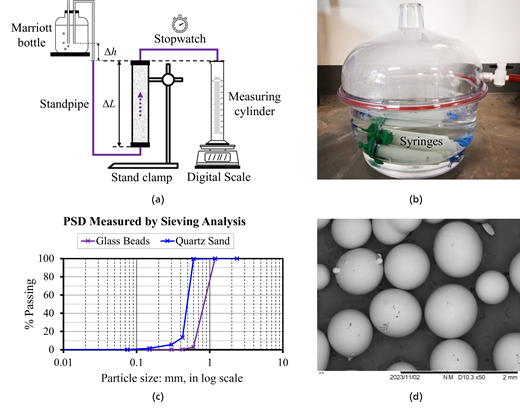
(a) Schematic diagram of the experimental setup for the seepage test under Darcy’s law. (b) Saturation process of group syringes in a vacuum desiccator. The purple arrow represents the direction of flow through porous media. (c) GSDs of glass beads (purple) and quartz sand (blue) measured by sieving analysis. (d) Glass beads (at a magnification of 50×) under scanning electron microscopy (SEM). The dark area represents the top of the SEM pin stub, whereas the particle surface is highlighted in greyish-white
(a) Schematic diagram of the experimental setup for the seepage test under Darcy’s law. (b) Saturation process of group syringes in a vacuum desiccator. The purple arrow represents the direction of flow through porous media. (c) GSDs of glass beads (purple) and quartz sand (blue) measured by sieving analysis. (d) Glass beads (at a magnification of 50×) under scanning electron microscopy (SEM). The dark area represents the top of the SEM pin stub, whereas the particle surface is highlighted in greyish-white
Porous media
Manufactured glass beads (BlastOne, sizes of 0·60–0·85 mm) were utilised as the porous media in the syringes. Compared with quartz sand, glass beads have a similar chemical composition (i.e. primarily silicon dioxides) and can be regarded as idealised spherical particles (Fig. 3(d)). To make the model more valuable and widely applicable, laboratory quartz sand (Sigma-Aldrich) was also selected, which is a real-world granular material that rarely exhibits complete sphericity. According to the GSD measured by sieving analysis (Fig. 3(c)), the coefficient of uniformity (Cu) was 1·41 (beads) and 1·23 (sand), respectively, while the coefficient of curvature (Cc) was 0·93 (beads) and 1·03 (sand), respectively. Therefore, these porous media can be classified as poorly graded under the Unified Soil Classification System (USCS).
Experimental procedures
Porosity was calculated using the volumetric saturation method, as shown in Equation (2), which is based on three phases in the soil REV (Cao et al., 2024b; Yan et al., 2022). Permeability was determined using Equation (9), which employs the constant-head method using a Mariott bottle (Cao et al., 2024b). To enhance the accuracy of manual measurements, the permeability was measured ten times to obtain an average.
where Q is the volume of passing water; L and A are the sample height and cross-sectional area, respectively; h is the constant hydraulic head and t is the time interval.
Following a previous study (Cao et al., 2024a), the tortuosity τ can be expressed as
where k is the permeability of a single REV and d10 is the effective particle size corresponding to 10% finer materials on the cumulative GSD curve.
Hence, five steps are required for validating Equation (8): (i) determine d10 from the GSD by way of sieving analysis for coarse soil; (ii) calculate ϕ based on the volumetric fractions of the fluid and solid phases in a REV; (iii) measure k using a constant-head test; (iv) obtain τ using determined d10, k and ϕ; (v) validate the accuracy of the proposed model.
RESULTS AND DISCUSSION
Validation of new model
After determining d10, k and ϕ, τ is achieved using Equation (10). The supplementary material lists all experimental values and predicted tortuosities. Figure 4 shows the τ–ϕ relationship. The results from the proposed model were close to those from the syringe and published experiments (Barrande et al., 2007; Duda et al., 2011) that may not be readily available due to the limitation of our experimental conditions. Furthermore, the proposed model is consistent with the models of Matyka and Ahmadi when porosity values range from 0·5 to 1·0. However, the tortuosity curve of the proposed model shows improved smoothness compared with those from Ahmadi as porosity approaches 0·25. Therefore, the proposed model is more accurate than existing equations for estimating the tortuosities of syringes with saturated glass beads.
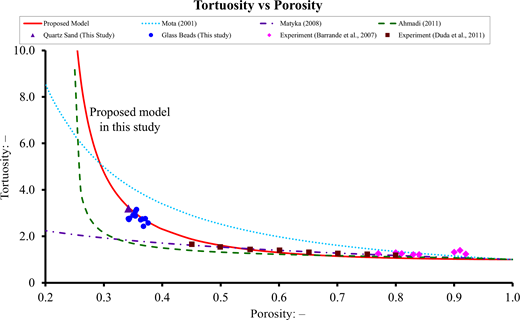
Comparison between the proposed and existing models. Experimental data are represented by a purple triangle and blue circles (obtained from this study), as well as brown squares (obtained from Barrande et al., 2007), and pink diamonds (obtained from Duda et al., 2011)
Sensitivity analysis of
Figures 5(a) and 5(b) show a plot of τ and k calculated using the proposed tortuosity–porosity relationship against the experimental data, and a sensitivity analysis of ϕ after ±5% and ±10% adjustments. The τ and k values predicted by the proposed model agreed well with those measured experimentally; the optimal predictions were those obtained without adjusting ϕ. Hence, the proposed approach succeeded in forecasting the tortuosity of saturated porous media and predicted experimental permeabilities within an order of magnitude.
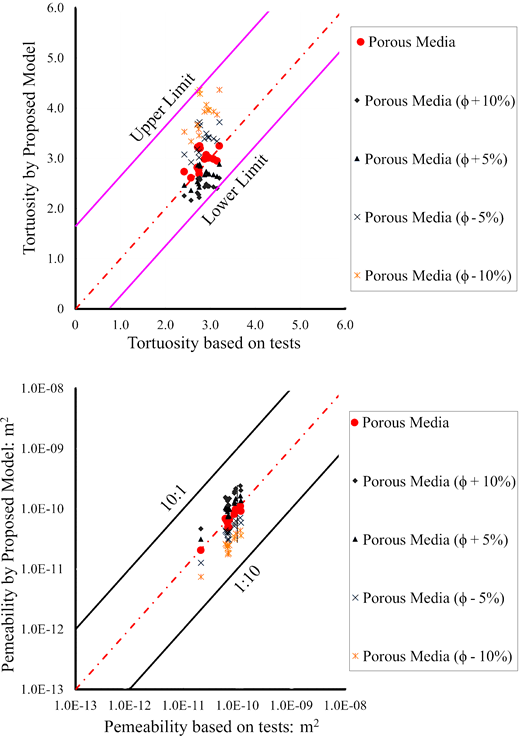
(a) Comparison of tortuosities (τ) estimated by the proposed model against τ obtained from syringe experiments, and a sensitivity analysis of ϕ in the proposed model. The purple lines outline the upper and lower limits. (b) Comparison of permeabilities (k) estimated by the proposed model against k obtained from syringe experiments, and a sensitivity analysis of ϕ in the proposed model. The black lines represent corresponding ratios (i.e. a ratio of the value in the vertical axis to that in the horizontal axis)
(a) Comparison of tortuosities (τ) estimated by the proposed model against τ obtained from syringe experiments, and a sensitivity analysis of ϕ in the proposed model. The purple lines outline the upper and lower limits. (b) Comparison of permeabilities (k) estimated by the proposed model against k obtained from syringe experiments, and a sensitivity analysis of ϕ in the proposed model. The black lines represent corresponding ratios (i.e. a ratio of the value in the vertical axis to that in the horizontal axis)
The proposed model is developed specifically for homogeneous porous media with a porosity in the range of 0·2–0·5. Hence, it may not be suitable for natural geomaterials such as clay, silt and unsaturated soil. Although a porosity limit of 1·0 is often considered essential (Ghanbarian et al., 2013), τ is not physically realistic when ϕ is below 0·2. This is regarded as the minimum porosity of quartz sand under the USCS. Despite a limitation for porosity below 0·2, it represents a notable improvement in terms of higher value and broader applications across a wider porosity range of 0·2–1·0 compared with current models, making it crucial for sandy granular materials in engineering practice, such as drainage and filtration systems.
CONCLUSION
In seepage flow systems, the complex pore-scale structure makes it challenging to adequately represent the tortuosity of granular materials at continuum scale. Herein, a geo/petrophysical model for estimating the tortuosity in porous media was proposed and validated using experimental data obtained from syringe tests. The proposed model incorporates the idealised configurations of spherical particles in a soil matrix, which replaces the fitting factors/exponents through rigorous derivations based on a conceptual model. Hence, the contributions of the study are summarised as follows.
- ▪
By assuming idealised spherical particles in porous media, a tortuosity–porosity model (see Equation (8)) was developed to predict the tortuosity of porous media under fully saturated conditions.
- ▪
Having a more intuitive physical meaning than fitting factors, the model outperformed existing equations in accurately estimating the tortuosities of syringes filled with saturated glass beads.
- ▪
This model successfully predicted the tortuosity in the experiments. It requires one variable of the porous media; a sensitivity analysis against porosity ensures its precision, facilitating its use in engineering practice.
Therefore, the developed model represents a significant advancement that offers valuable insights into the influence of pore geometry on flow paths and the corresponding tortuosity. Furthermore, this simplified model establishes a theoretical framework and provides a solution for estimating tortuosities in porous media with fluid seepage. It is important to acknowledge specific simplifications and assumptions made during the research. In reality, geomaterials in natural environments are considerably more complex, particularly in terms of their heterogeneity and variable saturations. As such, future research shall explore the combined effects of these factors to reproduce in situ conditions at engineering scale.
CREDIT AUTHORSHIP CONTRIBUTION STATEMENT
W. Cao: Conceptualisation, methodology, investigation, formal analysis, data curation, visualisation, writing – original draft.
N. Hu: Conceptualisation, methodology, investigation, formal analysis, data curation, visualisation, writing – review and editing.
H. Hofmann: Methodology, resources, supervision, writing – review and editing.
A. Scheuermann: Methodology, supervision, writing – review and editing.
DECLARATION OF COMPETING INTEREST
The authors declare that they have no known competing financial interests or personal relationships that could have appeared to influence the work reported in this paper.
ACKNOWLEDGEMENTS
This research was funded by the Australian Research Council through its Discovery Project (grant number: DP190103782). The authors thank School of Civil Engineering and School of the Environment at the University of Queensland for their support and the reviewers and editor for constructive comments on this paper.

