Suffusion can be defined as the loss of relatively small soil particles in gap-graded soils without any volume change. In this study, the susceptibility of interaction energy-induced suffusion in sand–clay mixtures is investigated using a laboratory-scale two-dimensional flow cell. The filtrated clay during the injection was measured at three outlets to assess the gravity and reattachment effects as a function of clay type (kaolinite, illite and bentonite) and sand grain size. It was found that the settling of detached clay particles and the reattachment effect during their transport through the sand medium is a strong function of the swelling potential of clay and the size ratio between sand and clay. In addition, observed particle size distributions of clay at the outlet demonstrated that the relatively small and large clay particles are susceptible to suffusion for non-swelling and swelling clay, respectively. The comparison of total filtrated clay between a two-dimensional flow cell and the typical soil-column experiments (one-dimensional flow) revealed a high chance of underestimating suffusion using soil-column experiments to assess the suffusion of sand–clay mixtures.
INTRODUCTION
The occurrence of soil instability under external loads can cause large deformation and a reduction of soil strength (Khabazian & Hosseininia, 2020; Dinh et al., 2021). Apart from the mechanical instability of soils caused by static or dynamic loadings, the internal instability of soils is mostly caused by seepage forces, which occasionally leads to the failure of critical infrastructure such as dams (Rahardjo et al., 2007; Wan & Fell, 2008). One of the phenomena caused by the internal instability of soil is suffusion, which can be defined as the loss of relatively fine particles in the soil matrix without any volume change caused by the hydrodynamic forces applied to fine particles (Fannin & Slangen, 2014; Hunter & Bowman, 2018; Zhong et al., 2018; Lee et al., 2021; Won, 2022). Because the suffusion increases the porosity of the soil matrix, it leads to an increase in hydraulic conductivity and a decrease in the stiffness and strength of the soil matrix (Chang et al., 2014; Ke & Takahashi, 2014; Rochim et al., 2017; Xu et al., 2021). Therefore, the suffusion significantly reduces the long-term sustainability of earthen structures such as underground pipelines and dams (Chen et al., 2023). For example, it was reported that 46% of embankment dam failures were caused by internal erosion (referred to as suffusion, backward erosion, concentrated leak and contact erosion) (Foster et al., 2000; Xiong et al., 2021a), indicating that comprehensive understanding of suffusion is required for the stability of embankment dams.
Many previous studies have investigated the suffusion of gap-graded soils through experimental and numerical techniques. A few examples include experimental studies to assess the internal stability of soils caused by one-dimensional seepage flow (Wan & Fell, 2004, 2008; Luo et al., 2013, 2020; Hunter & Bowman, 2018; Maroof et al., 2021; Wang & Xu, 2023) and the assessment of suffusion under many hydro-mechanical conditions using a coupled computational fluid dynamics–discrete element method (CFD–DEM) (Hu et al., 2020; Liu et al., 2020; Cheng et al., 2021; Xiong et al., 2021a; Wang et al., 2023). These previous studies investigated potential factors affecting the suffusion of gap-graded soils such as fine sand content (Wang & Xu, 2023), particle shape (Maroof et al., 2021; Xiong et al., 2021a), relative density (Israr & Indraratna, 2019), heterogeneity (Oueidat et al., 2024), flow direction (Ahlinhan & Achmus, 2010; Xiong et al., 2021b) and hydraulic loading history (Rochim et al., 2017).
The above-mentioned studies provided invaluable insights into understanding hydraulically induced suffusion of coarse-grained gap-graded soils. However, soils containing fines (fines here refers to silt or clay) are more vulnerable to suffusion even under low hydrodynamic forces because of the relatively low sizes of fines (Seghir et al., 2014), particularly when the difference in particle size between coarse and fine is significant. In addition to the hydraulically induced suffusion, the suffusion of fines can also be induced by the detachment of fines from the reduced attraction energy between fines and coarse particles as the suffusion is initiated by the detachment of fines (Won, 2022). This interaction energy-induced suffusion becomes more significant if fines are mostly composed of clay minerals because of their high specific surface and relatively small particle sizes, as seen in some previous studies (Choe et al., 2022; Won et al., 2022).
Because the specific gravity of clay particles is greater than one, the gravitational effect can be anticipated while the detached clay particles are transported through the sand matrix. Xiong et al. (2021b) investigated the impact of gravity on the suffusion of coarse-grained gap-graded soils using CFD–DEM. They found a higher cumulative eroded mass of small particles for downward flow (positive gravity) than for upward flow (negative gravity). However, this study may not represent the gravity effect for the suffusion of clay particles because of an absence of considering the unique characteristics of clay particles such as the interaction energy between clay and sand, the platy shape of clay particles with aggregation or flocculation and the swelling characteristics of clay particles. Some previous studies investigated the impact of flow direction on the suffusion of gap-graded soils (Ma et al., 2021; Liu et al., 2023), but those modelling-based studies also cannot represent the above-mentioned unique characteristics of clay particles to assess the suffusion of sand–clay mixtures. Therefore, the primary objective of the present study was to investigate the gravitational effect on the suffusion of sand–clay mixtures using a two-dimensional flow cell. The particle size distributions (PSDs) of the remaining clay in the flow cell and breakthrough curves (BTCs) were measured to discuss the variation of PSDs before and after the suffusion. In addition, the suffusion caused by the two-dimensional flow was compared to those caused by one-dimensional flow.
MATERIALS AND METHODS
Materials
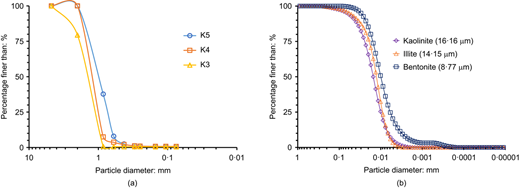
In this study, three clays (kaolinite, illite and bentonite) and three sands (K3, K4 and K5) were selected to investigate the effect of the clay mineralogy and the size ratio (SR) between median particle size (d50) of sand and d50 of clay on the suffusion of sand–clay mixtures. The PSDs of sand and clay were determined using sieve analysis and a laser diffraction particle size analyser (Horiba LA-960), respectively ASTM D422 (ASTM, 1998) (Fig. 1). The specific gravity, maximum void ratio and minimum void ratio were measured using a pycnometer ASTM D854 (ASTM, 2014), funnel deposition method ASTM D4253 (ASTM, 2016a) and the vibrating table method ASTM D4254 (ASTM, 2016b), respectively. In addition, the roundness of sand particles was evaluated using image analysis (Fig. S1 in the online supplementary material). It was found that the sand used in this study was relatively uniform (coefficient of uniformity (Cu in Table 1) of less than 2) with rounded particle shape (roundness > 0·7) (Krumbein & Sloss, 1951; Santamarina et al., 2001). All physical properties of the sand and clay used in this study are summarised in Table 1.
X-ray diffraction (XRD) (step size (2θ) = 0·017, X-ray voltage = 40 kV and X-ray current = 30 mA) and X-ray fluorescence (XRF) were used to evaluate the mineralogical and chemical compositions of sand and clay as shown in Fig. S2 and Table S1 in the online supplementary material, respectively. XRF results revealed that the sands used in this study were mostly composed of silicon dioxide (SiO2) (> 74%) and XRD results indicate that the three clay samples were predominantly composed of kaolinite (Fig. S2(a) in the online supplementary material), illite (Fig. S2(b)) and montmorillonite (Fig. S2(c)). Therefore, it can be inferred that the three clay samples referred to as kaolinite, illite and bentonite used in this study can represent 1 : 1 clay, 2 : 1 non-swelling clay and 2 : 1 swelling clay, respectively.
Two-dimensional flow cell
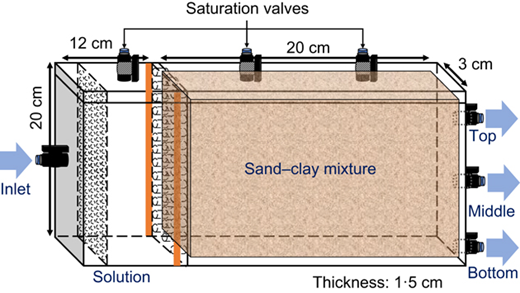
An acrylic cell with an internal height, length and width of 20, 32 and 3 cm, respectively, was designed to perform two-dimensional suffusion experiments. The designed cell was divided into inlet, sample and outlet, as shown in Fig. 2. The inlet part with a length of 12 cm was designed to minimise the pulsation effect caused by the peristaltic pump. The dimensions of the sample were therefore 20 (height) × 20 (length) × 3 cm (width) and it was 1·5 cm thick. In addition, the two thin acrylic plates with 448 holes (0·23 cm dia.) and 66 holes (0·5 cm dia.) were installed between the inlet and sample part to distribute flow throughout the cell. A plastic mesh with an opening size of 75 μm (corresponding to #200 sieve) was installed at the thin plate to prevent any loss of sand and clay during the injection. The three outlet valves were installed 0·5, 8·5 and 16·5 cm from the bottom to measure the filtrated clay concentration at the outlet as a function of depth. The #200 plastic mesh was installed at the outlet to prevent loss of sand particles. The relatively large perforated holes for outlets and low Darcy's velocity of less than 1 cm/min minimised the significant localised flow near the outlets. A schematic drawing of the designed flow cell used in this study is shown in Fig. 2.
Experimental set-up
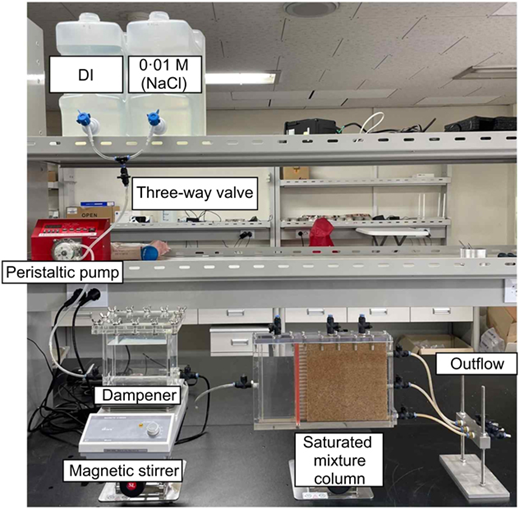
The sand was placed in a sonicator bath (frequency = 40 kHz) to remove impurities attached to the sand particles, which can potentially disturb the measurement of the clay concentration. The sand was repeatedly washed until the turbidity reached below 10 NTU. The oven-dried sand was mixed with the mass of clay corresponding to the 3% clay content in an airtight container and shaken for 30 min before placing the sample into the sample part. The sand–clay mixture in the sample part was prepared using wet pluviation to obtain a saturated state. The weight of sand corresponding to the relative density of 70% for the pure sand medium was placed in the flow cell to prevent the alternation of dry density during the injection. The level of 0·01 M NaCl (salt) solution during the wet pluviation was controlled slightly higher than the height of the sample to prevent the segregation of clay caused by the lower settling velocity of clay than sand. The boundary between the sample and the top cap was saturated by slowly injecting the background solution after the top cap was assembled. The solution was injected until the solution flowed out of the saturation valves (Fig. 2) without any trapped air bubbles at the top of the sample. A similar quantity of retained clay throughout the sample part was obtained before injection (e.g. minimum and maximum kaolinite contents of 2·94 and 3·05% were obtained for the K3–kaolinite mixture), indicating that the semi-homogeneous state of sand–clay mixtures was obtained. The picture of the experimental set-up is shown in Fig. 3.
The peristaltic pump was used to control the flow rate of 45 ml/min (Darcy's velocity = 0·74 cm/min) for all experiments. The height of the three outlets was set identically to remove the effect of the head difference between the inlet and outlet on the flow rate at the three outlets. A similar flow rate was obtained at the three outlets (∼15 ml/min each) for saturated sand without clay. A turbidimeter (measurement range from 0 to 1000 NTU with an accuracy of ±0·5%) was used to obtain the clay concentration at the three outlets. Note that an almost perfect linear relationship (R2 (coefficient of determination) > 0·99) between measured turbidity and clay concentration for kaolinite, illite and bentonite was observed. In addition, the flow rate of 45 ml/min selected in this study corresponds to the hydraulic gradient (e.g. 0·03, 0·032, 0·082 for K3–illite, K4–illite and K5–illite mixtures) lower than the critical hydraulic gradient (> 0·1) for hydraulically induced suffusion, implying that the energy-induced suffusion was dominant under the selected flow rate.
The PSDs of retained clay after the injection and filtrated clay during the injection were measured using a laser particle size analyser (Horiba LA-960). The PSD of retained clay was measured by sampling sand specimens four-by-four using an acrylic container with an inner height, length and width of 5, 20 and 3 cm, respectively. The acrylic container was divided into four sections in the direction of length to obtain four samples (5 (height) × 5 (length) × 3 cm (width)) in each sampling. More specifically, the solution was slowly drained after the injection, and then the designed acrylic container was placed on top of the flow cell. The sand–clay mixtures were then placed in the container by reversing the flow cell and the container. A thin stainless steel plate was used to slice the sand–clay mixture, whereby four samplings using the container gave rise to a total of 16 samples (four-by-four). The sampled sand specimens were transferred to a beaker filled with deionised water before stirring using a magnetic stirrer. Then the suspended clay detached from the sand specimen was sampled for the PSD analysis.
As seen in Fig. 3, a pulse dampener was installed between the peristaltic pump and the flow cell, primarily to reduce the pulsation effect. In addition, the pulse dampener and the three-way value were used to gradually reduce the ionic concentration (IC) during the injection. The initial required volume of 0·01 M sodium chloride (NaCl) solution in the pulse dampener to reach 0 M at 15 pore volumes (PVs) was determined by solving the ordinary differential equation (see details in Choe et al. (2022)), which yielded the required volumes of 2150, 2160 and 2170 ml for K3, K4 and K5 sand, respectively. Only deionised water was injected for 15 PVs, which gradually reduced the IC of the sand–clay mixtures initially filled with 0·01 M sodium chloride solution. Therefore, the detachment of clay particles in this study was induced by the decrease in attraction energy between sand and clay caused by the decrease in IC (Compère et al., 2001; Won et al., 2020).
In total, 11 experimental conditions were selected in this study. Nine experimental conditions were selected for three types of sand mixed with three types of clay at 3% of clay content and two experimental conditions were K3– and K5–1% bentonite mixtures to compare the results obtained from 3% of bentonite content. The fraction of filtrated clay (Me) for each experimental case was evaluated by calculating the area under the BTCs using the trapezoidal method. In addition, the mean and median particle size of PSDs was evaluated to assess the susceptibility of relatively small clay particles on suffusion. Note that low clay contents of 1 and 3% were selected in this study to investigate the suffusion induced by detachment solely at the sand–clay interface.
RESULTS AND DISCUSSION
Observed breakthrough curves and distribution of retained clay
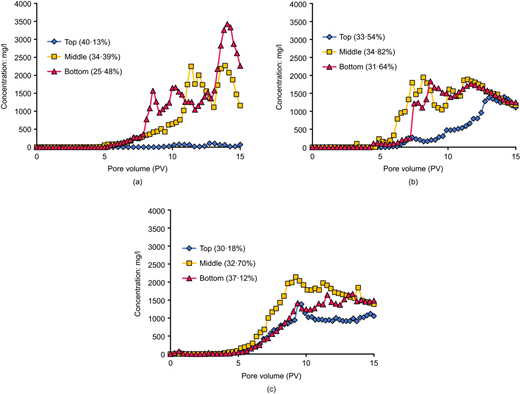
Figures 4, 5 and 6, respectively, illustrate the observed BTCs of kaolinite–, illite– and bentonite–sand mixtures at 3% of clay content. As seen in Figs 4 and 5, the breakthrough of clay particles was initiated at PV > 5 (corresponding to IC = 3 × 10⁻³ M), implying that the detachment of non-swelling clay was not substantial at IC > 3 × 10⁻³ M. Although detached clay particles can be subjected to reattachment during their transport through the sand matrix (Won et al., 2023) (particularly for sand with low grain size), almost no clay particles found at PV = 0–5 can be attributed to the low detachment rate. This is because clay particles adjacent to the outlet can be easily filtrated out after detachment without any significant reattachment effect if detachment occurs at PV = 0–5. A slightly earlier breakthrough of illite (Fig. 5) than kaolinite (Fig. 4) was observed, which implies the earlier initiation of detachment for illite than kaolinite.
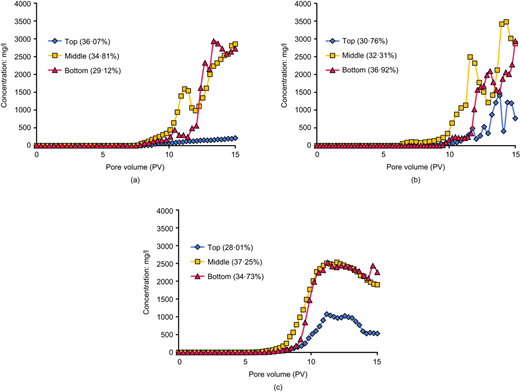
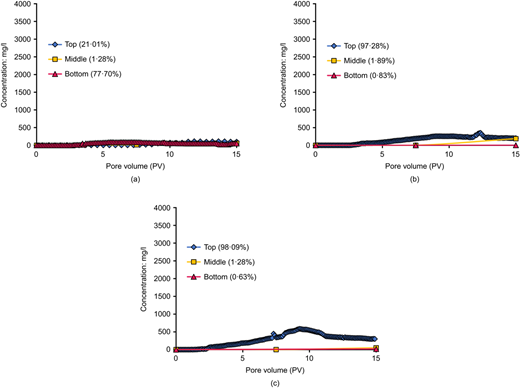
In contrast, the earlier breakthrough of K4– and K5–bentonite mixtures (Figs 6(b) and 6(c)) was observed at the top outlet (breakthrough initiated at PV ∼ 2·5 and ∼1·5 for K4– and K5–bentonite mixtures, respectively). This suggests earlier initiation of detachment for bentonite than kaolinite or illite. In addition, almost no filtrated bentonite particles at the middle and bottom outlets were observed, which can be attributed to the high swelling potential of bentonite particles leading to substantial reattachment near the middle and bottom outlets. The detached bentonite particles blocked the flow paths adjacent to the middle and bottom outlets because of the vertical gravitational settling of detached bentonite particles. Relatively high bentonite concentration at the middle and bottom outlets for sand–1% bentonite mixtures (Fig. 7) (e.g. maximum bentonite concentration at the middle outlet was 1272 and 505 mg/l for K5– and K3–1% bentonite mixture, respectively) indicates that the reattachment effect of bentonite becomes less significant at lower bentonite content.
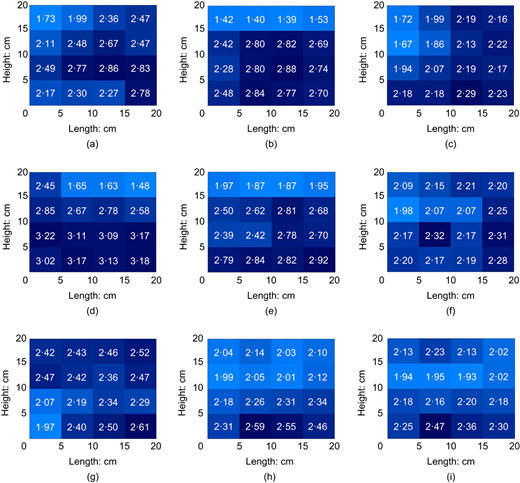
The distribution of retained bentonite after injection for K4– and K5–bentonite mixtures (Figs 8(h) and 8(i)) showed a higher bentonite content at the bottom part than that at the top part of the flow cell. In contrast, a relatively uniform distribution of retained bentonite content was observed for the K3–bentonite mixture (Fig. 8(g)). This implies that the low bentonite concentration observed in BTC (Fig. 6(a)) can be attributed to the low detachment during the injection. The low detachment of bentonite for K3–bentonite mixtures is most likely because of low hydrodynamic forces applied to attached bentonite particles. In other words, the attractive forces between most bentonite particles and K3 sand may not be overcome by the hydrodynamic forces. The immediate reattachment for K3–bentonite mixtures is less likely than the low detachment because of the relatively high pore sizes of K3 sand.
The swelling potential of clay particles led to the reverse trend of suffusion at the top, middle and bottom outlets. The lowest clay concentrations at BTCs were observed at the top outlet for kaolinite (Fig. 4) and illite (Fig. 5), whereas the highest bentonite concentrations were observed at the top outlet (Fig. 6). The relatively high breakthrough concentrations at the middle and bottom outlets with low retained clay content at the top part of the cell for kaolinite and illite (Fig. 8) suggest less significant reattachment occurs for kaolinite and illite than bentonite. For example, the low retained kaolinite at the top part of the cell for the K4–kaolinite mixture (Fig. 8(b)) (kaolinite content = 1·39–1·53%) with the lowest breakthrough kaolinite concentration at the top outlet (Fig. 4(b)) implies that the substantial portion of detached kaolinite particles at the top part was filtrated at the middle or bottom outlet without being subjected to reattachment. Overall, the observed BTCs and the distribution of retained clay shown in Figs 4–8 imply the need for taking the swelling potential into account to assess the susceptibility of suffusion in sand–clay mixtures.
It is notable that the highest volume fraction of injected water (Fw) was observed at the top outlet for K3–kaolinite (Fw = 36·07%) (Fig. 4(a)) and K3–illite (Fw = 40·13%) (Fig. 5(a)) mixtures, which implies that the more significant reattachment (or clogging) occurred near the middle and bottom outlets than the top outlet. This is consistent with a relatively low retained clay content at the top part of the cell for those two mixtures (Figs 8(a) and 8(d)). However, the lowest quantity of filtrated clay at the top outlet for those two mixtures (Figs 4(a) and 5(a)) indicates that a significant portion of detached clay particles were subjected to reattachment or transportation near the middle or bottom outlets because of the gravity effect. The above-mentioned phenomenon implies that the gravity effect can significantly affect the suffusion of sand–clay mixtures for relatively high SR. The high pore size of sand allows detached clay particles to move downward relatively easily during their transport through the sand matrix.
In contrast, the lowest Fw at the top outlet was observed in K5–kaolinite (Fig. 4(c)) (Fw = 28·01%) and K5–illite mixtures (Fw = 30·18%) (Fig. 5(c)), which is more or less intuitive, because a higher clay concentration was observed at the middle and bottom outlets than at the top outlet for those two mixtures. The more significant quantity of filtrated clay at the middle and bottom outlets led to water flowing more easily out of those two outlets than the top outlet during the injection. The relatively uniform distribution of retained kaolinite (Fig. 8(c)) and illite contents (Fig. 8(f)) after the injection indicates a relatively low fraction of detached clay particles at the top part of the flow cell was subjected to reattachment near the middle or bottom outlets. Most of the detached clay particles were not significantly affected by gravity and were subjected to reattachment or filtrated at a similar elevation. The lower quantity of retained kaolinite or illite near the inlet than those near the outlet for K5–kaolinite (Fig. 8(c)) and K5–illite (Fig. 8(f)) mixtures (e.g. kaolinite content at the top = 1·72 and 2·16% near the inlet and the outlet) suggests the reattachment of clay occurred mostly at a similar elevation for low SR.
The lowest Fw at the top outlet was observed for K4–kaolinite mixtures (SR = 80·4) (Fig. 4(b)), similarly to the trend observed for K5–kaolinite mixtures (SR = 54·7), whereas a relatively similar Fw for the three outlets was observed for K4–illite mixtures (Fig. 5(b)). This implies the presence of a threshold SR for non-swelling clay where the gravity-induced reattachment effect becomes significant. The observed BTCs and Fw in Figs 4 and 5 for kaolinite and illite suggest the threshold SR of ∼96 (SR between K4 and illite) where the gravity effect becomes significant above this threshold SR (SRs of 112 and 134 for K3–kaolinite and K3–illite mixtures, respectively).
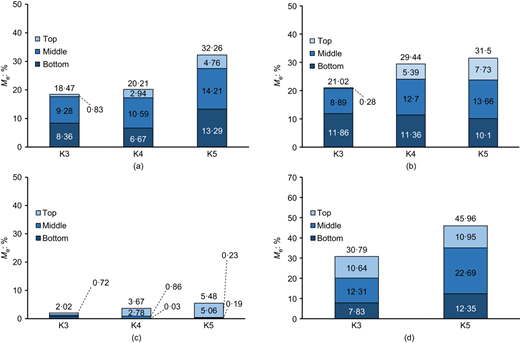
The Me values (Fig. 9) from observed BTCs (Figs 4–6) indicate that a susceptibility to suffusion in the order of illite > kaolinite > bentonite was observed in this study (except for the K5–kaolinite mixture (Me = 32·26%) being slightly higher than K5–illite mixture (Me = 31·49%)). In addition, the even higher Me(middle) and Me(bottom) than Me(top) for kaolinite and illite (Figs 8(a) and 8(b)) and higher Me(top) than Me(middle) and Me(bottom) for bentonite (Fig. 9(c)) clearly suggest the importance of swelling potential in assessing the suffusion of sand–clay mixtures subjected to two-dimensional flow.
The even higher Me values for 1% bentonite–sand mixtures (Fig. 9(d)) than 3% bentonite–sand mixtures (Fig. 9(c)) indicate the high susceptibility to suffusion for swelling clay under low clay content. This can be attributed to the low reattachment of the detached bentonite particles because a low fraction of immobile bentonite particles at 1% of bentonite content leads to relatively high pore size.
Particle size distribution of filtrated and retained clay
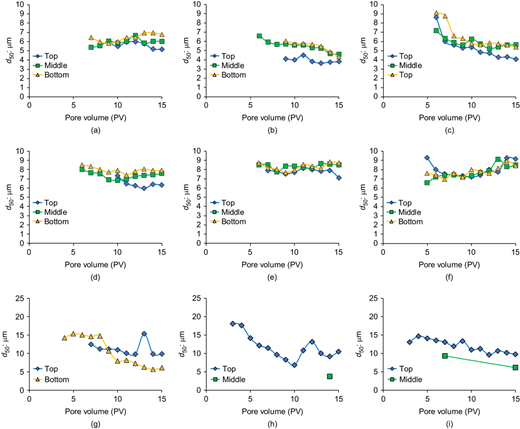
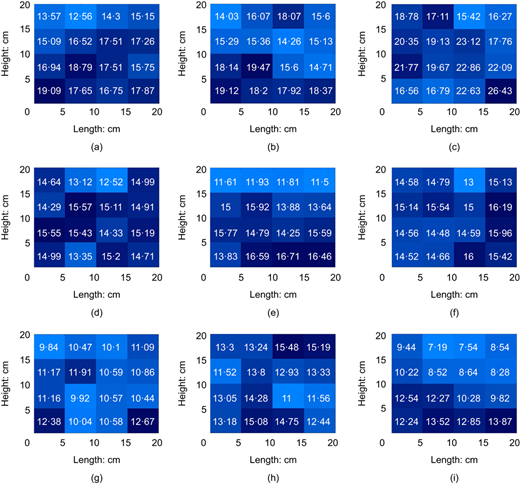
Figures 10 and 11 present the median size of clay particles at the outlets (d50(outlet)) and retained clay after injection (d50(retained)), respectively. Overall, even lower median sizes than d50 of clay (Table 1) were observed at the outlets (Fig. 10), whereas higher median sizes of retained clay than d50 were observed (Fig. 11) for kaolinite and illite. This can be attributed to the combined physical and physicochemical effects. The small kaolinite or illite particles can relatively be easily transported through the pore space of a sand medium with a low reattachment effect (physical effect) as well as having a low attraction energy between sand and clay compared to large kaolinite or illite particles (physicochemical effect (Packman et al., 2000; Rousseau et al., 2004; Nishad & Al-Raoush, 2021)). In addition, slightly lower d50(outlet) for kaolinite and illite at the top outlet (Figs 10(a)–10(f)) indicates that the relatively large clay particles were more substantially subjected to the gravity effect than the relatively small clay particles during their transport. Similarly, slightly higher d50(retained) than d50(outlet) were observed for kaolinite and illite (Figs 11(a)–11(f)), but no distinctly higher d50(retained) than d50(outlet) at the bottom part was observed. Because most of the d50(retained) values for kaolinite and illite are higher than the d50 of kaolinite and illite from PSD, the irregular trend of d50(retained) as a function of height and length of the flow cell implies the localised reattachment effect. Note that the lower attraction energy for lower colloid-sized particles can be supported by attraction energy from Derjaguin–Landau–Verway–Overbeek theory (sum of van der Waals attraction and double-layer repulsion) in the literature (Torkzaban et al., 2007; Won et al., 2021).
In contrast, a similar range between d50(outlet) (Figs 10(g)–10(i)) and d50(retained) (Figs 11(g)–11(i)) was observed for bentonite, which cannot be explained by physical and physicochemical reasons for kaolinite and illite. Because of the high swelling and clogging potential, the preferential flow channels for sand–bentonite mixtures may be formed under the constant flow rate (Xu et al., 2018; Biju & Arnepalli, 2020). Under these circumstances, the localised high hydrodynamic forces can be applied to the bentonite particles at the preferential flow channels. Therefore, small and large bentonite particles in PSD near the preferential flow are likely to be subjected to suffusion during the injection. Notably, the decrease in d50(outlet) for bentonite demonstrated the early suffusion of large bentonite particles because larger bentonite particles are subjected to higher hydrodynamic forces. Note that almost no d50(outlet) value at the middle and bottom outlets for K4– and K5–bentonite mixtures (Figs 10(h) and 10(i)) can be attributed to the low Fw values (Figs 6(b) and 6(c)).
The ratio between d50 and mean clay particle size at the outlet (Routlet) and retained clay (Rretained) showed the shape of the PSD of clay at the outlet and the flow cell. The Routlet > 1 for kaolinite (Figs S5(a)–S5(c) in the online supplementary material) and Routlet ∼ 1 for illite (Figs S5(d)–S5(f) in the online supplementary material) indicate the right-skewed PSDs and almost normally distributed PSD, respectively. This suggests that the shape of PSDs at the outlet was not consistent with the left-skewed PSDs (i.e. Routlet or Rretained < 1) of kaolinite and illite (Figs 1(b) and 1(c)). In contrast, the Rretained < 1 for kaolinite and illite (Figs S6(a)–S6(f) in the online supplementary material) are consistent with the shape of PSDs for kaolinite and illite. Likewise, the Rretained > 1 values for bentonite were consistent with the PSD of bentonite (Fig. 1(d)), whereas Routlet values were slightly lower than 1 for bentonite (Figs S5(g)–S5(i) in the online supplementary material). The trend of d50(outlet), d50(retained), Routlet, Rretained shown in Figs 10 and 11, and in Figs S3 and S4 of the online supplementary material, suggests the significant discrepancy of suffusion mechanisms between non-swelling and swelling clay.
Comparison with one-dimensional column experiment
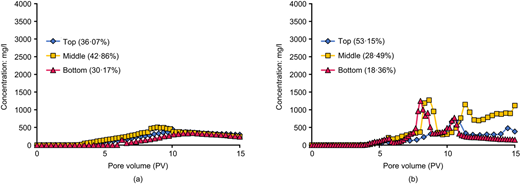
In this study, the fraction of filtrated clay particles (Me) at every 5 PVs was evaluated from the observed BTCs for quantitative comparison of suffusion in sand–clay mixtures induced by two-dimensional flow (this study) and typical soil-column experiments (one-dimensional flow (Choe et al., 2022)). The trapezoidal method was used to calculate the area under the observed BTCs (Figs 4–6). Because the flow rate at each outlet was not identical during the injection, three Me values were calculated when the sum of the volume of water at three outlets reached every 5 PVs. The sand, clay, and Darcy's velocity (0·74 cm/min) used in one-dimensional soil-column experiments were the same as those used in this study and the downward flow was utilised in Choe et al. (2022). In addition, the impact of IC gradient (gradual or stepwise decrease in IC) and flow rate was also investigated by Choe et al. (2022) (a total of 34 experimental cases), further comparison between one- and two-dimensional flow for those two factors can provide the comprehensive understanding of gravity effect on suffusion of sand–clay mixtures. Further details about experimental procedures of one-dimensional soil-column experiments can be found in Choe et al. (2022).
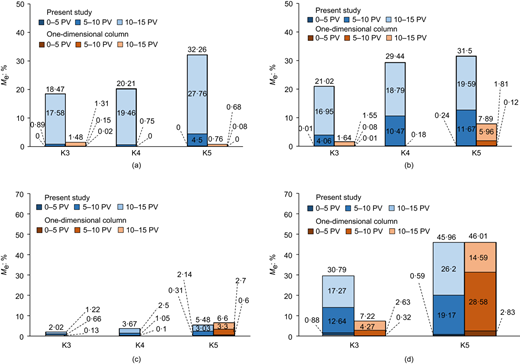
As seen in Fig. 12, the total Me values (Me values from 0 to 15 PVs) were in the order of K3 < K4 < K5 for all experimental conditions in this study, which indicates a higher susceptibility of suffusion as the SR becomes lower. In addition, the order of Me values as Me (0–5 PVs) < Me (5–10 PVs) < Me (10–15 PVs) implies the most significant suffusion of sand–clay mixtures at low IC. Notably, even lower total Me values for one-dimensional flow than two-dimensional flow were observed for kaolinite (Fig. 12(a)) and illite (Fig. 12(b)). Because the two-dimensional flow may be more valid to simulate large-scale earthen structures than the one-dimensional flow, the suffusion of sand–clay mixtures can be underestimated using the soil-column experiment for non-swelling clay.
For sand–bentonite mixtures (Figs 12(c) and 12(d)), the underestimation of filtrated bentonite was observed only for K3–1% bentonite mixture whereas the relatively similar total Me values between the two experimental conditions were observed for K5–1% bentonite and K5–3% bentonite mixtures. Therefore, underestimated suffusion through one-dimensional soil-column experiments can be anticipated for swelling clay, particularly at high SR. The experimental cases shown in Fig. 12 are limited to interaction energy energy-induced suffusion, further investigation would be required for the dimensional effect on hydraulic-induced suffusion (i.e. critical hydraulic gradient at given solution chemistry) for sand–clay mixtures.
The higher susceptibility to suffusion for the two-dimensional than the one-dimensional flow can be attributed to the impact of gravity on detached clay particles. The detached clay particles are subjected to horizontal and vertical movement under two-dimensional flow, which may lead to a higher chance of detached clay particles filtrated out of the cell (or column for one-dimensional experiments) for the two-dimensional than the one-dimensional flow. As the cross-sectional area for detached clay particles to filtrate out is higher under two-dimensional than under one-dimensional flow, a higher number of flow paths in the sand matrix for detached clay particles can be anticipated under the two-dimensional flow than when the flow is one-dimensional. This combined effect of gravity and the number of flow paths led to the minimisation of the reattachment effect and substantial suffusion of sand–clay mixtures for two-dimensional flow, as shown in Fig. 12.
CONCLUSIONS
This study investigated interaction energy-induced suffusion of sand–clay mixtures through laboratory-scale two-dimensional flow cell. Three types of sand and clay were selected to investigate the gravity and reattachment effects as a function of clay mineralogy and SR. Based on the observed BTCs and PSDs at the outlets and retained clay, the following conclusions can be drawn.
The volume fraction of injected water at three outlets for kaolinite– and illite–sand mixtures and the retained quantity after injection implies that there is a significant gravitational effect of detached clay particles during their transport at high SR, whereas less gravitational effect can be anticipated at low SR.
The volume fraction of injected water for kaolinite– and illite–sand mixtures suggests a threshold SR of ∼96 where the gravity effect on the detached clay particles becomes substantial.
The fraction of filtrated clay obtained from the observed BTCs indicates the susceptibility to suffusion observed in this study was in the order of illite > kaolinite > bentonite.
Even higher Me(middle) and Me(bottom) than Me(top) for kaolinite and illite and higher Me(top) than Me(middle) and Me(bottom) for bentonite clearly suggests the importance of swelling potential in assessing the suffusion of sand–clay mixtures.
The median size of clay particles at the outlets (d50(outlet)) for kaolinite and illite was lower than the d50 of PSDs, whereas a reverse trend was observed (d50(outlet) < d50) for bentonite.
Right-skewed and normally distributed PSDs at the outlets were observed for kaolinite and illite, whereas left-skewed PSDs were observed at the outlet for bentonite. This suggests the discrepancy of suffusion mechanisms as a function of clay type.
The total Me values (Me values from 0 to 15 PVs) were in the order of K3 < K4 < K5 for all types of clay in this study, which indicates a higher susceptibility of interaction energy-induced suffusion as the SR becomes lower.
The lower total Me values from the one-dimensional soil-column experiment than those observed in this study suggest that the suffusion of sand–clay mixtures can be underestimated using soil-column experiments.
ACKNOWLEDGEMENTS
This study was supported by National Research Foundation of Korea (NRF) grants funded by the Korean government (MSIT) (nos. 2022R1C1C1007296 and RS-2023-00221719).
REFERENCES
Discussion on this paper closes 1 May 2026; for further details see p. ii.