


The dry fringe that appears beneath a footprint on a beach is a visual manifestation of dilation. Dilation causes the sand to attempt to increase in volume on shearing, resulting in negative pore pressure and enhanced bearing capacity. Conventional theory cannot explain this increase in strength, suggesting instead that bearing capacity with the phreatic surface at the sand surface should be approximately half that of the dry case. To explore this apparent contradiction, ten load-controlled bearing capacity experiments were performed on transparent soil with phreatic surfaces ranging from 100 mm below to 30 mm above the footing. For phreatic surfaces deeper than the footing width, failure occurred within the dry material. In shallower phreatic surface conditions, bearing capacity increased as the phreatic surface approached the surface. Air entry was observed to initiate along the top surface of the saturated layer and extend to the depth of the bearing capacity mechanism. For the case of the phreatic and soil surfaces being coincident, the bearing capacity was observed to be more than double that of the dry case. In submerged cases bearing capacity was less than values at the surface, as there was no air–fluid interface to enhance the development of negative pore pressure.
INTRODUCTION
Every beachgoer quickly discovers where to walk on a beach. If a path is chosen too high up the beach, the sand is dry, and foot pressure results in large and tiring settlements associated with bearing capacity failure. Attempts to walk too low on the beach on submerged sand in shallow water are often met with similar outcomes. However, in the swash zone, the saturated sand somehow avoids bearing capacity failure, with sufficiently small settlements to leave only shallow footprints. When walking in this Goldilocks zone, one often sees a ‘dry’ fringe appear as foot pressure is applied (Fig. 1). As recognised by Osborne Reynolds at the end of the nineteenth century, this is a visual manifestation of dilation. In the words of Reynolds (1885: p. 475)
A well-marked phenomenon receives its explanation at once from the existence of dilatancy in sand. When the falling tide leaves the sand firm, as the foot falls on it the sand whitens, or appears momentarily to dry round the foot. When this happens the sand is full of water, the surface of which is kept up to that of the sand by capillary attraction; the pressure of the foot causing dilation of the sand, more water is required, which has to be obtained either by depressing the level of the surface against the capillary attraction, or by drawing water through the interstices of the surrounding sand. This latter requires time to accomplish, so that for the moment the capillary forces are overcome; the surface of the water is lowered below that of the sand, leaving the latter white or dryer until a sufficient supply has been obtained from below, when the surface rises and wets the sand again.
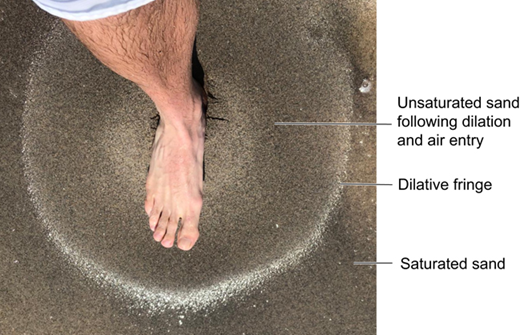
Footprint on a beach with water table at the surface displaying unsaturated sand surrounding the heel followed radially by a dilative fringe and saturated sand
Footprint on a beach with water table at the surface displaying unsaturated sand surrounding the heel followed radially by a dilative fringe and saturated sand
In the explanation of Reynolds, the key aspects of the phenomena are distilled to (a) the imposition of shear stress on a densely packed granular assembly causes the soil to attempt to increase in volume as grains rearrange on shearing, and because (b) foot pressure is a rapid loading event, (c) air entry as a result of dilation-induced negative water pressures is a key aspect of the failure process.
The bearing capacity of footings is one of the classical problems of geotechnical engineering. However, when turning to geotechnical textbooks for a quantitative explanation for the increase in bearing capacity on saturated sand witnessed in the footprints on the beach problem, acceptable answers are not forthcoming. Bearing capacity is defined as the maximum stress on a footing at plastic collapse, and for dry sands, can be predicted well using Terzaghi's bearing capacity theory. In standard textbook solutions, capillarity effects on the soil are ignored and the effect of the water table is simply taken to reduce the unit weight to the effective unit weight in the calculations. Such an approach would predict that the bearing capacity for the case of the water table at the soil surface would be nearly half that of the bearing capacity of dry soil. Such an outcome is clearly wrong as it is inconsistent with the lived experience of anyone who has walked on a beach.
Despite being a physics phenomenon that is almost universally experienced by every beachgoer, the geotechnical engineering community currently does not have satisfactory answers to questions such as: ‘What does the failure mechanism look like?’; ‘Is it the same as that observed in dry materials?’; ‘When does air entry begin?’; ‘How deep does the air penetrate at the point of instability?’; and, perhaps most important for foot traffic, how much additional bearing pressure is required to initiate plastic collapse.
Recent advances in transparent soil may provide an intriguing opportunity to explore the answers to these questions in the laboratory. Transparent soil is an optically matched granular material and fluid (i.e. same refractive index) that is visually transparent when saturated and opaque when dry. It is therefore perfectly suited for capturing processes in which air entry plays a role, as bubbles and interconnected air-filled pores are inherently visible. If a bearing capacity experiment were to be performed on such a material within a glass enclosure, the behaviour of soil in a vertical profile under a footing could reveal the deformation vectors of the failure mechanism, and the timing of the onset and transient depth of air entry into the soil, as a first step to begin to answer these questions.
The objective of this paper is to capture visually the fundamental mechanism of bearing capacity of footprints on the beach using experiments on transparent sand to identify the role and depth of dilation-induced air entry. In the remainder of this paper, the authors begin by describing the conventional wisdom accounting for water table position and degree of saturation in current bearing capacity theory. They then describe the development of a transparent soil bearing capacity apparatus and show typical bearing capacity mechanisms for conditions ranging from completely dry to saturated to submerged conditions. These results are then discussed in the context of the footprints on the beach problem, before extending the implications for the behaviour of footings in a broader range of geotechnical applications.
BACKGROUND
In the conventional analysis of shallow foundations, the bearing capacity of a soil is a function of the cohesive or frictional strength of the underlying soil, as well as the effect of surcharge. Following Terzaghi (1943) the bearing capacity, qu for a shallow footing of infinite length (i.e. strip foundation) on the soil surface can be calculated as
where the cohesion effects are incorporated into the first term (c, soil cohesion; Nc, bearing capacity factor for cohesion), frictional effects into the second term (B, foundation width; γ, unit weight of the underlying soil; Nγ, bearing capacity factor for frictional resistance) and the third term accounts for surcharge effects (q, surcharge stress adjacent to the foundation; Nq, bearing capacity factor for surcharge). For the bearing capacity of sands at the soil surface the cohesive term and surcharge terms do not apply, leaving bearing capacity to be entirely determined by the Nγ frictional term.
Groundwater table considerations in conventional geotechnical bearing capacity analysis of foundations is limited to its effect on the unit weight of the soil. Figure 2(a) displays a surficial foundation placed on a coarse-grained soil (c′ = 0) with the groundwater table located at depth dw. In this coordinate system, positive values of dw represent depths below the soil surface, while negative values of dw represent submerged conditions. The applicable form of the bearing capacity equation is shown, which only requires the frictional term. Figure 2(b) schematically shows groundwater table effects on the bearing capacity. For a groundwater table deeper than the footing width (dw > B) the total unit weight, γ, is used in the bearing capacity prediction. At the other extent, analysis of a submerged foundation would utilise the effective unit weight, γ′. Between these two cases, the average unit weight within depth B is incorporated. Hence, bearing capacity decreases linearly as the ratio of depth to groundwater table to foundation width decreases from 1 to 0. For soils with unit weight of approximately 20 kN/m3 the ultimate bearing capacity for a footing on the surface of saturated soil is predicted to be half of the dry counterpart, inconsistent with observations of footprints on the beach.
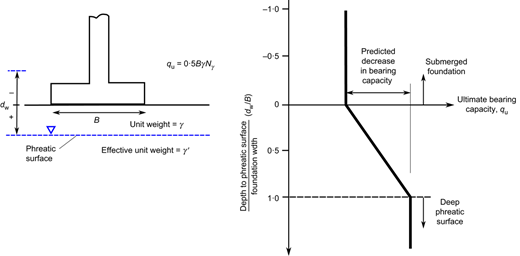
Conventional surficial footing analysis for ultimate bearing capacity (qu): (a) schematic defining equation inputs and (b) effect of phreatic surface depth normalised to foundation width, dw/B on ultimate bearing capacity
Conventional surficial footing analysis for ultimate bearing capacity (qu): (a) schematic defining equation inputs and (b) effect of phreatic surface depth normalised to foundation width, dw/B on ultimate bearing capacity
The apparent mismatch between prediction and observation may be the result of conventional analysis not accounting for rate effects in the frictional term. In current textbooks, loading rate effects for foundation design are only considered for fine-grained soils, in which bearing capacity for rapid undrained loading is calculated using the cohesive term, while bearing capacity for slow loading is calculated using the frictional term and drained strength parameters. The process of air entry described by Reynolds (1885), however, illustrates that despite the sand not being a fine-grained material, bearing capacity of a saturated sand under foot loading is inherently a rate-dependent problem that is not yet well described in the literature.
While capillary effects have been explored in the context of bearing capacity of unsaturated sands in recent years, these studies have focused on the case of slow loading rates. Different approaches have been used to capture saturation effects in revised bearing capacity calculations. Most researchers look to modify the cohesive term of the bearing capacity equation (Vanapalli & Mohamed, 2007; Oh & Vanapalli, 2011; Vahedifard & Robinson, 2016; Tang et al., 2017), some also modify the frictional term (Evans & Baker, 2021), and others incorporate an effective stress approach into slip-line theory (Tang et al., 2018). Experiments carried out on granular materials to develop these models perform displacement rate-controlled tests at very slow loading rates ranging from 0·12 to 2·5 mm/min (Mohamed & Vanapalli, 2006; Vanapalli & Mohamed, 2013; Wutke et al., 2013; Tang et al., 2018; Maghvan et al., 2019) to ensure results are rate independent. Paprocki et al. (2023) performed a field study to measure the bearing capacity of sandy coastal soils using a portable free-fall penetrometer and found the highest values in the swash zone relative to the intertidal and subaerial (i.e. drier) zones. They corrected bearing capacity measurements for strain rate effects and applied the Vanapalli & Mohamed (2007) approach for interpreting the results. Whether using an apparent cohesion (Vanapalli et al., 1996) or an effective stress approach (Khalili & Khabbaz, 1998), all unsaturated bearing capacity equations are unified in that they agree with the Terzaghi equation for the bounding cases of a deep water table and water table at the footing depth. Laboratory results show that the lowest bearing capacity is measured for 0 kPa suction or water table at the surface. Thus, current unsaturated bearing capacity equations and experimental investigations are accounting for different mechanisms than the footprints on the beach problem.
MATERIALS AND METHODS
The observation of the bearing capacity failure mechanism capturing the spatial and temporal evolution of air entry within a vertical profile under a footing requires a footing load test to be performed on transparent soil contained in a strongbox with transparent sidewalls. Given that the particle size of the transparent soil was intended to represent sand, the transparent soil developed by Ezzein & Bathurst (2011) was selected for the present study. Dry transparent soil (0% degree of saturation) appears white due to light refracting off the sand grains. At 100% saturation, the refractive index-matched soil–fluid combination is transparent. Figure 3 displays the particle size distribution and retention curve of the coarse gradation transparent soil used in the experiments. Pore fluid and geotechnical properties are available in Table 1. The soil component is composed of fused quartz with mean grain size d50 = 1·7 mm, while the fluid component is a mineral oil mixture. Ezzein & Bathurst (2011) reported relatively consistent frictional properties for dry sand, as well as water- and oil-saturated sand. Differences between mineral oil pore fluid and water (both listed in Table 1) include higher viscosity as well as lower density and surface tension. Unsaturated hydraulic properties for both water and oil, confirming scalability using fluid index properties, are reported in Sills et al. (2017). The retention curve (Fig. 3(b)) has an air-entry value of between 0·11 and 0·22 kPa and a residual saturation achieved at 0·37–0·45 kPa suction, which is consistent with uniform sandy soils. This transparent soil has been successfully incorporated into infiltration and drainage experiments in uniform and layered column and two-dimensional systems (Peters et al., 2011; Siemens et al., 2013, 2014, 2021), as well as granular collapse experiments that noted the importance of air entry in the stability of granular columns (Taylor-Noonan et al., 2021).
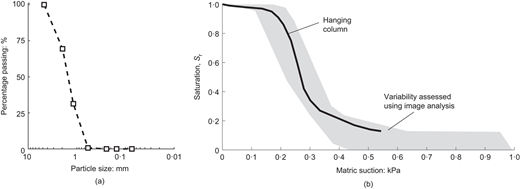
Transparent soil properties: (a) particle size curve (data from Peters et al. (2011)) and (b) retention curve defining relationship between degree of saturation, Sr, and matric suction obtained from hanging column and image analysis (data from Sills et al. (2017))
Transparent soil properties: (a) particle size curve (data from Peters et al. (2011)) and (b) retention curve defining relationship between degree of saturation, Sr, and matric suction obtained from hanging column and image analysis (data from Sills et al. (2017))
Transparent soil, oil mixture and water properties
| Parameter | Coarse transparent soil | Oil mixture | Water |
|---|---|---|---|
| Refractive index | 1·459* | 1·459* | 1·000† |
| Specific gravity | 2·24‡ | 0·845* | 1·00† |
| Particle size distribution | |||
| D10: mm | 0·75* | — | — |
| D30: mm | 1·16* | — | — |
| D60: mm | 1·75* | — | — |
| Minimum dry density: g/cm3 | 1·05* | — | — |
| Maximum dry density: g/cm3 | 1·31‡ | — | — |
| Dynamic viscosity (at 25°C): Pa s | — | 0·0101* | 0·00089† |
| Dynamic viscosity (at 30°C): Pa s | — | 0·0084* | 0·00080† |
| Surface tension (at 25°C): N/m | — | 0·0265* | 0·072† |
| Contact angle on fused quartz: degrees | — | 0* | 0§ |
Footing experiments were conducted in an aluminium strongbox 89 cm long, 30·5 cm high and 20·5 cm wide. Two 1·5 cm thick tempered glass sidewalls, one on each side of the tank, permit the observation of soil behaviour during loading (Fig. 4(a)). The footing placed on top of the transparent soil surface consists of a 2·5 cm thick aluminium plate, 5 cm wide and 20 cm long. The footing was orientated with the 5 cm width visible in the window to represent a footing brought to failure under plane-strain conditions (i.e. a strip foundation). To enhance the visualisation of failure, the exterior face of the back glass sidewall was painted black. This arrangement ensures that a camera viewing the front of the chamber will return an image of the black background if viewed through transparent soil. This strategy ensures high contrast of air entry, as the air bubbles will appear white on the black background of saturated transparent soil. Images (1280 × 800 pixels) of the vertical soil profile under the footing were captured at 500 frames/s using an ultra-high-speed camera (Phantom v2512) (Fig. 4(b)). Two light-emitting diode (LED) light sources designed for high-speed photography illuminated the scene, permitting the use of a 20 μs exposure time.
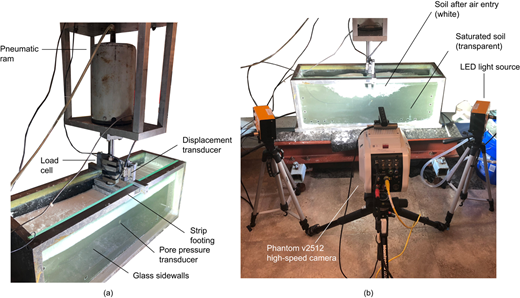
Photographs of footing experiment set-up displaying: (a) aluminium strongbox and vertical loading frame; (b) high-speed camera and lighting
Photographs of footing experiment set-up displaying: (a) aluminium strongbox and vertical loading frame; (b) high-speed camera and lighting
The primary variable in the shallow foundation tests is the depth to the phreatic surface, ranging from 100 mm below the foundation at the ground surface to 20 mm above the ground surface. Careful placement of the transparent soil was required to minimise the presence of air bubbles prior to foundation loading. To prepare a fully saturated transparent soil layer, the tank was initially filled with the optically matched pore fluid. The soil was then placed using a scoop through the fluid. Any residual air bubbles were then removed from the system by way of raking of the submerged granular layer until the layer was completely transparent. Once the desired height of each lift (100 mm each) was achieved, the oil level was reduced to permit soil compaction by systematic and uniform application of a tamper. This procedure continued until the final height of the saturated layer was achieved. For tests in which the phreatic surface is at depth, dry soil was then placed on top of the saturated layer in lifts and compacted. Once the elevation of the ground surface was reached, the footing was carefully placed on the surface using a bubble level to ensure the footing was level and the knife-edge of the loading ram was placed at the centre-line of the footing.
Given that foot pressure is applied rapidly, the footing experiment was conducted in load control rather than displacement control to permit the plastic collapse of the footing to be captured. Load was applied to the footing by a pneumatic ram, with a motorised pressure regulator to impose a constant loading rate of 1·68 kg/s (0·165 kPa/s of bearing pressure). The applied load was verified by a load cell placed immediately above the footing. Settlement of the footing was recorded by two linear voltage displacement transducers, one on each side of the footing, attached to the top of the strong box. To limit the depth of penetration of the footing at plastic collapse and resulting risk of damage to the transparent strongbox, the pneumatic ram was set with 2·5 cm of travel until its maximum stroke. Dilation-induced negative pore pressures during plastic collapse were measured using a PDCR 81 pore pressure transducer located below the anticipated failure zone, approximately 140 mm (greater than 2·5 times the footing width) below the surface. The location of the sensor is intended to provide a characteristic value of pore pressure at the bottom of the Prandtl-style failure mechanism to enable comparisons between test configurations, mindful that pore pressure transducer placement at higher elevations may accidentally reinforce the shear zone and influence bearing capacity.
RESULTS
Ten footing experiments were conducted with the phreatic surface depth ranging from 100 mm below the foundation at the ground surface to 30 mm above the footing (Table 2). Any experiment in which significant tilting or eccentricity of the footing developed prior to peak load (differential settlement > 0·04B or eccentricity > 0·03B) was discarded and the test was repeated to ensure test comparisons presented in this paper focused on symmetrical bearing capacity in the absence of inclination or eccentricity effects. The raw applied pressure and displacement data are presented in Fig. 5, with individual experiments identified with markers placed at the onset and completion of plastic collapse to permit identification. As each test was conducted in load control, the applied pressure increased linearly with time until plastic collapse, at which point the applied pressure temporarily dropped due to the rapid penetration of the footing into the ground (Fig. 5(a)). At this point the pneumatic regulator was switched off and the test concluded. The resulting applied pressure–settlement response of the footings are shown in Fig. 5(b). Given that the test was performed in load control, increments of temporary instability and densification were observed prior to the final plastic collapse. The bearing capacity, defined as the stress at plastic collapse, can be identified in each test as the highest stress achieved before uncontrolled penetration into the ground. These data clearly indicate that the case in which the phreatic surface is at the soil surface achieved the highest bearing capacity, consistent with the footprints on the beach problem. In the following sections, the failure mechanism leading to this effect will be explored in full detail. Videos of the plastic collapse in each experiment are included as online supplementary material and in the data repository referenced at the end of the paper.
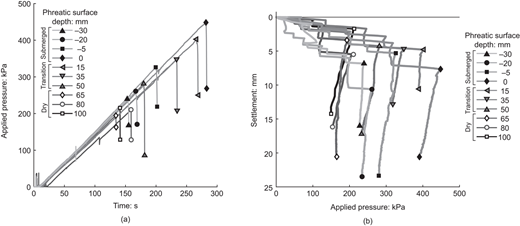
Footing experiment summary: (a) applied pressure plotted against time showing consistent rate of increase prior to plastic collapse and (b) settlement plotted against applied pressure showing temporary instability increments and plastic collapse
Footing experiment summary: (a) applied pressure plotted against time showing consistent rate of increase prior to plastic collapse and (b) settlement plotted against applied pressure showing temporary instability increments and plastic collapse
Test summary
| Test number | Failure location | Depth of phreatic surface | Bearing capacity: kPa | |
|---|---|---|---|---|
| dw: mm | dw/B | |||
| 1 | Dry | 100 | 2·0 | 214 |
| 2 | 80 | 1·6 | 210 | |
| 3 | 65 | 1·3 | 195 | |
| 4 | Transition | 50 | 1·0 | 281 |
| 5 | 35 | 0·7 | 348 | |
| 6 | 15 | 0·3 | 402 | |
| 7 | Saturated | 0 | 0·0 | 448 |
| 8 | −5 | −0·1 | 325 | |
| 9 | −20 | −0·4 | 260 | |
| 10* | −30 | −0·6 | 239 | |
*No images available due to camera malfunction.
The failure mechanism for bearing capacity failure in dry sand is described visually in Fig. 6 using images every 0·02 s during plastic collapse for the case of dw = 80 mm (dw/B = 1·6). In these images, the dry soil is opaque and is optically white in the image. The saturated soil at a depth of 80 mm is optically transparent, permitting the black background to be observed through the width of the transparent soil layer. The edge of the 50 mm wide aluminium footing is shown on the soil surface with load applied using a knife edge. Incremental displacement vectors calculated using digital image correlation between these frames are shown as green vectors to indicate the direction and relative magnitude of velocity of the collapse mechanism. These vectors indicate that the plastic collapse is contained within the dry layer and is visually consistent with the Prandtl style mechanism of failure assumed in bearing capacity theory. Failure is very rapid, with the entire process from initiation of plastic collapse to arrest at the end of the stroke of the pneumatic ram lasting less than 0·14 s.
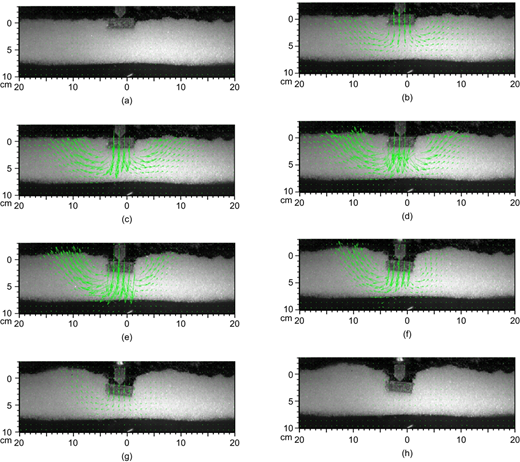
Typical test on dry transparent soil – test 2 with phreatic surface at dw = 80 mm – time series of images with particle image velocimetry (PIV) vectors showing failure mechanism consistent with Prandtl style assumed in conventional bearing capacity analysis: (a) 0·00 s; (b) 0·02 s; (c) 0·04 s; (d) 0·06 s; (e) 0·08 s; (f) 0·10 s; (g) 0·12 s; (h) 0·14 s
Typical test on dry transparent soil – test 2 with phreatic surface at dw = 80 mm – time series of images with particle image velocimetry (PIV) vectors showing failure mechanism consistent with Prandtl style assumed in conventional bearing capacity analysis: (a) 0·00 s; (b) 0·02 s; (c) 0·04 s; (d) 0·06 s; (e) 0·08 s; (f) 0·10 s; (g) 0·12 s; (h) 0·14 s
The failure mechanism for the case of the phreatic surface at the soil surface (dw = 0 mm) is dramatically more complex due to pore pressure effects. The failure mechanism for this case is described visually in Fig. 7 using images every 0·2 s during plastic collapse. Once again, the footing is at the soil surface at the top of the image, but this time the soil layer is entirely transparent save for a thin layer of dry material a few grains thick on the ground surface. During plastic collapse, air entry begins localised to the base of the footing, highlighting shear bands in which dilation is occurring. As plastic collapse continues, unstable fingered air entry is drawn in from the soil surface within the area bounded by the soil experiencing shearing within the bearing capacity mechanism. Failure is an order of magnitude slower than the dry case, with the entire process of initiation of plastic collapse to arrest at the end of the stroke of the pneumatic ram lasting approximately 2·2 s.
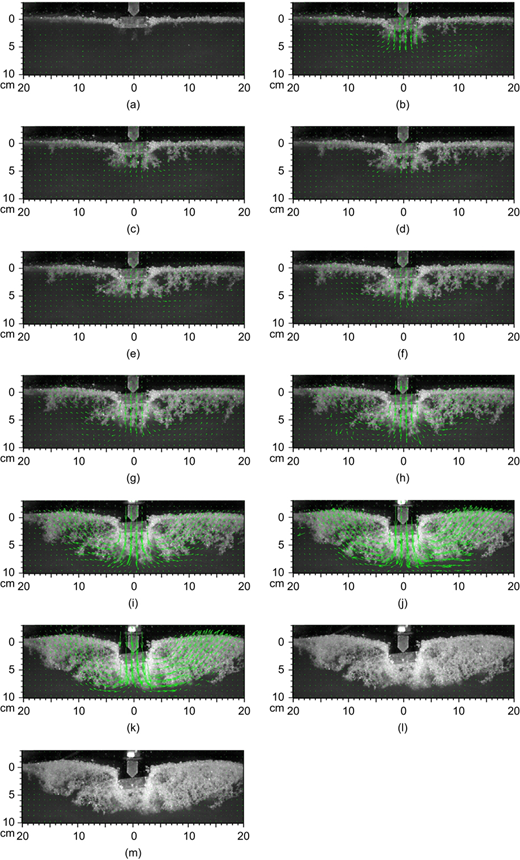
Typical test on saturated transparent soil – test 7 with phreatic surface at dw = 0 – time series of images with PIV vectors showing unstable air entry coincidental with shear bands developing during plastic collapse: (a) 0·0 s; (b) 0·2 s; (c) 0·4 s; (d) 0·6 s; (e) 0·8 s; (f) 1·0 s; (g) 1·2 s; (h) 1·4 s; (i) 1·6 s; (j) 1·8 s; (k) 2·0 s; (l) 2·2 s
Typical test on saturated transparent soil – test 7 with phreatic surface at dw = 0 – time series of images with PIV vectors showing unstable air entry coincidental with shear bands developing during plastic collapse: (a) 0·0 s; (b) 0·2 s; (c) 0·4 s; (d) 0·6 s; (e) 0·8 s; (f) 1·0 s; (g) 1·2 s; (h) 1·4 s; (i) 1·6 s; (j) 1·8 s; (k) 2·0 s; (l) 2·2 s
Images capturing the failure mechanism for nine experiments, for which images are available, are shown immediately prior to plastic collapse, at peak applied pressure, and at the end of plastic collapse in Figs 8–10. Deep phreatic surface cases are shown in Fig. 8. In these cases, the phreatic surface is at a depth greater than the footing width B, and the failure mechanism is entirely in the dry material with little to no air entering the saturated layer for depths greater than 80 mm. In the 65 mm experiment, a small zone of air entry is seen immediately under the footing, indicating that some shearing of the saturated layer is occurring during collapse.
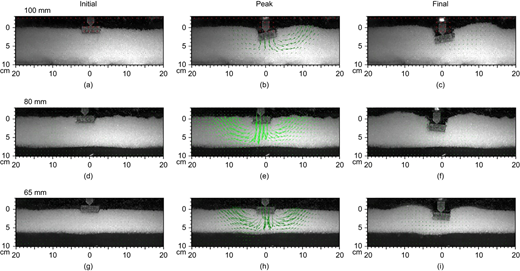
Test summary photographs for dw/B > 1 that show failure primarily in dry upper layer for: (a)–(c) test 1 – dw = 100 mm; (d)–(f) test 2 – dw = 80 mm; and (g)–(i) test 3 – dw = 65 mm
Test summary photographs for dw/B > 1 that show failure primarily in dry upper layer for: (a)–(c) test 1 – dw = 100 mm; (d)–(f) test 2 – dw = 80 mm; and (g)–(i) test 3 – dw = 65 mm
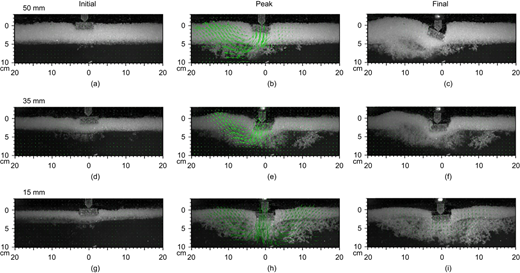
Test summary photographs for 0 < dw/B < 1 that show failure transitioning from dry soil into the saturated zone for: (a)–(c) test 4 – dw = 50 mm; (d)–(f) test 5 – dw = 35 mm; and (g)–(i) test 6 – dw = 15 mm
Test summary photographs for 0 < dw/B < 1 that show failure transitioning from dry soil into the saturated zone for: (a)–(c) test 4 – dw = 50 mm; (d)–(f) test 5 – dw = 35 mm; and (g)–(i) test 6 – dw = 15 mm
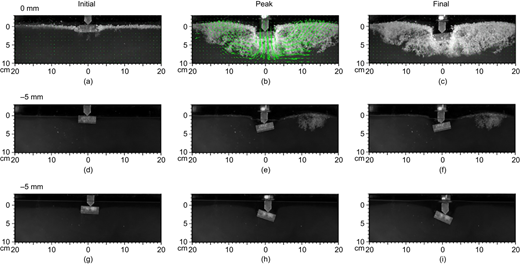
Test summary photographs for dw/B ≤ 0 that show failure transitioning from capillarity limited air entry to the saturated zone for: (a)–(c) test 7 – dw = 0 mm; (d)–(f) test 8 – dw = −5 mm; and (g)–(i) test 9 – dw = −20 mm (note: no images available for test 10 due to camera malfunction)
Test summary photographs for dw/B ≤ 0 that show failure transitioning from capillarity limited air entry to the saturated zone for: (a)–(c) test 7 – dw = 0 mm; (d)–(f) test 8 – dw = −5 mm; and (g)–(i) test 9 – dw = −20 mm (note: no images available for test 10 due to camera malfunction)
Shallow phreatic surface cases (0 < dw < B) are shown in Fig. 9. In each case, plastic collapse is signalled by unstable air entry into the saturated layer, extending throughout the soil profile bounded by the zone of soil shearing in the bearing capacity mechanism. As the depth of the bearing capacity mechanism is consistent between these tests (i.e. extending to a depth of approximately 2B), tests with shallow phreatic surface inherently shear a larger volume of saturated soil capable of generating sufficient suctions on dilation to initiate air entry.
The submerged cases are shown in Fig. 10 along with the case of the phreatic surface on the soil surface for context. Owing to the transparent nature of the material, there is no texture to utilise digital image correlation in saturated transparent soil. Thus velocity vectors are only available for tests with significant air entry. For the submerged cases, the dilation of soil within the shearing soil bounded by the bearing capacity mechanism is able to draw in fluid into the pore space during collapse. For the case of shallow submergence (5 mm), the depth of submergence is sufficiently small that the heave of the ground surface on the side of the footing exposed the material to the soil surface. Air entry was then observed to occur in this region of soil freshly exposed to air. For greater depths of submergence (e.g. 20 mm), the magnitude of heave was not sufficient to reach the elevation of the fluid free surface.
DISCUSSION
Figure 11(a) plots the ultimate bearing capacity against the ratio of phreatic surface depth normalised to footing width. Tests with depth of phreatic surface greater than the footing width (dw/B > 1) show consistent bearing capacity with no influence since the failure surfaces for these tests occurred in dry soil (Fig. 8). For phreatic surface depths less than B (0 < dw/B < 1) bearing capacity increases, reaching more than twice the dry counterpart value at dw/B = 0. Submergence of the foundation (dw < 0) eliminates capillarity effects to impede negative pore pressure dissipation during plastic collapse and bearing capacity similarly decreases with further submergence (unless adjacent mounding ground meets the free surface). Figure 11(b) plots the maximum change in pore pressure during plastic collapse observed at a depth of 140 mm (2·5B) below the original ground surface. For tests showing no excess pore pressure response, no additional bearing capacity was recorded. For tests with 0 < dw/B < 1, dilative pore pressures are observed up to a maximum change of −0·35 kPa for the phreatic and ground surface being coincidental (dw/B = 0).
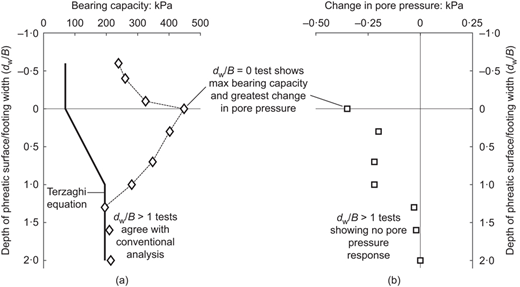
(a) Bearing capacity of the footprints test results against depth of phreatic surface normalised to footing width dw/B compared to conventional analysis and (b) change in pore pressure during plastic collapse
(a) Bearing capacity of the footprints test results against depth of phreatic surface normalised to footing width dw/B compared to conventional analysis and (b) change in pore pressure during plastic collapse
Conventional analysis of a surficial footing placed on sand includes only the frictional component of the bearing capacity equation with a resulting decrease in bearing capacity associated with reduction of the effective unit weight within the depth of influence. A representative plot of conventional ultimate bearing capacity (denoted as the Terzaghi equation) is also included in Fig. 11(a), showing that for the coarse transparent soil with dry unit weight of 12·8 kN/m3 and submerged unit weight of 4·6 kN/m3, in which Nγ has been back-calculated to match bearing capacity observed in deep phreatic surface tests. This conventional analysis predicts bearing capacity for the case of the phreatic surface at the surface to be one-third the value of the deep phreatic surface tests rather than the normal half, due to its low unit weight. Current unsaturated bearing capacity formulations modify the Terzaghi equation to account for capillarity effects through either a contribution to bearing capacity by way of effective stress (i.e. the Nγ term) or a contribution to cohesive strength (i.e. the Nc term). While these differing approaches are used to account for degree of saturation and suction influences, unsaturated bearing capacity equations are conceptually unified to agree with conventional analysis for the bounding cases of saturated and dry ground (0 kPa suction and 0% saturation, respectively). Clearly the footprints on the beach results are unable to be captured by either current conventional or unsaturated bearing capacity models. Unsaturated bearing capacity research is aimed at a separate application from footprints on the beach. Laboratory testing for development of such models often intentionally avoids excess pore pressure development through use of displacement-controlled testing at slow loading rates (Mohamed & Vanapalli, 2006; Vanapalli & Mohamed, 2013; Wutke et al., 2013; Tang et al., 2018; Maghvan et al., 2019). Capillarity effects are properly captured through these testing protocols and incorporated in constitutive and numerical models, while coupled transient hydraulic–mechanical mechanisms are outside their domain.
Although not accounted for explicitly, the conventional foundation equation still offers some insight into the relative increase in effective stress to account for the two-times increase in bearing capacity for the phreatic surface at the ground surface as opposed to at depth. Analysis of the deep phreatic surface tests provides the opportunity to calibrate the simplified version of the bearing capacity equation with only the frictional term (qu = 0·5BγNγ). Setting bearing capacity equal to the measured values of 195 kPa (bearing capacity of test #3), the associated Nγ is 608. Using this Nγ value and analysing the remaining laboratory tests shows that a mere 0·6 kPa of effective stress is needed to provide the measured increase in bearing capacity. For the submerged tests with no air-entry effects, the additional effective stress required is just 0·3–0·4 kPa. Peak transient pore pressures measured well below the failure mechanism (Fig. 11(b)) are consistent with this magnitude of pore pressure change.
Observations of air entry and fluid flow during plastic collapse indicate that the bearing capacity of saturated materials is inherently a complex coupled multiphase load–deformation–flow problem. To illustrate this point, the velocity of plastic collapse is explored in Fig. 12. Deep phreatic surface cases (dw > 1·5B) fail rapidly as the failure mechanism is entirely within granular material with air as the pore fluid. The failure in submerged cases is much slower than in the dry cases because the sheared soil induces negative pore pressures, which temporarily enhance bearing capacity until atmospheric air can be drawn in and suction dissipates.
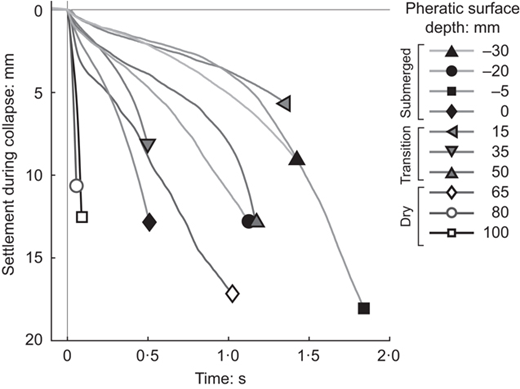
Settlement plotted against time during plastic collapse showing transient nature of failure event
Settlement plotted against time during plastic collapse showing transient nature of failure event
CONCLUSIONS
Despite being a physical phenomenon that is almost universally experienced by every beachgoer, the geotechnical engineering community currently does not have satisfactory answers to explain quantitatively the increase in bearing capacity associated with footprints on saturated sand. As a first step, load-controlled bearing capacity tests were performed on transparent optically matched sand to visually capture the fundamental mechanism of bearing capacity in sands with different phreatic surface depths ranging from deep (failure entirely in dry sand) to submerged conditions. This experimental approach has, for the first time, enabled the visualisation of the subsurface mechanism of dilation-induced air entry and corresponding increase in bearing capacity in saturated granular materials. These novel experimental observations of the classical bearing capacity problem have led to the following conclusions.
For phreatic surface locations deeper than B, bearing capacity failure was observed to take place entirely within the dry material following a Prandtl style failure mechanism, with bearing capacity values consistent with Terzaghi bearing capacity theory.
For shallow phreatic surface locations, defined herein as 0 < dw < B, the bearing capacity increased with decreasing dw. Dilation-induced air entry was observed to initiate along the top surface of the saturated layer and extend to the depth of the bearing capacity mechanism. For the extreme case of the phreatic surface at the soil surface (dw = 0), the bearing capacity was observed to be double that of the dry case. Little to no air entry occurred before the final plastic collapse. At plastic collapse, air entry initiated at the top of the saturated layer and extended the full depth of the bearing capacity mechanism. The air-entry pressure of the material can therefore be taken as representing a limiting or maximum negative pore fluid pressure generated by dilative behaviour prior to collapse.
Submerged conditions in which the phreatic surface was located above the footing elevation achieved lower bearing capacity than saturated conditions, but higher than the fully dry case. In submerged cases there is no air–fluid interface to enhance the development of negative fluid pressures due to dilative behaviour, but rather, a supply of fluid at the free surface. The bearing capacity achieved for these cases is therefore a complex coupled transient flow problem and they are therefore expected to be rate dependent.
These experiments provide a tangible explanation of the increased bearing capacity associated with the footprints on the beach problem. In saturated conditions, the air–fluid interface at the soil surface enhances the development of negative fluid pressures due to dilative behaviour. As these negative fluid pressures grow with applied pressure, they eventually exceed the air-entry pressure of the soil matrix, leading to air entry and plastic collapse.
The phenomenon of dilation under loading is present in both the dry experiments and saturated experiments. In dense dry materials, the effect of dilation is limited to only an increase peak friction angle. However, in dense saturated materials, the effect of dilation is more pronounced as it leads to negative fluid pressures, increased normal effective stresses, and increased frictional resistance against bearing capacity failure. The observation that the air-entry pressure of the material can be taken as representing a limiting or maximum negative pore fluid pressure generated by dilative behaviour prior to collapse yields a promising new lead for the development of new predictive equations for bearing capacity incorporating the air-entry value either implicitly or through correlations to d50. Such an approach has recently been undertaken by Taylor-Noonan et al. (2021) to explain the grain size effect of collapse of dense saturated granular columns. This related work found that capping the contribution of dilation-induced stress at the air-entry value was a good first-order approximation for the calculation of stability of granular columns. Any similarly extended theory for saturated bearing capacity would require an extensive database of experimental data of saturated bearing capacity of soils of differing air-entry values (i.e. grain size) and stress levels for validation. Footprints on the beach is an inherently a low-stress-level problem. To extend this work to the scale of shallow foundations, additional experiments are needed to explore the different relative magnitude of capillarity and body stresses in the higher effective stress problem of shallow foundations. At these higher stresses, the work of Lau & Bolton (2011a, 2011b) indicates that additional factors, such as reductions in dilatancy caused by grain crushing at high effective stresses, may begin to influence behaviour.
Statements and declarations
Funding for this research was provided by Natural Sciences and Engineering Research Council of Canada (NSERC) under the Discovery Grant program awarded to W. A. Take (RGPIN-2020-04077) and G. A. Siemens (RGPIN-2018-04373). F. Parera Morales was supported by FI-DGR2015 AGAUR grant for travel and international stage, Generalitat de Catalunya. The authors have no conflicts of interest or competing interests to declare.
Data availability
Videos capturing visual observations of air entry during plastic collapse are included as online supplementary material. The data that support the findings of this study are available from the Borealis data repository (Parera Morales et al., 2014).
REFERENCES
Discussion on this paper is welcomed by the editor. Discussion on this paper closes 1 May 2026; for further details see p. ii.

