Batter piles often bear high horizontal resistance and oblique uplift load transformed from high-rise superstructures, and the direction of the oblique uplift load changes with the horizontal displacement of the superstructure. However, the working behaviour of batter piles under such working conditions is less understood. Therefore, a series of laboratory and numerical studies is carried out. A new type of tactile pressure sensor is also used to measure the soil pressure around the pile. Three major conclusions are summarised from the results. First, the lateral response of the batter pile is affected by the loading angle, while the axial response is not. Second, the at-rest soil pressure on the batter pile is in the ‘offset’ state, which can be fitted with an elliptic function. The pile–soil interaction below a certain depth is not affected by the pile angles, and the pile can be designed as the axial uplift pile. The soil stiffness varies within 0.4L and 5D in the axial and radial directions of the pile, respectively. The increase in pile inclination and loading angle can reduce the stiffness degradation to a certain degree. The findings of this research can support engineering practice in the design of batter piles.
Notation
- D
diameter of the model pile
- EI
bending stiffness of the pile
- eco
reference critical void ratio
- edo
reference minimum void ratio
- eio
reference maximum void ratio
- fb
barotropy factor
- fe, fd
pycnotropy factors
- G
shear stiffness
- hs
granular hardness (MPa)
- L
length of the model pile
- n
exponent of the limiting void ratio curves
- R
size of the elastic range
- Stif0
original soil stiffness of TN1 around the pile
- α
loading angle of the batter pile
- β
pile inclination angle
- ΔK
variation coefficient of soil stiffness
- ΔStif
increment in stiffness
- λ
geometric similarity ratio
- λ
Lamé constant (in Stif0 = λ + 2G)
- μ
friction coefficient
- φc
critical state friction angle
Introduction
Batter piles are often used in high-rise structures such as transmission towers and offshore wind turbines to resist large lateral loads. The overturning moment of the superstructure will be transferred to the foundation so that the batters are subjected to an oblique uplift load with changing directions. The Chinese code GB 50545 (Mohurd, 2010) states that the uplift and overturning stability factor of the pile foundation should be checked and be greater than 1.6. However, the working behaviour of a batter pile under oblique uplift loading is less understood.
Few studies have investigated the behaviour of a single batter or vertical pile subjected to an uplift load, and most of them adopted a load in the plumb or axial direction (Awad and Ayoub, 1976; Chattopadhyay and Pise, 1986; El Sawwaf and Nazir, 2006; Reddy and Ayothiraman, 2015; Sabry, 2001), which is inconsistent with engineering practice (oblique uplift load). Moreover, the experimental results show a wide discrepancy. Meyerhof (1975) and Meyerhof et al. (1981) first conducted axial uplift tests of batter piles in dense sand. They found that the skin friction had no significant change when the pile inclination was below 45°. However, based on test data, Hanna and Afram (1986) and Hanna and Nguyen (2003) concluded that the uplift load-carrying capacity decreases with the increase in pile inclination. In the batter pile tests, if the load direction is not along the pile axis, the measured displacement of the pile head (axial and lateral) will not match the load. The authors believed that this is the reason why the two experiments are similar but the conclusions are quite different. Nazir and Nasr (2013) believed that sand density has a great influence on the uplift load-carrying capacity of the batter pile. In medium and dense sand, the ultimate load-carrying capacity first increases and then decreases with the rise of the pile inclination. In loose sand, the ultimate load-carrying capacity decreases monotonically when the pile inclination rises. However, the test only applied axial load, which cannot reflect the combination influence of lateral and axial loads. Yousif et al. (2004) carried out an uplift test of single vertical and batter piles in sand. The results show that the pile inclination affects the load-carrying capacity significantly. However, since only the load in the plumb direction was adopted in tests, the influence of loading angle was not considered.
In terms of numerical analysis. Ramadan et al. (2013) used the finite-element (FE) method and centrifuge testing to study an oblique uplift anchor pile. The authors believed that there is significant interaction between the uplift and the horizontal load. However, the soil behaviour is characterised by the Mohr–Coulomb constitutive model, which cannot reflect the stiffness degradation effect of soil. Mroueh and Shahrour (2010) analysed the load-carrying capacity of a batter with commercial FE software. The results show that the loading angle affects the axial load-carrying capacity of the batter pile, particularly at low values of the loading angle regarding the pile axis. The uplift load-carrying capacity of the positive batter pile is higher than that of the negative batter pile. However, the FE model is not validated, and the soil behaviour is simply characterised by the Mohr–Coulomb constitutive model, which cannot consider the degradation stiffness effect.
In conclusion, few studies have paid attention to batter pile response under an oblique uplift load. In most of studies, the displacement of the pile head and load are not decomposed, which results in a mismatch between the displacement and the load direction. The mismatch will cover the true bearing characteristics. Therefore, in this study, a series of laboratory tests and numerical analysis with an advanced constitutive model are carried out. The response of a batter pile under oblique uplift load is revealed, along with its cause. With the help of tactile pressure sensors (TPSs), the soil distribution and variation law under the influence of pile inclination and loading angle are measured. The primary purpose is to provide a basis for engineering.
Method: experimental design and process
Test design
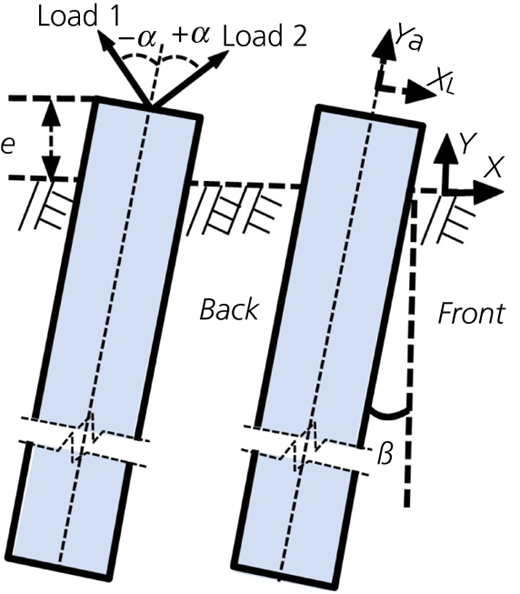
As Figure 1 shows, the loading angle α and pile inclination β were set as variables to explore the influence on the pile load-carrying capacity and displacement response. The load is applied in the X–Y coordinate system (parallel to the mud-line and plumb direction), and the result will be analysed in X L–Y A (parallel to the lateral and axial directions of the pile) by angle conversion. If the lateral load component is parallel to the direction of the pile inclination (load 2), the pile will be called a positive uplift pile; otherwise, it will be called a negative uplift pile (load 1). The direction of the pile inclination is called the front of the pile, and the other is called the back of the pile.
Table 1 shows that, in total, 11 groups of laboratory tests are carried out, in which D is the pile diameter and e is the loading height above the mud-line. The pile length is 1.1 m, and the embedded length is 1.0 m. T1 is the reference testing group with the plumb pile and uplift load along the pile axis.
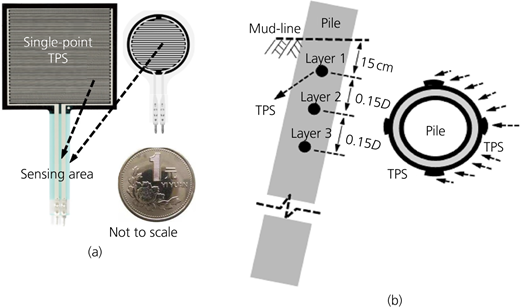
A new type of TPS (Chaney et al., 1997; Palmer et al., 2009) is used in the test to measure the distribution and variation of the soil–pile interaction forces. Figure 2 shows a schematic diagram of the TPS (Figure 2(a)) and its arrangement on the pile (Figure 2(b)). There are four layers of TPSs along the pile axis with a spacing of 15 cm (0.15D); four TPSs are attached to the pile surface symmetrically for each layer. The TPS is a flexible piezoresistive sensor, which means that it can be fully attached to the curved surface without introducing dynamic matching errors (Liu et al., 2020). The thickness of the TPS is less than 1 mm. Unlike in the case of a soil pressure cell, the mismatch error caused by the embedding effect can be avoided (Wachman and Labuz, 2011).
Materials and equipment
The pile is made of thick-walled poly(vinyl chloride) pipes with an elastic modulus of 3.3 GPa measured through a three-point bending test. The similarity design method is shown in Equation 1 according to the paper by Wood et al. (2002), and the remaining parameters are shown in Table 2, where (EI)P and (EI)M are the bending stiffness of the prototype and model, respectively, and λ is the geometric similarity ratio.
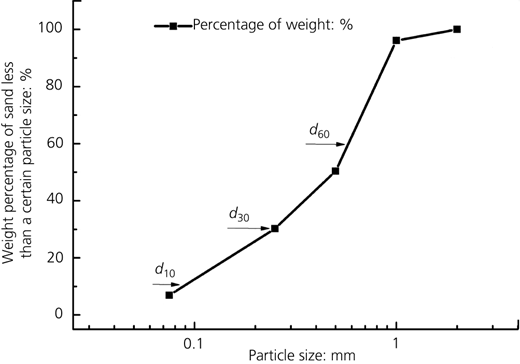
The sand is taken from the surface of a dry riverbed. It is sieved (2 mm sieve), washed and dried to reuse in tests. W = 0% (moisture content), C u = 6.43 (coefficient of uniformity), C c = 1.27 (coefficient of curvature) and d 50 = 0.503 mm (average particle size) (Figure 3). The internal friction angle measured by a direct shear test under the same density is φ = 38°, and the cohesion is considered to be 0.
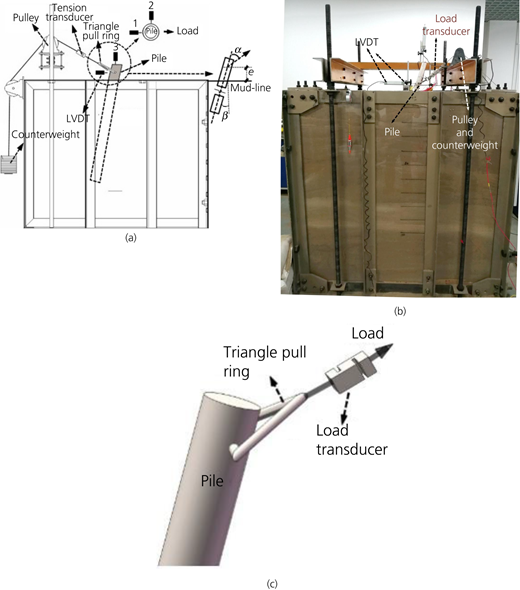
The test is carried out in a self-balancing testing box with dimensions of 1.5 m × 1.2 m × 1.5 m (length × width × height). The minimum distance between the pile and the acrylic side-wall is greater than 15D, so the boundary effect can be ignored (Rao et al., 1998). The pile is loaded by using a counterweight with a steel strand through a pulley. Three linear variable differential transformers (LVDTs) are settled at the loading position to measure the horizontal (numbers 1 and 2) and vertical displacements (number 3), as shown in Figure 4(a). If the signal of the number 2 LVDT does not converge after a load of 100 N, this indicates that the pile is deflecting on the horizontal plane; the test will be repeated.
A triangular ring passes through the pile head and forms a hinge structure. The load transducer connects the triangular ring and the steel strand attached to the counterweight, as shown in Figure 4(b). In this way, the pile top becomes a truly free head in the loading plane, thereby avoiding the additional bending moment caused by over-constraint. Meanwhile, the oblique uplift load can be obtained directly by the transducer, avoiding the influence of pulley friction and the strain of the steel strand.
Test procedure
The sand is rained into the box from an about 1.5 m height and then compacted with a vibrator. The density and uniformity of the sand are controlled by the weight and height of each filling. The average density of the sand is 1.72 g/cm3, and its relative density is 66%. The pile inclination is controlled with a fixture. The multistage loading method is used in the test. In accordance with the ultimate load-carrying capacity of Tp1 and code JGJ 106 (MOC, 2003), the increment is set to 50 N. If the value of each LVDT is less than twice the value of the preceding stage and converges within 5 min, the next stage is applied after 10 min; otherwise, loading is stopped. The average value in the last 5 min is taken as the displacement value of this stage.
Results
Influence of the oblique uplift load on the load-carrying capacity of the batter pile
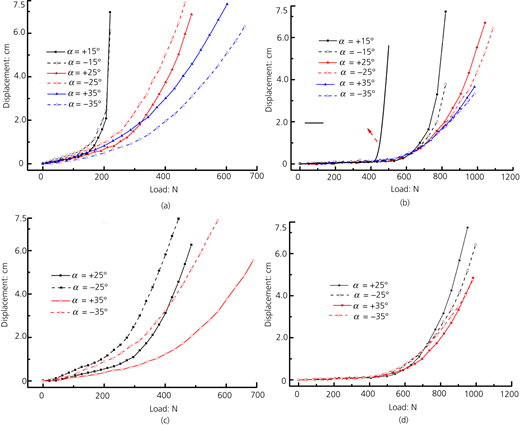
In this section, the test results are used to explore the influence of the loading angle α and inclination β on the displacement response and load-carrying capacity of the batter pile. Figure 5 shows the load–displacement curve of each group in the X L–Y A coordinate system, where Figures 5(a) and 5(c) and Figures 5(b) and 5(d) are the lateral and axial displacements of the pile head when β = 10° and β = 20°, respectively. The load and displacement are decomposed along the axial and lateral directions of the pile.
Two distinct features can be observed from Figure 5. Feature 1: the loading angle α has a great influence on the lateral load-carrying capacity; however, it does not influence the axial load-carrying capacity. Taking Figures 5(a) and 5(c) as examples (lateral load–displacement curve), it can be seen from Figure 5(a) that when pile inclinations β are the same, the smaller the α (±15°) and the earlier the inflection point appears (the displacement increases sharply and does not converge). With the increase in α (α = ±35°), the load–displacement curve varies more smoothly. The displacement of each stage is relatively uniform, and there is no obvious failure point (ultimate load-carrying capacity) – that is, the lateral ultimate load-carrying capacity of the batter increases with the increase in loading angle α. When β = 10°, this rule is more obvious than when β = 20°.
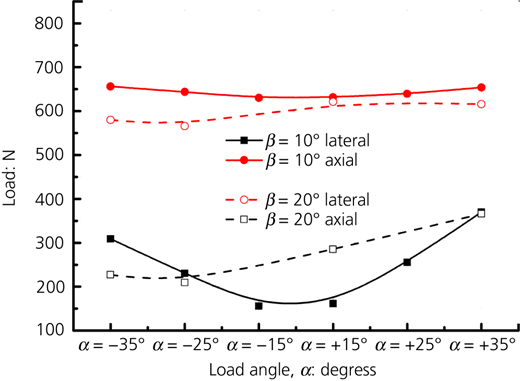
The ultimate lateral and axial load-carrying capacities of each test are shown in Figure 6 (determined by using the asymptote–tangent method (Li et al., 2014; Rosquoët et al., 2007; Verdure et al., 2003)). It can be seen that no matter how α changes, the axial load-carrying capacity of the batter pile basically remains constant (the difference between the maximum and minimum ultimate load-carrying capacities is less than 7%) – that is, the loading angle α does not influence the axial load-carrying capacity.
Feature 2: the variation of α has an influence on the initial lateral stiffness of the batter pile and does not affect the axial stiffness.
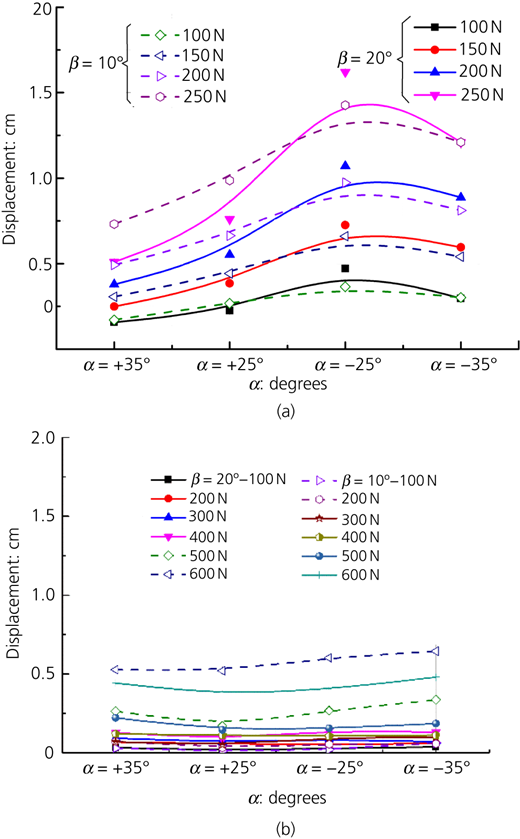
Figure 7 shows the displacements of the oblique uplift batter pile with different loading angles α when the load is the same, where Figures 7(a) and 7(b) show the lateral and axial displacements, respectively. It can be seen from Figure 7(a) that when α changes from |25°| to |35°|, the lateral displacement decreases. The axial displacement is not sensitive to the variation of the loading angle. Under the same load and different α values, the axial displacement basically remains constant (Figure 7(b)) – that is, the initial stiffness of the lateral load–displacement curve increases with the increase in the loading angle α, and its axial direction is not affected. Figure 7(a) also shows that the initial lateral stiffness of the positive uplift pile is greater than that of the negative one. When the direction of the lateral component of the oblique uplift load is the same as the pile inclination, the batter pile has a greater initial lateral stiffness. In conclusion, the variation of α will increase the lateral load-carrying capacity and initial stiffness; however, it does not influence its axial response. How the oblique uplift load affects the lateral and axial load-carrying capacity is explained with a soil element analysis in the section headed ‘Explanation of the variation of the load-carrying capacity and stiffness with Mohr’s circle theory’.
Distribution and variation of soil pressure around the batter pile
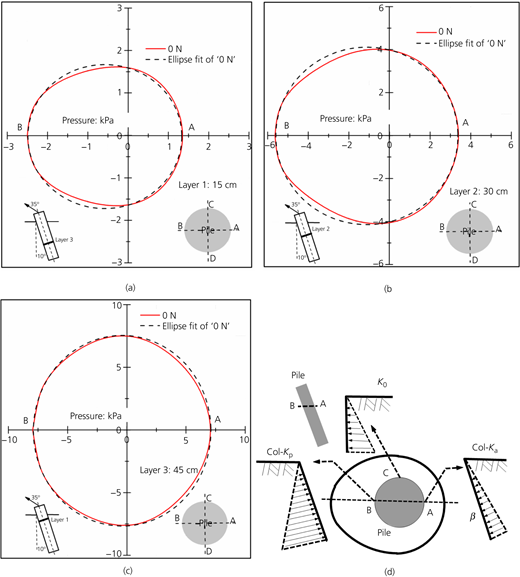
This section will analyse the soil pressure around the batter pile based on the TPS data. The soil pressure distribution law and variation tendency are similar; the results of Tp6 (β = 10°, α = +35°) are illustrated here as an example. The arrangement of TPSs is shown in Figure 2(b).
Figure 8 shows the smoothed distribution of the at-rest soil pressure, where Figures 8(a)–8(c) correspond to the data of TPS layers 1–3, respectively. It can be seen that the soil pressure on the batter pile is asymmetric. The soil pressure in the pile front area is larger than that in the back area, and the difference gradually decreases with the increase in depth. According to the theory of inclined retaining walls, the unbalanced earth pressure distribution can be roughly understood.
As Figure 8(d) shows, positions A, B and C around the pile correspond to passive, active and at-rest soil pressures, respectively. In this paper, the authors would like to call the asymmetric soil pressure distribution as the ‘offset’ effect.
The offset soil pressure can be fitted by an elliptic function. The coefficient of determination R 2 of all three layers is greater than 90%. The offset effect decreases with increasing depth, and the soil pressure distribution gradually ‘rounds’. The difference between points A and B decrease from 43% at layer 1 to 5.7% at layer 3, which indicates that the influence of pile inclination β on the soil pressure distribution is mainly within 0.5L.
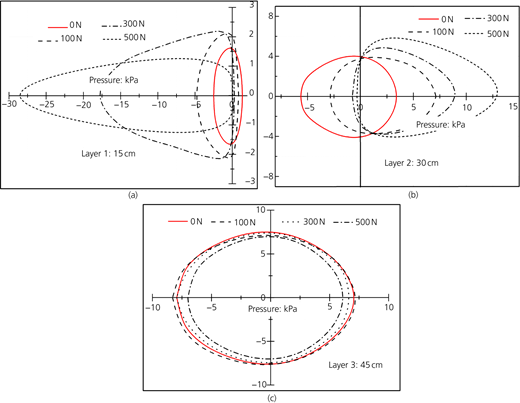
Figure 9 shows the variation of soil pressure with a load around the batter pile. It can be seen that the lateral pile–soil interaction of layer 1 is the strongest of the three (Figure 9(a)). The maximum soil pressure under a 500 N loading is 12 times larger than that under 100 N. The directions of the maximum pressure and lateral load component are the same. The pile and soil are separate around 300 N (near 0 kPa).
In layer 2, the difference between the maximum and minimum soil pressures under different loads is significantly smaller than that of layer 1. The direction of the maximum pressure is opposite to the lateral load component. Until 500 N, the pile and soil are still not separate, indicating that layer 2 is within the reverse bending region.
When the load is 0–300 N, the soil pressure difference of layer 3 can be ignored (Figure 9(c)). When the load reaches 500 N, the soil pressure decreases uniformly, and the shape is the same as that for 0 N. Liu and Tian (2007) believe that when an axial uplift load is applied, the soil void ratio around the pile first increases, which leads to a decrease in the pile–soil normal contact force. Meanwhile, the failure surface at the pile–soil interface is forming and developing, which makes the pile go into a state where the more it is pulled out, the looser it is (Alawneh et al., 1999). The authors believe that the aforementioned two reasons jointly cause the uniform decrease in soil pressure at 500 N.
The pile–soil interaction in the normal direction of layer 3 is very weak, which indicates that the lateral load component has been borne by the upper section of the pile. It can be considered that the depth of layer 3 has exceeded the effective pile length of the lateral load component (or the effective influence depth of the lateral load component). When the oblique uplift load is applied, the inclination β and loading angle α basically do not affect the middle and lower parts of the batter pile; these sections can be considered an axial uplift pile. The distribution of the soil pressure is concluded based on the knowledge of soil mechanics, the results of the tests and a reasonable assumption. Further investigations could be carried out with more sophisticated experiments and numerical methods.
Discussion
Explanation of the variation of the load-carrying capacity and stiffness with Mohr’s circle theory
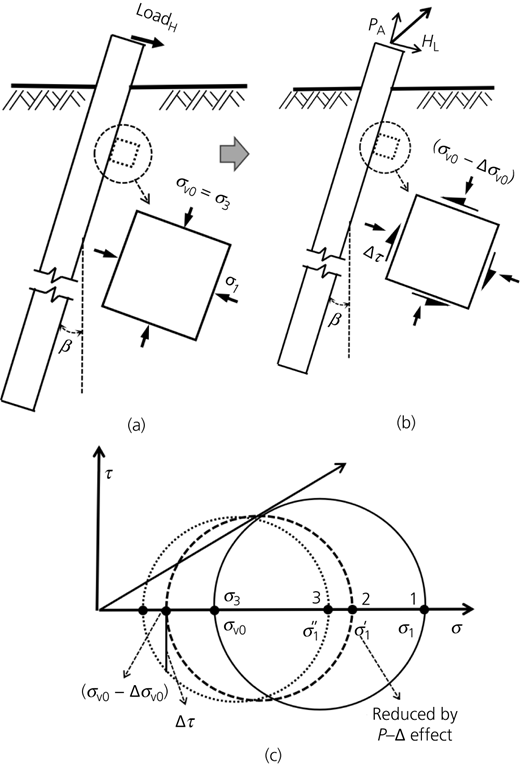
The authors believe that the decreases in lateral load-carrying capacity and stiffness are all related to the variation of the axial load component. The reason is shown in Figure 10. Figure 10 shows the limit state of the soil element around the pile, where Figures 10(a) and 10(b) show the batter pile with a lateral load only and an oblique uplift load, respectively. Figure 10(c) shows the variation of Mohr’s circle corresponding to Figures 10(a) and 10(b). The limit stress state of the soil element in Figure 10(a) corresponds to Mohr’s circle 1 in Figure 10(c). Assume that the value of LoadH in Figure 10(a) is equal to the lateral load component H L in Figure 10(b). The axial load component P A causes a P–Δ effect on the pile and provides an unloading effect around the soil (σ v0 − Δσ v0). The maximum and minimum principal stresses decrease, and Mohr’s circle reduces from circle 1 to circle 2. When the influence of shear force τ on the combined pile–soil interface is considered, Mohr’s circle further reduces to circle 3, which means that the ultimate load-carrying capacity decreases.
Figure 10(c) shows that both maximum and minimum principal stresses of soil elements are decreased because of the negative friction at the soil–pile interface. It is well recognised that the sand modulus decreases with decreasing confining pressure. Moreover, the relative displacement between the pile and the soil will increase the void ratio of sand (Ashour et al., 2020; Liu and Tian, 2007), which will further decrease the soil stiffness around the pile.
Influence of the oblique uplift load on the lateral response stiffness of the batter pile
In this section, numerical analysis will be used to discuss the stiffness decreasing law, the influence scope and influence factors. Firstly, a hypoplastic constitutive model was used to build a numerical model that can reflect the small-strain-stiffness effects. Then, the loading angle α, pile inclination angle β and friction coefficient are set as variables to explore their influence.
Rosquoët (2004: pp. 57–59) conducted a series of centrifuge tests on a single pile under a horizontal load. The diameter of the pile was 0.72 m, and the slenderness ratio was 15, which indicates that the pile was a flexible pile. The author first established and verified a prototype FE model based on the centrifuge test (tests were carried out under 40g, which has advantages in establishing a prototype model with the FE method). The verified FE model was then adapted to the batter pile simulation to explore the influence of the oblique uplift load on the stiffness of soil around the pile.
In total, ten numerical analyses are conducted with different loading angles α (15–35°), different pile inclinations (10–30°) and different friction coefficients between the pile and soil (0.4, 0.5, 0.6, 0.65). The detailed numerical analysis scheme is shown in Table 3, where TN1 is the reference group without load. TN2 is the batter pile with an axial uplift load of 0.5P UAx (P Uax is the ultimate axial load-carrying capacity).
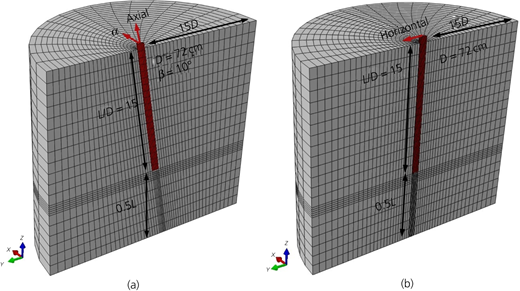
The FE models are shown in Figure 11. The distance between the pile and the boundary is greater than 15D (pile diameter). The pile is modelled using a linear elastic constitutive law and has a section stiffness of E P I P = 2600 × 106 N m2. The monotonically increasing multistage horizontal and oblique uplift loads are applied on the pile head, respectively. The classical Coulomb model is used to simulate the behaviour at the interface between the pile and the soil, where the tangential frictional stress is proportional to the normal stress. The friction coefficient is obtained by trial, μ = 0.6.
The sand behaviour is characterised using the hypoplastic constitutive model proposed by von Wolffersdorff (1996), as Equation 2 shows, where f b and f e and f d are the barotropy and pycnotropy factors, respectively, which are employed to reflect the pressure dependency and density dependency of sand. They are all functions of the current void ratio and the stress level. The intergranular strain concept (Niemunis and Herle, 1997) enables the hypoplastic constitutive model to characterise the small-strain-stiffness effects, which need five extensional parameters.
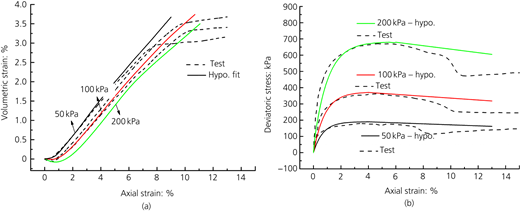
The parameter values and meanings are shown in Table 4. φ c is determined by the angle of repose test. h s and n are used to describe the shape of the limiting void ratio curves determined by the oedometric test. According to Herle and Gudehus (1999), the limiting void ratios e do, e co and e io are empirically determined by using e co ≈ e max, e do ≈ e min and e io ≈ 1.15e max. Other parameters characterising the dependency of peak friction, the dependency of soil stiffness, the degradation of shear stiffness and so on (β r, χ, m T and m R) are calibrated from a series of consolidated drained triaxial (TR-CD) tests under 50, 100 and 200 kPa. The results are shown in Figure 12; more detailed information on sand can be found in the publications by Rosquoët (2004: pp. 57–59) and Li et al. (2015). The implementation (in UMAT format) of the von Wolffersdorff model for the FE software Abaqus is available from the SoilModels Project website; the parameter selection courses are also provided on the website.
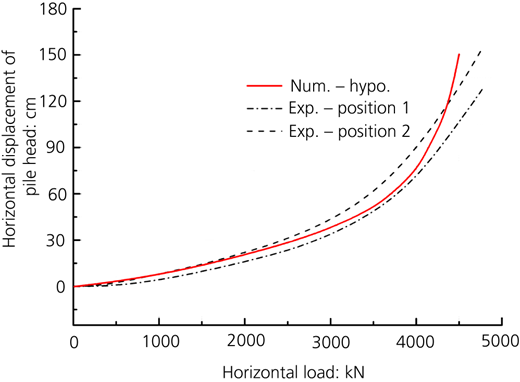
The comparison of the horizontal displacements of the pile head between the FE model and the test is shown in Figure 13. It is shown that the numerical results are very close to the test data, which indicates that the proposed FE model can reflect the pile–soil interaction of the centrifuge test in the prototype.
Define ΔK as the variation coefficient of soil stiffness:
where ΔStif is the increment in stiffness (TN2 – TN10) and Stif0 is the original soil stiffness of TN1 around the pile. The soil stiffness referred to in Equation 3 is the first item in the stiffness matrix, which is perpendicular to the pile axis. The stiffness is expressed as λ + 2G, where λ and G are the Lamé constant and shear stiffness, respectively.
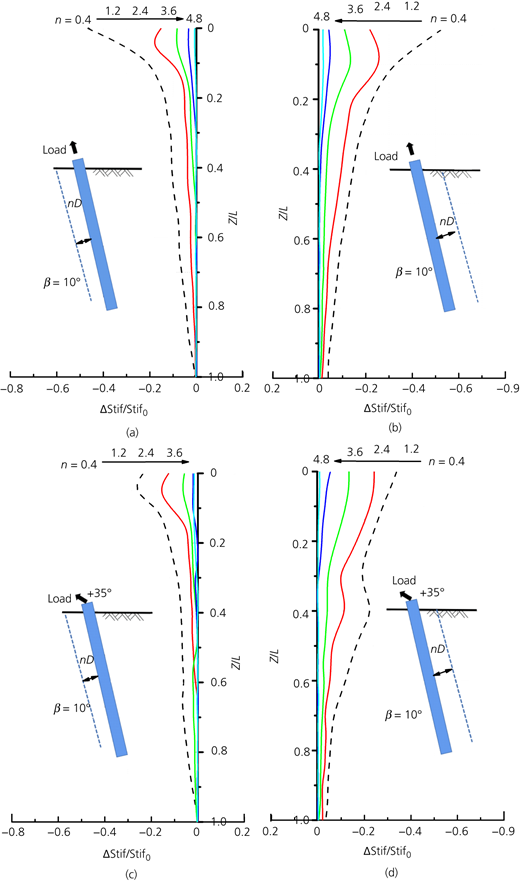
Figure 14 shows the stiffness variation coefficients of the soil column along the pile at 0.4D (D is pile diameter), 1.2D, 2.4D, 3.6D and 4.8D, where Figures 14(a) and 14(b) are for the pile front and back sides of reference group TN2 (pile inclination β = 10°, axial uplift load of 0.5P uAx) and Figures 14(c) and 14(d) show the pile front and back sides of TN3 (pile inclination β = 10°, loading angle α = +25°, oblique uplift load of 0.5P Uax/cos α).
It can be seen from Figure 14(a) that the pure axial uplift load reduces the stiffness of the soil around the pile in both the pile front and back areas. The degradation region is mainly in the upper section (≤0.4L, ΔK ≥ 10%), and it gradually decreases along the depth. Moreover, the variation of the soil stiffness in the pile front and back sides is asymmetric. The change ratio in the pile front is slightly smaller than that in the pile back. The authors believe that this is caused by the difference in stress distribution introduced by the weight of the pile. The change of soil stiffness at 4.8D is close to 0, which means that the influence domain of the axial load is within 5D.
When an oblique uplift load is applied, the variation law of stiffness in Figures 14(c) and 14(d) is similar to that in Figures 14(a) and 14(b). The lateral load component introduced by the loading angle α increases the stress level of soil and will prevent a further increase in void ratio. The absolute value of stiffness degradation is reduced, but the stiffness asymmetry of the pile front and back is further aggravated.
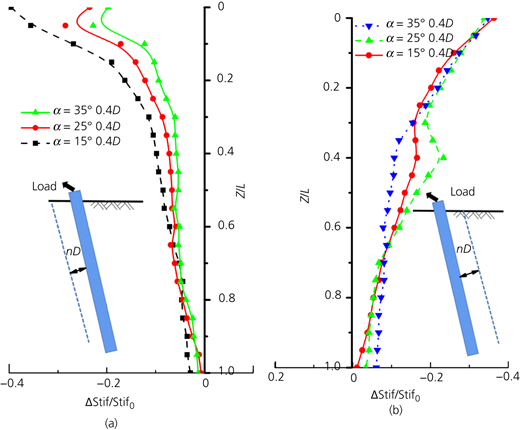
Figure 15 shows the influence of the loading angle α on soil stiffness. The soil stiffness degradation around the batter pile is more sensitive to the change in α than pile inclination β. The relative value of stiffness degradation decreases with the increase in α. For example, when α changes from 15 to 35°, the coefficient varies from 0.39 to 0.2, nearly double the difference. The reason has been already analysed in Figure 10.
The changes in stiffness in the pile front mainly occur on the upper section (≤0.4L, ΔK ≥ 10%), while in the pile back area, it is more obvious in the middle part. When a positive oblique uplift load is applied, there is a tendency of separation between the pile and soil, which weakens the interaction in the upper pile back area. However, in the middle, the pile–soil interaction increases due to the reverse bending, which leads to the difference between the front and back of the pile.
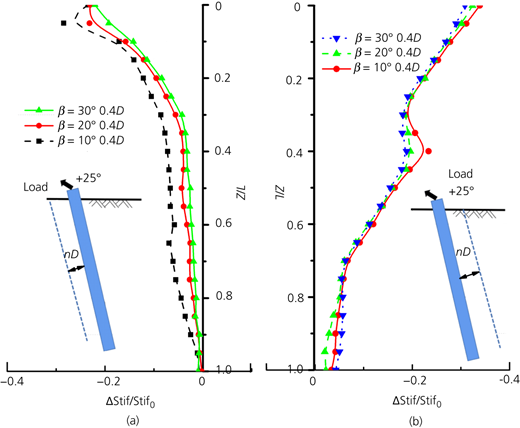
Figure 16 shows the influence of the pile inclination β on soil stiffness around the pile, where Figures 16(a) and 16(b) are for the pile front and back, respectively. The influence of β on soil stiffness in the pile front and back areas is significantly different. In the front of the batter pile (Figure 16(a)), the soil stiffness decreases with the increase in β. When β = 30°, the average degradation of stiffness is about 7% less than that when β = 10°.
The greater β is, the greater the lateral component of the pile weight is. The increase in β can be considered the increase in the confining pressure of the pile–soil interface, which causes the difference in stiffness degradation between different pile inclinations. In the pile back area (Figure 16(b)), the soil stiffness is not sensitive to the change in the pile inclination β, and its influence can be ignored.
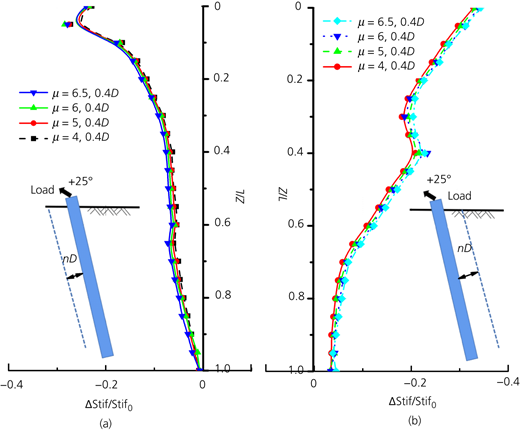
Figure 17 shows the influence of friction coefficient μ on soil stiffness around the pile. μ = 0.4–0.65 represents the upper and lower limits based on the empirical value of the internal friction angle. Within this range, the difference between stiffness curves is less than 1%. The influence of μ can be ignored.
In conclusion, the increase in the pile inclination β and loading angle α reduces the stiffness degradation caused by the axial load component of the oblique uplift. However, its effect is limited and differs between the pile front and back areas. The maximum stiffness degradation of soil occurs in the upper part of the pile – that is, the area with the strongest pile–soil interaction. Taking the numerical model in this paper as an example, the stiffness decreases up to 40%, and the influence domain is less than 5D. Therefore, in the design and engineering practice of the oblique uplift batter pile, the effect of soil stiffness degradation on the axial and lateral responses should be considered.
Conclusions
The axial response of the pile is not affected by the oblique uplift load. However, the axial load component will cause an unloading effect around the pile, leading to the lateral load-carrying capacity and initial stiffness of the pile increasing with the increase in loading angle α.
The at-rest soil pressure around the batter pile is in the offset state, which can be expressed by an elliptic function. The distribution of soil pressure gradually rounds with the increase in depth. Below a certain depth, the pile inclination β and loading angle α will not affect the pile–soil interaction. Therefore, in these sections, the batter pile can be considered an axial uplift pile.
The stiffness degradation of soil (introduced by the axial load component) mainly occurs in the upper pile section (0.4L). The change in soil stiffness decreases along with pile depth, and the influence domain is within 5D. A rise in both the inclination β and loading angle α can reduce the stiffness degradation to a certain extent.
Acknowledgement
The study is supported by the National Natural Science Foundation of China (Numbers 51178385 and 51578026).