


In recent times, geopolymers have gained attention as a soil stabilisation binder due to their ability to improve the engineering properties of soil while remaining eco-friendly. This study seeks to investigate the stabilisation of soft soil using palm-oil-fuel-ash (POFA)-based geopolymers. A geopolymer was created by combining POFA with an alkaline activator solution composed of sodium hydroxide (NaOH) and sodium silicate (Na2SiO3). The mechanical and microstructural behaviours of two clayey soil types (samples S1 and S2) stabilised with four doses of the POFA-based geopolymer (G10PA, G20PA, G30PA and G40PA) were studied by conducting one-dimensional consolidation, California bearing ratio (CBR) tests, field emission scanning electron microscopy (FESEM) and X-ray diffraction (XRD). The optimum dosage found was G40PA for both soil samples. The CBR value of S1-G40PA was 1.7 times that of S1, while that of S2-G40PA was nearly 1.5 times that of S2. The void ratio of S1 was significantly reduced from 0.70 (untreated sample) to 0.56 (S2-G40PA), whereas for S2, it was decreased from 1.43 (untreated sample) to 0.43 (S2-G40PA). The microstructural analysis (FESEM) revealed that changes in material composition correlate with the consolidation behaviour, with the geopolymer gel-binding effect enhancing the mechanical properties of stabilised soils.
Notation
- A
area of the specimen
- Cc
compression index
- Cs
swelling index
- Cv
coefficient of consolidation
- e0
initial void ratio
- e1
void ratio at the end of each loading increment
- Gs
specific gravity of the sample
- H0
initial thickness of the soil specimen
- Hs
height of solids
- Hdr
average height of the sample
- k
coefficient of permeability
- Ms
mass of the dry soil specimen
- mv
coefficient of volume compressibility
- t90
time required for 90% consolidation
- γw
unit weight of water
- ΔH
change in the thickness of the soil specimen
- ρw
water density
effective stresses
pre-consolidation pressure
Introduction
The need to enhance soil strength to create a firm underlying layer for infrastructure, buildings and railroads arose due to the increasing population and limited availability of space. High-plasticity soil is a primary geotechnical engineering concern because it can cause foundation, roadway and water system failures. Also, the growth of the industrial and infrastructural sectors has used up many building materials, which hurts the environment. Hence, soil stabilisation was born from the challenging problem of having a solid and sturdy subgrade soil layer capable of bearing the applied loads.
Due to their effectiveness in increasing soil strength, reducing settlement and regulating shrinkage and swelling, cement and lime, which are the most common binders, have been employed to improve soft soil properties for decades (Asgari et al., 2015; Firoozi et al., 2017; Wang et al., 2018). However, there are several drawbacks associated with their use, including cost and environmental implications. In the process of manufacturing 1 t of cement, 1.5 t of natural substances is needed, along with 5.6 GJ/t of energy use and roughly 0.95 t of carbon dioxide (CO2) emissions (Albitar et al., 2015; Du et al., 2016; Jafer et al., 2018), while producing 1 t of lime releases 0.86 t of carbon dioxide (Chang et al., 2015). Moreover, the production of cement results in carbon dioxide emissions that account for around 7% of all atmospheric greenhouse gases (GHGs) (Aziz et al., 2015; Criado et al., 2007).
Cement and lime, the most common binders, have been utilised for decades to improve soft soil properties due to their effectiveness in increasing soil strength, reducing settlement and regulating shrinkage and swelling (Asgari et al., 2015; Firoozi et al., 2017; Wang et al., 2018). However, despite the benefits of these stabilisers in enhancing the engineering properties of soil, there are several drawbacks, such as cost and environmental implications. The production of 1 t of cement requires 1.5 t of natural substances and 5.6 GJ/t of energy and emits approximately 0.95 t of carbon dioxide (Albitar et al., 2015; Du et al., 2016; Jafer et al., 2018), while the manufacturing of 1 t of lime releases 0.86 t of carbon dioxide (Chang et al., 2015). Furthermore, cement production contributes to carbon dioxide emissions that make up about 7% of all atmospheric GHGs (Aziz et al., 2015; Criado et al., 2007). In this context, finding alternative waste materials for soil stabilisation can help mitigate the environmental impacts associated with the use of traditional binders and address the challenges posed by waste disposal in landfills.
Researchers have recently started searching for binders that can effectively solve the problem of waste clean-up, address the limitations of binders containing calcium and ensure that they are environmentally friendly. As a result, the concept of geopolymers as a next-generation material was established. Inorganic polymers known as geopolymers are made of aluminium (Al) and silicon (Si) ions alternately tetrahedrally linked with oxygen (O) ions. They are also known as alkali-activated materials. The typical formula for describing the chemical characteristics of geopolymers is Mn[(SiO2)z–AlO2]n·wH2O, where z is 1, 2 or 3; M stands for the alkali cation (potassium (K) or sodium (Na)) and n denotes the degree of polymerisation. Hence, based on the silica (SiO2) content in the precursor, the geopolymer structure can be classified as polysialate (–Si–O–Al–O), polysialate-siloxo (–Si–O–Al–O–Si–O) or polysialate-disiloxo (–Si–O–Al–O–Si–O–Si–O) (Majidi, 2009). The process of polymerisation can be summarised as follows (Fernández-Jiménez et al., 2006; Van Riessen et al., 2013): first is the creation of monomers and the dissolution and disintegration of reactive aluminium and silicate bonds in the precursor (aluminosilicate material), which occurs as a result of the pH increase caused by the activator solution. The resultant chemicals are then accumulated and precipitated through polycondensation processes to create an amorphous, three-dimensional (3D) structure that tends to crystallise.
The success of employing geopolymers made from various aluminosilicate minerals, such as class F fly ash (Teing et al., 2019) and class C fly ash (Khan et al., 2018), in soil stabilisation has been demonstrated by massive quantities of geotechnical research. However, palm oil fuel ash (POFA) deserves attention compared with other aluminosilicate precursors because it is readily available as waste material and has high potential for geopolymer production, particularly in South-east Asian nations such as Malaysia (Liu et al., 2014).
Minimal research has been conducted on agricultural waste (POFA) for producing geopolymers for geotechnical applications. Abdeldjouad et al. (2019) examined the effectiveness of utilising 10 M potassium hydroxide (KOH) to activate POFA in an alkali activation process for stabilising clayey soil. Laboratory tests focused on evaluating undrained shear strength and morphological aspects using scanning electron microscopy (SEM) and X-ray diffraction (XRD) techniques on soils with and without POFA mixtures. The findings revealed that the mixtures containing POFA exhibited a higher strength compared with the untreated samples. However, when considering the curing time, the mixtures with both a higher kaolinite content and POFA demonstrated significantly greater strength levels in comparison with the mixtures without POFA. Sukmak et al. (2019) explored subgrade stabilisation employing a geopolymer consisting of POFA and sodium hydroxide (NaOH), with sodium silicate (Na2SiO3) serving as an alkali activator. The study aimed to identify the ideal sodium silicate/sodium hydroxide and POFA/soil ratios by examining enhancements in soil microstructure and compressive strength development. The combinations of sodium silicate/sodium hydroxide that yielded the greatest strength were observed to be 40:60, 50:50 and 60:40. These ratios corresponded with POFA-to-soil proportions of 30:70, 40:60 and 50:50, respectively. In terms of the alkaline activator (L) that led to maximum strength, it was found to be at an optimal liquid alkaline activator content (OLC) of L = 22.8% when the POFA-to-soil ratio was 30:70. Meanwhile, for POFA-to-soil ratios of 40:60 and 50:50, the highest strength was achieved at 1.2 times the OLC (L = 31.4%) and 1.4 times the OLC (L = 44.55%), respectively. The primary chemical components that formed in the POFA–soil geopolymers were determined to be calcium aluminate silicate hydrate and calcium sodium aluminate silicate hydrate. In addition, Khasib et al. (2021) studied the mechanical behaviour of soils treated with a POFA-based geopolymer in terms of strength and micromorphological changes, and the results indicated that the shear strength of the soils soared with an increasing dosage of the POFA-based geopolymer. The geopolymer with 40% POFA by dry weight of the soil yielded the highest unconfined compressive strength (UCS) value at both curing periods of 7 and 28 days. Ezreig et al. (2023) tried different percentages of POFA ranging between 10 and 40% with the addition of magnesium oxide (MgO) as an activator between 2.5 and 10.0% to examine the geotechnical properties of laterite soil (LS). UCS tests, flexural strength (FS) tests, SEM and energy-dispersive X-ray spectroscopy (EDX) analysis were conducted to test the stabilised soil samples. Their results showed that the UCS values of the LS–POFA–magnesium oxide sample increased up to 3.56 and 5.05 MPa after 7 and 28 curing days, respectively, when the POFA–magnesium oxide was used at a ratio of 30:10. An increase of approximately 17 times greater than that of the untreated soil was also found. Despite the progress and achievements made in research, using geopolymers for soil-treatment implementations is still in the initial phases and requires further substantiation.
However, prior studies combined POFA with soil before adding the alkaline activators, contrary to applying geopolymers to the soil. Thus, a properly formulated geopolymer must be developed and added to the soil to understand better how POFA-based geopolymers affect soil characteristics. Also, previous research conducted on soil stabilisation using geopolymers focused mainly on the shear/compressive strength of the stabilised soils without considering the consolidation characteristics and settlement behaviour. Therefore, the consolidation behaviour of soil before and after treatment with geopolymer is described in detail in this study. Furthermore, the microstructural behaviour using field emission SEM (FESEM) and XRD was examined to understand the mechanism behind geopolymer reaction with soil.
Materials and methods
Materials
Soil
Two natural soft soil samples corresponding to two different soil types were obtained and tested for this investigation. The first sample (S1) was a residual soil collected from Universiti Putra Malaysia, Selangor, Malaysia (3.005642° north, 101.721922° east), while the second sample (S2) was obtained near Jalan Pinang 1, Kampung Sungai Burong, Tanjong Karang, Selangor, Malaysia (3.454027° north, 101.141027° east). S2 was a typical marine clay extracted from below the groundwater table in a slurry state. Figure 1 shows the location of the samples collected.
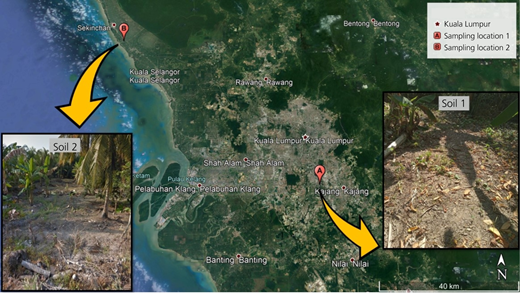
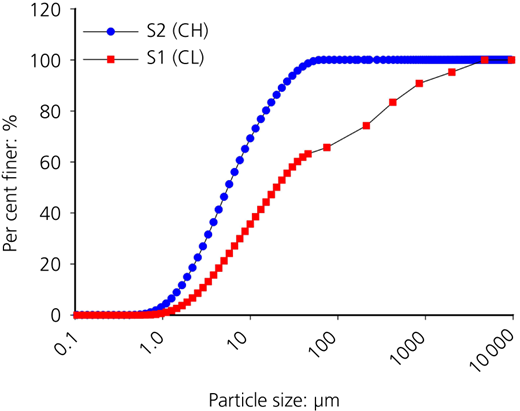
Soil samples were taken from depths of 1.0 and 1.5 m and promptly transferred to plastic bags. Figure 2 shows the grain size distributions of both soil samples. Figure 3 shows the samples used in this study sieved through sieve number 10 (2 mm).
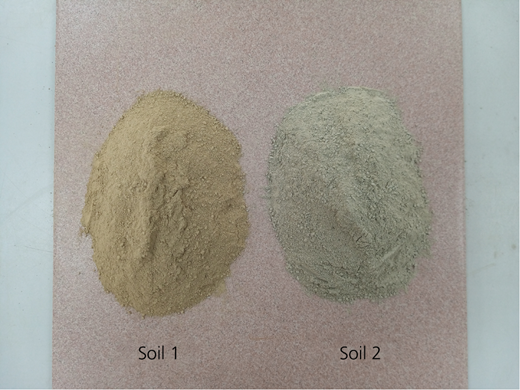
The geotechnical tests in this study followed the British standard BS 1377:1990 (BSI, 1990). Table 1 shows the characteristics of the soil samples used in this study.
Physical and chemical properties of the soil samples
| Property | Unit | S1 | S2 |
|---|---|---|---|
| Initial moisture content | % | 22.9 | 98.9 |
| pH | — | 7.35 | 6.53 |
| Specific gravity | — | 2.77 | 2.8 |
| Plastic limit | % | 22.2 | 35.6 |
| Liquid limit | % | 41.6 | 80.7 |
| Plasticity index | % | 19.4 | 45.1 |
| Shrinkage limit | % | 6.2 | 15 |
| USCS classification | — | CL | CH |
| Optimum moisture content | % | 15.5 | 34.4 |
| Maximum dry density | Mg/m3 | 1.76 | 1.31 |
| Silicon dioxide (SiO2) | % | 36.71 | 42.46 |
| Aluminium oxide (Al2O3) | % | 27.18 | 22.65 |
| Calcium oxide (CaO) | % | 0.04 | 0.13 |
| Magnesium oxide (MgO) | % | 0.78 | 0.52 |
| Iron (III) oxide (Fe2O3) | % | 9.35 | 7.69 |
| Potassium oxide (K2O) | % | 5.32 | 1.66 |
| Sulfur trioxide (SO3) | % | 0.06 | 0.04 |
CH, high-plasticity clay; CL, low-plasticity clay; USCS, Unified Soil Classification System
POFA and alkaline activator
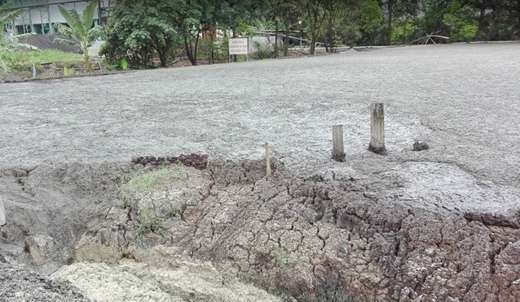
The POFA material was obtained from the Tenaga Sulpom Sdn Bhd thermal power station, Dengkil, Selangor, Malaysia. Figure 4 shows the site where POFA is discarded after being produced by the palm oil mill. As presented in Table 2, the chemical composition of the treated POFA contains a significant amount of silica, indicating its potential for forming an effective geopolymer.
Chemical compounds in the treated POFA
| Component | Content: % |
|---|---|
| Silicon dioxide (SiO2) | 43.52 |
| Aluminium oxide (Al2O3) | 24.70 |
| Calcium oxide (CaO) | 9.73 |
| Magnesium oxide (MgO) | 4.31 |
| Iron (III) oxide (Fe2O3) | 6.68 |
| Potassium oxide (K2O) | 1.56 |
| Sulfur trioxide (SO3) | 5.28 |
| Sodium oxide (Na2O) | 0.18 |
| Titanium dioxide (TiO2) | 0.44 |
| Chlorine (Cl) | — |
| Phosphorus pentoxide (P2O5) | — |
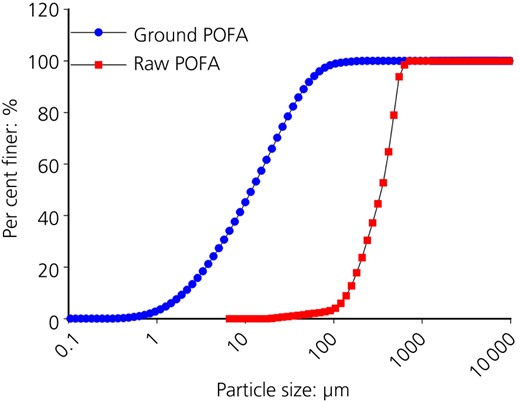
After being dried in an oven for 24 h at 105 ± 5°C (BSI, 1990), the POFA was sieved using a 300 μm sieve. The sieved POFA was ground in a rotating mill for 16 h, with over 30 000 cycles, to achieve suitable fineness (Islam et al., 2014; Ranjbar et al., 2014). Figure 5 shows the grain size distribution of POFA before and after grinding, demonstrating the efficiency of the process in reducing the particle size.
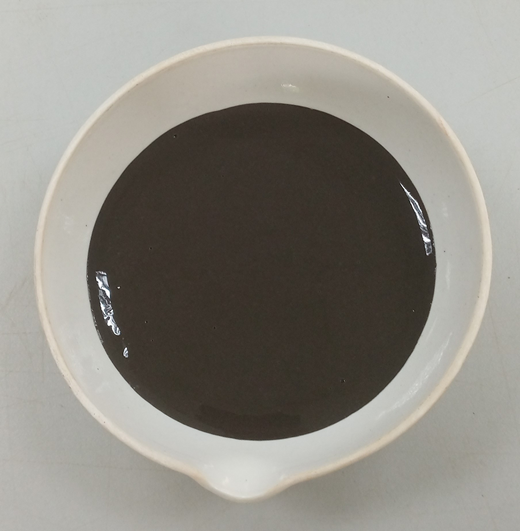
The ground POFA sample exhibited significant unburned carbon, as indicated by its loss on ignition (LOI) of approximately 9%. To address this, the ground POFA was heated for 1 h at 440°C using an electric heater (Pourakbar et al., 2017; Tangchirapat et al., 2007). This heating process reduced the LOI to approximately 1%. Table 2 presents the chemical composition of the treated POFA sample, as determined by X-ray fluorescence testing. As suggested by various researchers, the liquid alkaline activator (L) used in this study was a mixture of sodium hydroxide and sodium silicate solutions. Sodium hydroxide pellets were dissolved in distilled water to create a 12 M sodium hydroxide solution. The solution was allowed to cool for a day due to the high temperature produced upon mixing with water before being combined with sodium silicate. The sodium silicate/sodium hydroxide ratio was maintained at 2.5. A constant solid-to-liquid ratio (POFA/L) of 1.32 was employed. These geopolymer parameters provided the best strength for POFA-based geopolymer synthesis (Khasib and Daud, 2020; Salih, 2015). The mixing process was performed in a mixer for 10 min, sufficient to produce a homogeneous mixture. Figure 6 shows the prepared geopolymer before being applied to the soil.
Sample preparation
All samples tested in this study were prepared at their optimum moisture content (OMC) and maximum dry density (MDD), as indicated in Table 3. Samples were created with four dosages of the geopolymer, varying the POFA content between 10 and 40% (G10PA, G20PA, G30PA and G40PA). The same mixer used for making the geopolymer was utilised to blend the soils with free water and the geopolymer for approximately 10 min until the mixture was thoroughly homogeneous. Three identical specimens were prepared for each test to ensure uniformity and representativeness. The results were acceptable if they deviated by up to 5% from the mean (Teing et al., 2019).
Methods
One-dimensional consolidation test
Two sets of one-dimensional (1D) consolidation settlement tests (1D oedometer) were conducted to examine the soil consolidation characteristics before and after using the POFA-based geopolymer according to the British standard (BSI, 1990). Consolidation settlement is the vertical displacement in a soil specimen due to water expulsion from the voids, resulting in volume reduction. Series 1 included testing the untreated soil specimens of S1 and S2 (control samples). These samples were prepared at the OMC and compacted inside the oedometer ring with a 50 mm dia. and a 20 mm height. Then, samples were kept in plastic bags until they were returned to the lab, where they were well conserved with polyethylene sheets and cured. Series 2 included performing the test on the prepared stabilised samples. All treated samples at their OMC were compressed statically inside the consolidation ring in three equal layers to obtain the MDD (Latifi et al., 2018; Salimi and Ghorbani, 2020) and then tested immediately. The POFA-based geopolymer was poured into the soil, and an additional amount of water was added to reach the OMC to prepare the samples.
To illustrate the compressibility characteristics of the soil before and after treatment with the POFA-based geopolymer, the void-ratio-against effective-stress relationships for all samples tested were plotted on a normal scale. Two equations are used to find the void ratio (e) and change in the void ratio (Δe) of a soil specimen at the end of the loading increment:
where ΔH is the change in thickness of the soil specimen during the test; e0 is the initial void ratio at the beginning of the test; e1 is the void ratio at the end of each loading increment; H0 is the initial thickness of the soil specimen before conducting the test; and Hs is the height of solids, which equals Ms/A × Gs × ρw, where Ms is the mass of dry soil specimen after conducting the test, A is the area of the specimen, Gs is the specific gravity of the sample and ρw is the water density.
One of the terms used to express the compressibility of the clay used in this study is the coefficient of volume compressibility (mv). The volume change in a specimen can be expressed by the void ratio (e). Thus, if the effective stress increases from to , the void ratio will decrease from e0 to e1 then
Another term used to identify soil compressibility for all samples tested is the compression index (Cc), which can be calculated using the following equation:
However, the rebound part of the e–log σ′ curve was also used to calculate the swelling index (Cs) of treated and untreated samples.
According to Terzaghi’s theory of 1D consolidation settlement and since the consolidation settlement occurs because of water dissipation from voids found in soil, the coefficient of permeability (k) should be calculated. The coefficient of permeability (k) measures the flow of water inside the soil, and it is calculated using the following equation:
where Cv is the coefficient of consolidation and γw is the unit weight of water and equals 9.8 kN/m3. Although it is an empirical formula for estimating permeability, it has been proven efficient. Rajasekaran and Narasimha Rao (2002) used the same equation to estimate the permeability of marine clay stabilised with lime. Moreover, Jaditager and Sivakugan (2018) measured the permeability of dredged mud stabilised with a fly-ash-based geopolymer using the same equation. The consolidation test is a useful way to estimate the permeability of clay. In this study, to calculate the coefficient of consolidation (Cv), settlement-against-time curves were constructed using Taylor’s square root of time method. The Cv value was determined for each load based on the following equation:
where Hdr is the average height of the sample corresponding to two successive loads and t90 is the time required to achieve 90% consolidation in the soil sample.
California bearing ratio
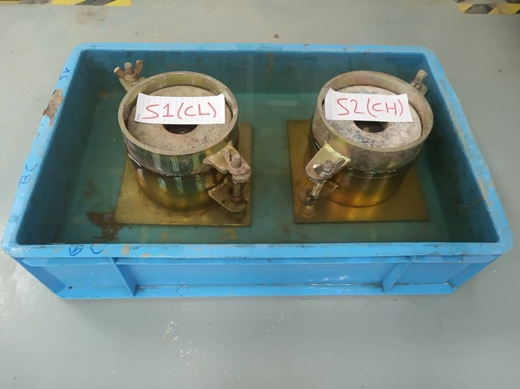
Although not commonly utilised in mechanical design, California bearing ratio (CBR) measurements provide a reliable indication of the load-bearing capacity and strength of subgrade soil, sub-base and base course materials in constructing roads and pavements. To simulate the most critical scenario in case of flooding or heavy rainfall that may happen to the subgrade material after the construction of pavement, soaked CBR tests were conducted on all soil samples in compliance with BS 1377 (BSI, 1990) at the OMC and MDD inside a CBR mould of 152 mm inner diameter by 127 mm height. All CBR specimens were soaked for 4 days (Figure 7) at a surcharge of 4.5 kg and then allowed to drain for 15 min before being tested. The CBR value of each specimen was calculated by expressing 2.5 and 5.0 mm penetrations as a proportion of the standardised force. All compacted specimens were subjected to a total penetration of 7.5 mm at a slow penetration rate of 1 mm/min, and readings were recorded at each 0.25 mm deformation. Figure 7 shows the samples soaking in water.
Microstructural and mineralogical analysis
FESEM AND EDX
The composition–microstructural changes of soils with and without treatment with a POFA-based geopolymer were investigated to understand the stabilisation mechanism. In this respect, FESEM analysis was used to identify and assort morphological surface changes (how the particles are coated with geopolymer gel) of naturally untreated soils and stabilised soil samples. Regarding sample preparation, the treated soil samples were crushed after consolidation testing to obtain suitable samples (approximately 5 mm dia.) for FESEM. Each sample was mounted on aluminium stubs with double-sided tabs made of carbon and then coated with a thin layer of platinum in a sputter coater to provide surface conductivity and reduce the charges. The magnification ranged between ×1000 and ×4000 to provide accurate photographs.
XRD TEST
The XRD technique is widely recognised as one of the most essential methods for characterising mineralogical transformations and crystallography in soils. Both natural soil samples and some stabilised specimens were analysed using an X-ray diffractometer from Shimadzu (model XRD-6000). This apparatus employs copper (Cu) Kα radiation to generate X-rays in the 5–80° (2θ) range, which has 0.05°/s scanning intervals and operates at 30 kV. To prepare test specimens, approximately 1–2 g of the required sample (untreated or stabilised specimens) was crushed inside a mortar with a hand pestle to provide them in powder form for testing. The ground powder samples were placed in sample holders after being separated for the XRD test. The revealed peaks were identified using the standard line patterns in the powder diffraction file database and compared with different XRD analyses in the literature.
Results and discussion
California bearing ratio
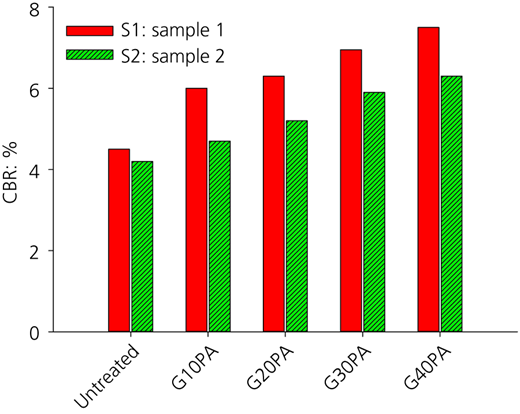
The graphical relationship between load and penetration for whole specimens under soaked conditions is presented in Figure 8. The results showed that treatment of both soils with the POFA-based geopolymer resulted in a slight and minor improvement in the values of CBR compared with those of untreated soils. The S1-G40PA and S2-G40PA mixtures gave the highest load-carrying capacity among all mixtures of soils. The CBR value of 4.5% for the untreated S1 specimen rose to 7.5% for S1-G40PA, approximately 1.7 times the untreated value. In contrast, the CBR value of untreated S2 was 4.2% and grew to 6.3% for S2-G40PA (nearly 1.5 times that of the untreated sample). This small and poor enhancement in the CBR values is attributed to soaking samples where the alkaline activator might be diluted when placed in the water tank. Curing under dry conditions is mainly preferred since it encourages reactions of geopolymerisation. The temperature in dry curing is higher than under wet or soaked curing conditions, which may encourage the removal of water, making the silicon and aluminium ions have more contact and raising the pH of the mixture, resulting in more dissolution.
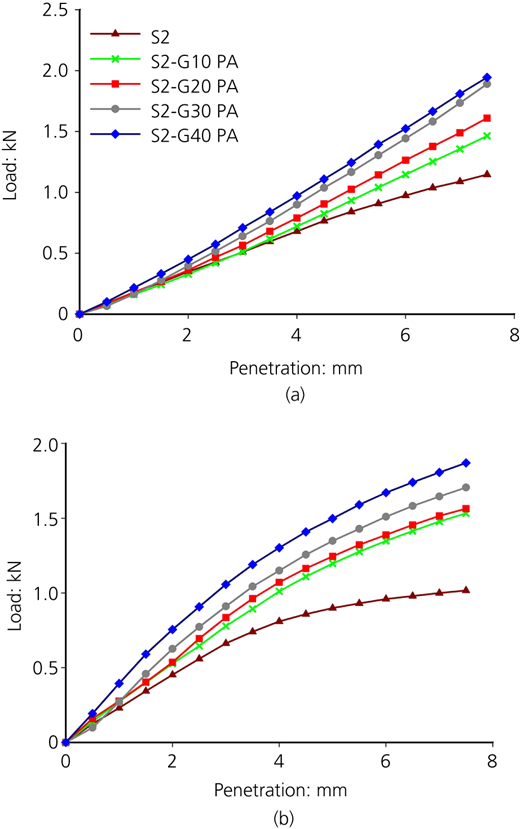
Load-against-penetration behaviours of samples (a) S1 and (b) S2 after treatment with the POFA-based geopolymer
Load-against-penetration behaviours of samples (a) S1 and (b) S2 after treatment with the POFA-based geopolymer
On the other hand, under soaked conditions, even if aluminium and silicon ions are dissolved in the solution, more water may keep them apart, preventing or hindering the polycondensation and formation of the gel.
The load–penetration graphs were used to calculate the CBR value, and the results are shown in Figure 9. Based on this, it can be legibly seen that the geopolymer mixture with 40% POFA by soil weight (G40PA) is the most suitable compared with all the other mixes. According to the Road Engineering and Geotechnics Department of Malaysia, a minimum CBR value of 5% is recommended for subgrades supporting traffic loads in pavement construction (Hassan et al., 2013). Accordingly, all specimens stabilised with the POFA-based geopolymer meet this requirement (more than 5%) except for the S2-G10PA mixture (4.7%).
Consolidation behaviour
Void ratio, e
Results showing the relationship between the specimen void ratio (e) and the applied vertical effective stress (σ) obtained from compressibility testing for untreated and treated soils at different POFA-based geopolymer dosages are indicated in Figure 10. The results of treated samples give a similar pattern to that obtained for natural clay soils. For all treatment cases with the geopolymer, the void ratios declined as the pressure increased from 25 to 400 kN/m2 during the stage of loading, and the void ratio rose when pressure was removed at the stage of unloading. This void ratio reduction was anticipated because an increasing pressure will help soil particles compress, allowing voids to be filled and disappear. Moreover, the void ratio (e) of the geopolymer-stabilised samples decreased when the POFA-based geopolymer dosage increased. The initial void ratio of the S1 soil was significantly reduced after treatment from 0.70 to 0.64 with G10PA, to 0.61 for G20PA, to 0.59 with G30PA and to 0.56 with G40PA, whereas for the S2 soil, it decreased from 1.43 to 0.94 with G10PA, to 0.75 with G20PA, to 0.59 with G30PA and to 0.43 with G40PA. At the highest vertical loading (400 kN/m2), the void ratio decreased from 0.57 for S1 to 0.50 for S1-G40PA, whereas it decreased from 0.76 for untreated S2 to 0.26 for S2-G4PA. This reduction in the void ratio of the stabilised samples may be attributed to the lubrication induced by the geopolymer, which decreased the volume of air pockets significantly among soil particles throughout compaction. Also, including smaller particles (POFA particles) found in the geopolymer inside the parent soil can minimise compressibility by filling the voids. Furthermore, the existence of water decreased the molarity of the alkali activator, thus minimising the polymerisation reaction possibility during the loading and testing time. A similar behaviour was seen by Chen et al. (2020) when conducting 1D oedometer tests on soil stabilised with alkali-activated fly ash as a partial replacement for cement, concluding that the geopolymer decreases the void ratio of soils treated.
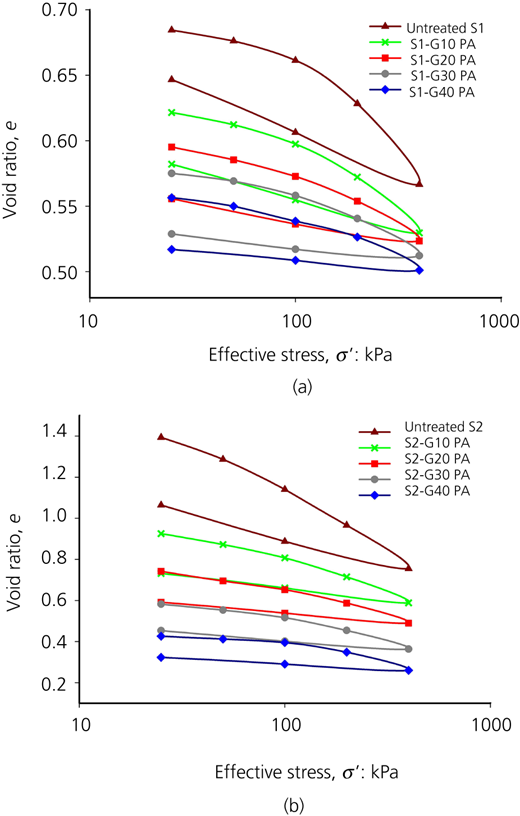
Variation of void ratio (e) with effective stress (σ′) and geopolymer dosage: (a) S1; (b) S2
Variation of void ratio (e) with effective stress (σ′) and geopolymer dosage: (a) S1; (b) S2
The compression index (Cc) was measured using the e–log σ compression curves, whereas the swelling index (Cs) was calculated from the expansion part. The variations of the Cc of the treated samples with various geopolymer dosages are shown in Figure 11. The results demonstrate that the addition of the POFA-based geopolymer to the clayey soils is accompanied by a decrease in compression and swelling indices (Cc and Cs), and these changes are significantly greater in S2-treated samples compared with those in S1 samples. From untreated S2 to S2-G20PA, Cc decreased from 0.70 to 0.32 (approximately 40% reduction), declining very slowly beyond that. A similar behaviour was observed in S1 soil but with a lower rate of change compared with that in S2 (between 0.21 and 0.10 from untreated S1 to S1-G20PA, reaching 0.08 at S1-G40PA). With regard to the swelling index (Cs), it decreased from 0.07 for untreated S1 to 0.01 for S1-G30PA and remained constant until S1-G40PA, while it dropped from 0.22 for untreated S2 to 0.05 for S2-G40PA.
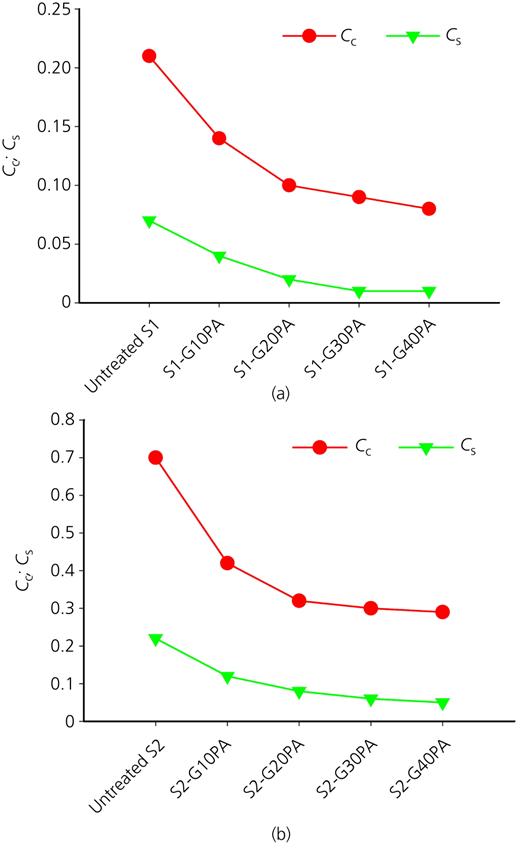
Cc and Cs of untreated and POFA-based geopolymer-treated soils: (a) S1; (b) S2
Cc and Cs of untreated and POFA-based geopolymer-treated soils: (a) S1; (b) S2
According to Mitchell and Soga (2005), a Cc value higher than 0.4 indicates high compressibility, a Cc value between 0.2 and 0.4 implies moderate compressibility and a value less than 0.2 indicates low compressibility based on the type of cohesive soil studied. In this respect, the untreated S1 can be classified as an intermediate-compressibility soil, whereas the untreated S2 can be classified as a soil with high compressibility. After treatment, all treated S1 samples were classified as low-compressibility soil (Cc less than 0.2). At the same time, S2 stabilised specimens were identified as intermediate-compressibility soils except for the S2-G10PA sample, which remained highly compressible.
The values of the compressibility coefficient (mv) of both soils stabilised with the POFA-based geopolymer with their averages are shown in Table 4. Based on the value of mv, soil can be classified as high-compressibility soil if mv > 0.3 m2/MN, medium-compressibility soil if mv is between 0.1 and 0.3 m2/MN, low-compressibility soil when mv is between 0.05 and 0.10 m2/MN and very-low-compressibility soil when mv is below 0.05 m2/MN. The initially determined average mv value of the untreated S1 and S2 for pressures up to 400 kPa are equal to 0.23 and 0.95 m2/MN, which indicates that they are considered medium- and high-compressibility soft soils, respectively.
mv values of soil samples at various loading stages
| Additive | Coefficient of volume compressibility, mv | |||||||||||
|---|---|---|---|---|---|---|---|---|---|---|---|---|
| 25 kPa | 50 kPa | 100 kPa | 200 kPa | 400 kPa | Average | |||||||
| S1 | S2 | S1 | S2 | S1 | S2 | S1 | S2 | S1 | S2 | S1 | S2 | |
| Untreated | 0.38 | 0.65 | 0.20 | 1.76 | 0.17 | 1.20 | 0.19 | 0.72 | 0.18 | 0.43 | 0.23 | 0.95 |
| G10PA | 0.34 | 0.26 | 0.23 | 1.10 | 0.18 | 0.67 | 0.15 | 0.48 | 0.18 | 0.33 | 0.21 | 0.57 |
| G20PA | 0.28 | 0.24 | 0.24 | 1.08 | 0.16 | 0.49 | 0.12 | 0.37 | 0.09 | 0.28 | 0.18 | 0.49 |
| G30PA | 0.28 | 0.24 | 0.15 | 0.72 | 0.14 | 0.46 | 0.11 | 0.39 | 0.09 | 0.29 | 0.15 | 0.42 |
| G40PA | 0.22 | 0.19 | 0.17 | 0.38 | 0.15 | 0.24 | 0.08 | 0.33 | 0.08 | 0.31 | 0.14 | 0.29 |
The findings revealed that the average compressibility coefficient (mv) declined after stabilisation with the geopolymer. In other words, the POFA-based geopolymer increased the stiffness of the soils. The average mv values of all S1 treated samples ranged between 0.21 and 0.14 m2/MN, whereas those of S2 mixtures varied between 0.57 and 0.29 m2/MN for geopolymer dosages from G10PA to G40PA, respectively (Table 4). According to the classification, all treated S1 samples had medium compressibility, meaning no change in the classification compared with the untreated S1 was noted. The treated S2 samples were classified as highly compressible except for S2-G40PA, which showed a medium-compressibility behaviour.
The low-compressibility behaviour of the samples was related to the flocculation reaction that arose among the clay minerals cations and the ions that had been formed from the binder. With the rise in the binder content in both the soil samples, the flocculation reactions were more noticeable since a greater number of cations were expelled from the clay matrix by other binder ions, resulting in a dense flocculated structure.
Pre-consolidation pressure,
The pre-consolidation pressure (sometimes called yielding stress), which explains the stress history of the soil obtained from compressibility tests on all samples, is shown in Table 5 as calculated based on the Casagrande method. It is observed that the yielding stress increased in POFA-based geopolymer-treated specimens compared with that in untreated samples. Yielding stresses of 133 and 85 kPa for the untreated S1 and S2 were found. After treatment with G10PA, G20PA, G30PA and G40PA dosages by weight of dry soil, the yielding stress rose to 142, 151, 156 and 163 kPa for S1 and 108, 119, 128 and 140 kPa for S2, respectively. Generally, the pre-consolidation pressure of the geopolymer-treated S1 specimens grew approximately 1.0–1.2 times compared with that of the untreated S1, while that of treated S2 samples increased from 1.0 to 1.6 times compared with that of the untreated S2. This increment in the yielding stress can be attributed to the substantial increase in the dry density after treatment compared with the dry density of untreated samples, thus increasing the maximum pressure that soil can carry. A similar behaviour for pre-consolidation pressure was noted when treating the soil with cementing materials (Federico et al., 2015; Kamruzzaman et al., 2009).
Coefficient of consolidation, Cv
The coefficient of consolidation refers to how long it would take for the sample to compress. Two considerations control the coefficient of consolidation: the volume of water squeezed out and the rate at which water may flow out. The lower the Cv value within the soil, the lower the permeability. In general, Table 6 indicates that the POFA-based geopolymer content could reduce the consolidation coefficient. At 400 kPa, for example, Cv declined from 1.57 and 1.63 m2/year for untreated S1 and S2, respectively, to 1.16 and 1.03 m2/year for S1-G40PA and S2-G40PA, respectively. The reduction in Cv values with an increasing dosage of the POFA-based geopolymer results from a change in the soil structure due to the geopolymer occurring between soil particles, resulting in a dense and compact mixture. Consequently, the time necessary to attain primary consolidation is extended for soils treated with geopolymers, even for a specified level of consolidation and drainage pathway.
Cv values of specimens at different loading stresses
| Additive | Coefficient of consolidation, Cv: m2/year | |||||||||
|---|---|---|---|---|---|---|---|---|---|---|
| 25 kPa | 50 kPa | 100 kPa | 200 kPa | 400 kPa | ||||||
| S1 | S2 | S1 | S2 | S1 | S2 | S1 | S2 | S1 | S2 | |
| Untreated | 7.06 | 7.02 | 5.76 | 6.10 | 3.50 | 4.10 | 2.61 | 2.92 | 1.57 | 1.63 |
| G10PA | 4.91 | 5.86 | 4.13 | 4.76 | 3.05 | 3.28 | 2.62 | 1.82 | 1.33 | 1.30 |
| G20PA | 4.92 | 4.92 | 3.57 | 4.06 | 3.06 | 2.54 | 2.34 | 2.11 | 1.35 | 1.25 |
| G30PA | 3.23 | 3.62 | 2.74 | 4.10 | 2.71 | 3.38 | 2.10 | 1.72 | 1.25 | 1.15 |
| G40PA | 3.15 | 5.87 | 2.74 | 3.03 | 2.35 | 2.43 | 2.11 | 1.63 | 1.16 | 1.03 |
Coefficient of permeability, k
Figure 12 shows the effect of the POFA-based geopolymer on the coefficient of permeability (k) of S1 and S2 samples. The proponents of this paper aim to study the impact of the binder content on the permeability coefficient at a 400 kN/m2 pressure because it is the highest and most critical stress applied to the soil. As expected, the permeability of original soil samples is comparatively high (0.89 × 10⁻¹⁰ and 2.20 × 10⁻¹⁰ m/s for untreated S1 and S2, respectively), whereas that of POFA-based geopolymer-treated specimens gradually decreases with the rise in POFA-based geopolymer dosage (a higher POFA-based geopolymer concentration led to a larger reduction). The permeability coefficient of all the geopolymer-treated specimens declined to its minimum at a G40PA geopolymer content at values of 0.29 × 10⁻¹⁰ and 0.98 × 10⁻¹⁰ m/s for S1-G40PA and S2-G40PA, respectively. Hydraulic conductivity represents the ease with which water can travel through the interconnected voids within the soil. However, using materials in highway construction depends on the degree of permeability that defines whether the planned road base is acceptable for use and allows the drainage of pavement systems to be constructed. The coefficient of permeability (k) of both the untreated and the POFA-based geopolymer-treated soil samples at stress levels of 400 kPa was determined on the specimens kept saturated in the oedometer cell. The effectiveness of the POFA-based geopolymer in reducing the permeability may be attributed to the penetration of geopolymer components (POFA and alkaline activator) within the soil matrix. In addition to filling the voids in the stabilised specimens and impeding water flow, these materials also improve the bonding between the stabilised material and the soil particles. The exchange of free cations in the geopolymer with the adsorbed cations of clay minerals leads to a reduction in the size of the water layer that diffuses over the clay particles. This drop in the diffuse water layer makes it easier for the clay particles to come into direct contact with each other, allowing soil voids to become fewer or filled, thereby obstructing the flow of water.
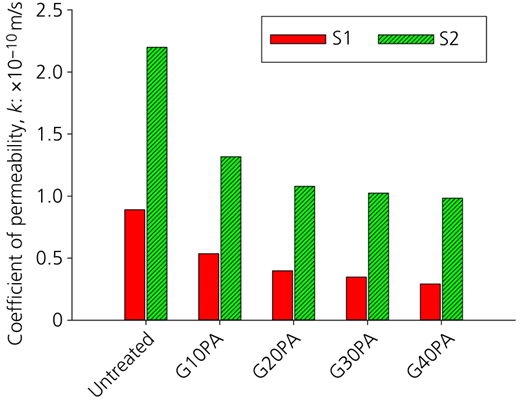
Coefficient of permeability (k) of both untreated and treated specimens under 400 kPa stress
Coefficient of permeability (k) of both untreated and treated specimens under 400 kPa stress
Microstructural analysis
Structural and morphological analysis
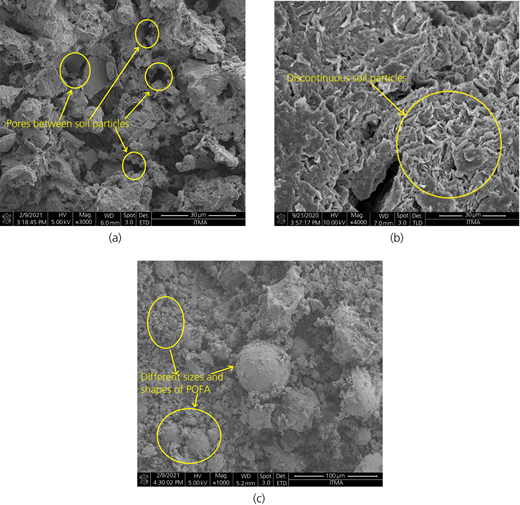
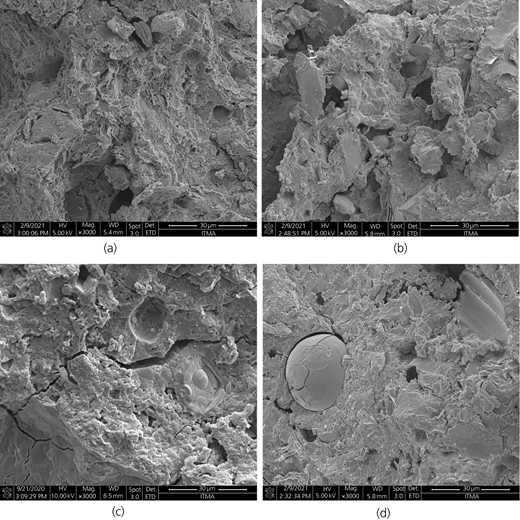
To investigate further the stabilisation mechanism, FESEM micromorphology images of untreated samples (S1 and S2) and several samples stabilised with the POFA-based geopolymer (S1-G20PA, S2-G20PA, S1-G40PA and S2-G40PA) are presented in Figures 13 and 14, respectively. The density of the mixture and the distribution of the binder within soil particles were evaluated by testing S1-G20PA, S2-G20PA, S1-G40PA and S2-G40PA. Figure 13(a) reveals that untreated sample S1 exhibits a significantly porous structure and weak connections between soil particles, resulting in noticeable pores. In contrast, the clustered particle shapes shown in Figure 13(b) pertain to the separate soil particles in untreated sample S2, which possess a flaky and fragile structure, showing organisation and arrangement between particles (particles coming closer to one another) due to the impact of compaction. Figure 13(c) shows the morphology of treated POFA particles in which different sizes (well-graded distribution) and shapes can be found. Particle sizes range from small to large, with non-spherical and spherical shapes. However, the FESEM images in Figures 14(a)–14(d) suggest that the activator solution had a chemical impact on the POFA precursor, resulting in internal particle changes.
FESEM micrograph images: (a) S1-G20PA; (b) S2-G20PA; (c) S1-G40PA; (d) S2-G40PA
FESEM micrograph images: (a) S1-G20PA; (b) S2-G20PA; (c) S1-G40PA; (d) S2-G40PA
The surface morphology gradually became denser, and the pores started to be filled with the newly formed skeleton after treatment. Formation and development of cement materials were observed after treatment with G20PA, in which some pores were filled in the structure of the soil, and particles were gradually gathered as a unit (Figures 14(a) and 14(b)). As the POFA-based geopolymer dosage increased, the mixture displayed an increasingly compact microstructure (Figures 14(c) and 14(d)). The treated samples (S1-G40PA and S2-G40PA) experienced a significant enhancement in the soil structure with a denser state, probably by the further arrangement of particles and extra cementing materials due to the existence of the binder. This improvement is mainly attributed to the artificial cementation product deposition and the consequent development of bonds within soil particles throughout curing, which led to considerable modifications in the surface of the soil particles. The mechanism for improvement could be clarified through the creation of the primary geopolymer gel, which is sodium aluminate silicate hydrate (N-A-S-H). This gel builds a robust 3D network of Si–O–Al and Si–O–Si, which aligns with improved consolidation results. However, the mixture of S2-G40PA displayed a degree of roughness, and the particles were not as well coated with the gel as compared with S1-G40PA, which exhibited a more uniform structure. This degree of roughness suggested that the soil type dramatically influenced the effectiveness of the geopolymer in enhancing soil properties. The unreacted POFA particles during the polymerisation phase indicated the incomplete chemical reaction of the substances in the alkaline environment. The dissolution of the smallest particles was responsible for the fast reaction, while the larger particles were the primary reason for the advanced geopolymer reaction improvement. A similar behaviour was obtained in the study by Phummiphan et al. (2016), in which the enhancement of the geopolymer-stabilised soil properties was attributable to the gradual dissolution of fly ash with a particular concentration of activator. Studies have shown that low-calcium fly-ash-based geopolymers generate N-A-S-H as the primary gel, exhibiting a substantially reduced and slower calcium silicate hydrate gel formation.
Mineralogical analysis
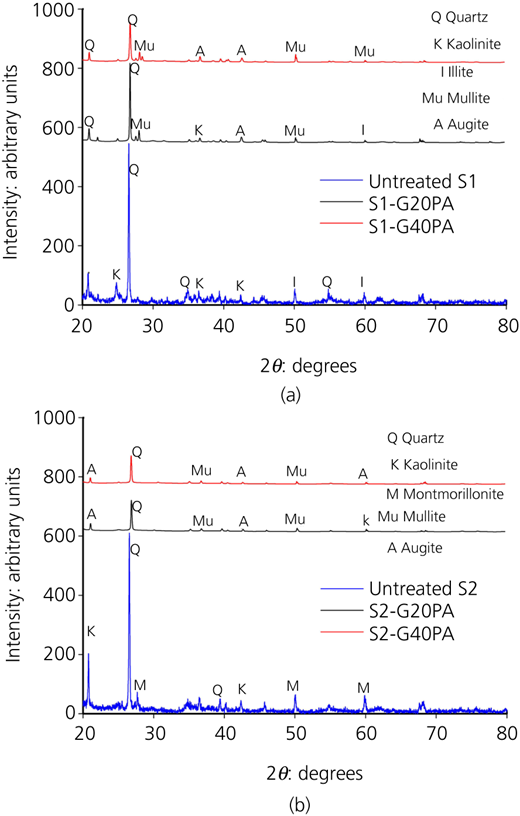
XRD is a vital method for analysing crystalline compounds in clay mineralogy. Figure 15 shows the XRD patterns of untreated S1 and S2 and POFA-based geopolymer-stabilised specimens (S1-G20PA, S2-G20PA, S1-G40PA and S2-G40PA) after 28 days of curing. The sharp peaks of the untreated S1 primarily consist of quartz, kaolinite and illite, while those of the untreated S2 consist of quartz, kaolinite and montmorillonite. However, quartz is the most dominant mineral in both samples, indicated by the peaks at 2θ values of 20.82, 26.56, 34.88 and 54.04° in S1 and 26.56 and 39.36° in S2. After treatment with the geopolymer, the diffractograms show some visible variations in the mineralogy. The intensities of peaks linked to kaolinite, montmorillonite and illite decreased noticeably in both soils and almost disappeared, particularly with the G40PA geopolymer dosage, whereas that of quartz decreased moderately. The decline in peak intensities and disappearance of the peaks of kaolinite, montmorillonite and illite could be attributed to their low intensities and the masking effect caused by the amorphous geopolymer gel (Zhang et al., 2013). The presence of an amorphous phase on the surface of crystals can also be responsible for the weakening of silica peaks (Chen et al., 2016). Additional peaks corresponding to mullite (Mu) and augite (A) can be seen in the XRD patterns of treated specimens in both soils, which are an indication of geopolymerisation and gel formation (Syed et al., 2020). More peaks corresponding to these minerals were observed with an increasing dosage of the geopolymer from G20PA to G40PA. However, the overall changes in the XRD patterns, decreasing intensity of some minerals and/or absence of others are attributed to the disruption of an organised layered structure in the geopolymer-stabilised soils (Miao et al., 2017; Murmu and Patel, 2020). Finally, the XRD findings align with the enhanced mechanical properties observed in specimens stabilised using the POFA-based geopolymer. The enhancement of the mechanical properties may also be linked to the increased gel formation rate in the soil mass.
In general, the results above indicate some changes in the geotechnical properties of the soil after applying different dosages of the POFA-based geopolymer. The results of CBR, FESEM and XRD agree with the results found by research in the literature in which geopolymers have affected these properties for different types of soil. Regarding the consolidation behaviour, very limited research has been conducted to understand the settlement behaviour as well as the mechanism behind that, which was illustrated by this study using different dosages of geopolymer. However, the use of this technique in full site stabilisation should be studied extensively. Few samples from different locations in the site being stabilised should be taken to determine the OMC and MDD. This is crucial to prepare the geopolymer at the correct liquidity (if a soil in the site is after the OMC, the geopolymer must be a drier than the normal). A vibratory soil compactor is needed after mixing the soil with the geopolymer to compact the soil many times to ensure achieving the highest dry density. After that, several samples should be extracted and measured in terms of the dry density and shear strength to ensure the correctness of the procedure used.
Finally, this research was conducted to test the properties of an underlying soil layer such as a subgrade layer in terms of its strength and settlement. Based on the results indicated by this study, the stabilisation of soft soil using the POFA-based geopolymer showed an increase in the strength (CBR value) and a subsequent decrease in the settlement of the underlying layer, which indicated its capability to carry the loads imposed on it.
Conclusion
The objective of this study was to examine how the utilisation of a POFA-based geopolymer could enhance the stabilisation of clayey soil, thereby addressing the challenges associated with weak soil. This approach also has the potential to reduce energy consumption and make efficient use of locally available agricultural waste, which contributes to environmental preservation.
Regarding CBR values, the treated specimens of both soils were shown to have a small enhancement under soaked conditions. The tiny improvement in CBR values was attributed to water, which reduced the pH of the mixture and hindered the geopolymerisation reaction. The compressibility behaviour and consolidation properties were enhanced due to geopolymer stabilisation. A reduction in void ratios, compression index and swelling index at various geopolymer dosages was observed. As a result, volume compressibility and permeability coefficients decreased, which indicated a dense soil matrix and a reduction in the interparticle voids associated with the POFA-based geopolymer.
The use of the POFA-based geopolymer in both low- and high-plasticity clay soils had a notable impact on the soil structure. In treated mixtures, the individual soil particles appeared to be more strongly bound together, with the voids filled, resulting in a considerable enhancement in strength, which was supported by the findings from FESEM analysis. The XRD revealed new minerals formed, an indication that a geopolymerisation reaction took place.
Acknowledgement
The Civil Engineering Department of the Engineering Faculty of Universiti Putra Malaysia offered technical and partly financial assistance, for which the authors would like to convey their sincere thanks and appreciation.

