
The investigation of river levees holds significant implications for mitigating flood damage. Sand boiling, backward erosion piping, and phenomena manifesting along the riverside of levees directly imperil the integrity of these structures. It is imperative to address these phenomena comprehensively to safeguard both lives and property amid flood events. The principal aim of this research is to delineate the variances in geotechnical conditions between sand boils observed at slope toes on the landside and those occurring at a distance from this region along the levee. Therefore, this study conducted extensive boring investigations at sites where sand boils occurred. The soil samples sampled from the boring investigations were analysed for grain size. The results of a series of geotechnical investigations showed that in the cases where sand boils occurred near the toe of the slope, a series of sandy soils with grain size characteristics similar to those of the sand boils were deposited in the foundation of the levee. On the other hand, in the case where the sand boil occurred far from the toe of the slope, sandy soil with grain size characteristics similar to that of the sand boil was deposited only on the landside.
Notation
Introduction
The investigation of river levees holds significant implications for mitigating flood damage. Sand boiling, backward erosion piping, and other deformation along the landside of levees directly imperil the integrity of the levee. It is imperative to address these phenomena comprehensively to safeguard both lives and property amid flood events. Figure 1 shows a scenario depicting levee damage and failure resulting from sand boil and backward erosion piping occurrences. Sand boils and backward erosion piping are more likely to occur when the foundation ground of a levee consists of multiple layers, particularly when the upper layer has low permeability and the lower layer has high permeability. When the river water level rises, pore water pressure develops in the highly permeable lower layer. Generally, the total head decreases from the river channel towards the landside, resulting in seepage pressure acting on the lower layer. As seepage pressure increases, the hydraulic gradient near the landside toe increases, and sand boils occur upon reaching the critical hydraulic gradient. If the seepage pressure rises, the soil in the lower layer becomes fluidised, ejecting and depositing on the landside (see Figure 1(a)). If the high river water level persists and backward erosion piping progresses, the foundation ground’s bearing capacity decreases. Concurrently, the soil deposited on the landside due to sand boils also increases (see Figure 1(b)). As the bearing capacity decreases, deformation occurs in the levee, eventually leading to a large-scale slope failure of the levee (see Figure 1(c)). This process poses a significant threat to the structural integrity of the levee (Foster et al., 2000). Lastly, backward erosion piping denotes the gradual erosion of soil contrary to the direction of seepage pressure, resulting in the progressive degradation of the levee’s internal structure and foundation (Bligh, 1910; Terzaghi, 1943; Van Beek et al., 2015; Vandenboer et al., 2018). These phenomena stem from water infiltration into levee materials, inducing dynamic alterations therein.
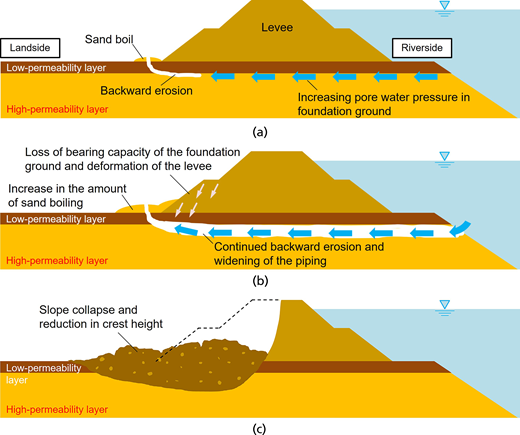
Levee failure scenario with backward erosion piping. (a) River water infiltration and initiation of backward erosion piping. (b) Backward erosion piping widens, and the bearing capacity of the embankment foundation declines. (c) Collapse of the embankment slope and settlement of the crest
Levee failure scenario with backward erosion piping. (a) River water infiltration and initiation of backward erosion piping. (b) Backward erosion piping widens, and the bearing capacity of the embankment foundation declines. (c) Collapse of the embankment slope and settlement of the crest
In recent years, Japan has witnessed a surge in flood magnitudes attributable to climate change, consequently leading to a heightened frequency of sand boils (Kawajiri et al., 2019; Mukinoki et al., 2021; Nishimura et al., 2020; Yasuda et al., 2016). Notably, sand boils were observed along the Kinugawa River in 2015, with a concentration of occurrences at slope toes on the landside. The schematic representation in Figure 1 rationalises this concentration, as the slope toe on the landside represents the most susceptible area to propagating seepage pressure from the river channel to the foundation ground.
Throughout recent decades, numerous scholars have dedicated their efforts to scrutinising these phenomena, endeavouring to unravel their mechanisms of manifestation and their consequential impacts on levees, employing diverse experimental and theoretical methodologies. Bligh (1910) integrated seepage length considerations into assessing dam efficacy against internal erosion. Terzaghi (1943) formulated a theoretical framework for backward erosion piping within the soil mechanics domain, establishing a seminal groundwork for subsequent investigations. Foster et al. (2000) conducted a comprehensive statistical analysis of historical instances of piping-induced damage, scrutinising the relative influence of specific variables on the probability of piping occurrence and slope instability through rigorous comparisons between failed dams and the broader dam population. Jewel et al. (2019) employed theoretical analysis to discern the effect of increasing hydraulic gradient on the critical shear stress for sediment entrainment under seepage flow conditions. Okamura et al. (2022) performed meticulous 1g and centrifuge experiments. They indicated the predominant influence of the water velocity within the conduit and the hydraulic gradient on the rate of piping progression. In parallel, Pol et al. (2021) conducted tests utilising a large-scale test levee featuring a dike height of 1.8 m. The tests revealed pipe volumes that were more substantial than those in extant laboratory investigations and established an approximately linear correlation between pipe length and volume. This finding underscores the validity of laboratory simulations, as few instances of sand boil and piping were observed in the field. Robbins et al. (2020) quantified the hydraulic head loss associated with sand boils along the Mississippi and Wahl Rivers, contrasting their observations with predictions derived from empirical and theoretical models. Specifically, the measured head loss exhibited a non-constant pattern dependent on grain size, sand boil throat diameter, and flow rate, prompting ongoing model-based investigations to clarify the modes and underlying factors that govern sand boil and piping occurrences. Nevertheless, there remains a need for comprehensive case studies that provide detailed accounts of river water levels, soil conditions within and beyond levees, and levee soil properties during sand boil and piping events in field settings.
Enhanced comprehension of levee erosion, piping, and backward erosion is imperative for advancing levee design, management, and mitigating flood hazards. Future research endeavours should prioritise clarification of the intricate mechanisms governing these phenomena, innovation of protective measures, and refining of extant methodologies for assessing levee safety. Accordingly, there is a pressing need to align experimental and analytical conditions with real-filed contexts. Therefore, elucidating the geotechnical conditions prevailing in the field where sand boils occur assumes paramount significance.
The principal aim of this investigation is to delineate the variances in geotechnical conditions between sand boils observed at slope toes on the landside and those occurring at a distance from this region along the levee. This study conducted extensive geotechnical investigations to understand the soil conditions around the areas where sand boils occurred. The novelty of this study is to explain the differences in the occurrence patterns of sand boils based on these results. A comprehensive geotechnical investigation was conducted using simplified and rotary borings to ascertain soil profiles across the landside, riverside, and levee areas. In addition, a surface wave survey was conducted to derive a two-dimensional S-wave velocity, VS, distribution while interpolating borehole findings was enabled. Furthermore, particle-size analysis was conducted on soil specimens from both boreholes and the sand boil site to delineate the sand boil’s origins. Subsequently, the study deliberates upon sediment generation mechanisms and levee stability considerations.
Overview of survey sites and observed river levels
On 17–23 August 2016, Hokkaido in Japan experienced a historic occurrence as three typhoons caused landfall consecutively. This event marked the first recorded instance of such phenomena transpiring in the region. Notably, the eastern precincts of Hokkaido traditionally receive scant precipitation; therefore, the flooding caused by these typhoons caused significant damage to geotechnical structures in the Tokoro River basin.
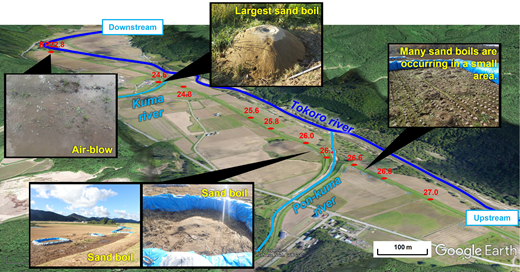
Figure 2 shows the locations within the Hiyoshi and Fukuyama regions of Tokoro-cho, Kitami City, and Hokkaido, where river levee deterioration due to sand boils was particularly concentrated. The annotation ‘K.P.’ in the figure indicates the distance from the river mouth, which is set to ‘0.0 km’. As shown, the Tokoro River meanders through a mountainous terrain, traversing a constricted pass. Consequently, the river channel typically spans a width of 100–200 m narrower than its upper and lower reaches, with the affected segment being particularly susceptible to prolonged elevation and retention of water levels.
Sand boil locations in Hiyoshi and Fukuyama areas, Tokoro-cho (additions to Google Earth)
Sand boil locations in Hiyoshi and Fukuyama areas, Tokoro-cho (additions to Google Earth)
Figure 3 shows the river water levels observed at the Futochanae Water Level Observatory (KP18.6, left bank) and the rainfall measurements from the Kitami Rainfall Observatory (KP49.4, right bank). Note that the cumulative rainfall shown in Figure 3 was reset to zero if no rainfall is observed for 6 h. This method of calculating cumulative rainfall is based on the method used in Japan for designing river levees. These observatories are located near the Hiyoshi and Fukuyama areas within Tokoro-cho, Kitami City. The following exposition outlines the meteorological conditions during the above week, which was characterised by the landfall of three successive typhoons on Hokkaido. The first typhoon, designated Typhoon No. 7, made landfall near Cape Erimo in southern Hokkaido at about 5:30 p.m. on August 17 and weakened to a tropical storm by 9:00 p.m. on the same day in north-eastern Hokkaido. This meteorological event precipitated prolonged rainfall in the eastern part of Hokkaido. In particular, the cumulative rainfall for the week from 16–23 August 2016 at the Tokoro River basin rainfall observation stations of Oketo, Kitami, and Kamikawazoe broke the maximum record observed in 1992. More specifically, the maximum amounts of precipitation were recorded as 335 mm in Oketo (up from 221 mm), 239 mm in Kitami (up from 232 mm), and 208 mm in Kamikawazoe (up from 177 mm). For more details, refer to Kawajiri et al. (2019). The Tokoro River, swollen by the torrential rains, exceeded the design high-water level of the levee at approximately 7:40 a.m. on the 18th, as shown in Figure 3. This breach of the levee’s capacity underscores the severity of the event.
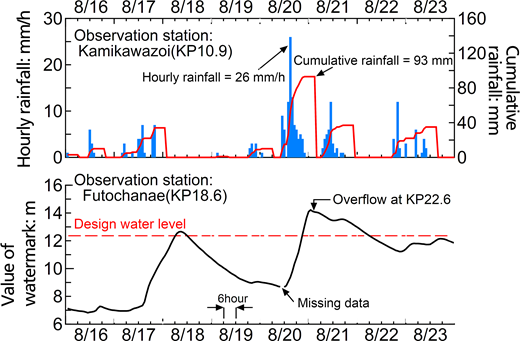
Notably, air-blow phenomena were observed at the slope toe on the landside and the left bank’s landside near KP22.8, as reported by Kawajiri et al. (2019). After intermittent rainfall on the 19th, characterised by the influx of warm and moisture-laden air converging upon a lingering frontal system, the trajectory of Typhoon No. 11 followed, following a northward track off the Sanriku coast before making landfall in western Hokkaido after 23:00 on the 21st. After that, it passed through eastern Hokkaido in the early hours of the 22nd, so rainfall was observed on the 22nd and 23rd in Figure 3. Concurrently, Typhoon No. 9, the third typhoon, caused landfall in southern Hokkaido at approximately 6:00 a.m. on the 23rd, traversing the Sea of Okhotsk before attenuating to a tropical storm. The cumulative impact of escalating river levels caused by the successive downpours precipitated the breach of the Tokoro River levee near tributary confluences, resulting in the inundation of roads and fields due to overflow. In addition, instances of sand boils, which, intriguingly, were absent during the initial typhoon, were also present.
Location and method of geotechnical survey
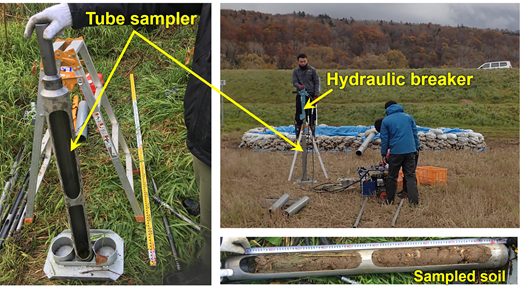
Figures 4(a) and 4(b) show the plan view of the sites designated for geotechnical investigations and the comprehensive details of said investigations, respectively. Notably, a sand boil, measuring approximately 2.0 m in diameter and 0.5 m in height, emerged at the slope toe on the landside near KP24.6, representing the largest among those engendered within the Tokoro River during the 2016 flood. A meticulous survey was conducted at this locale to discern the soil profile traversing the transverse axis of the levee, with the specific objective of elucidating the provenance of the sand boil. Simplified and rotary boring techniques were employed to probe landside, riverside soils, and levee foundations. After sample acquisition from sand boils and boreholes, a subset underwent particle size analysis to augment the investigative scope.
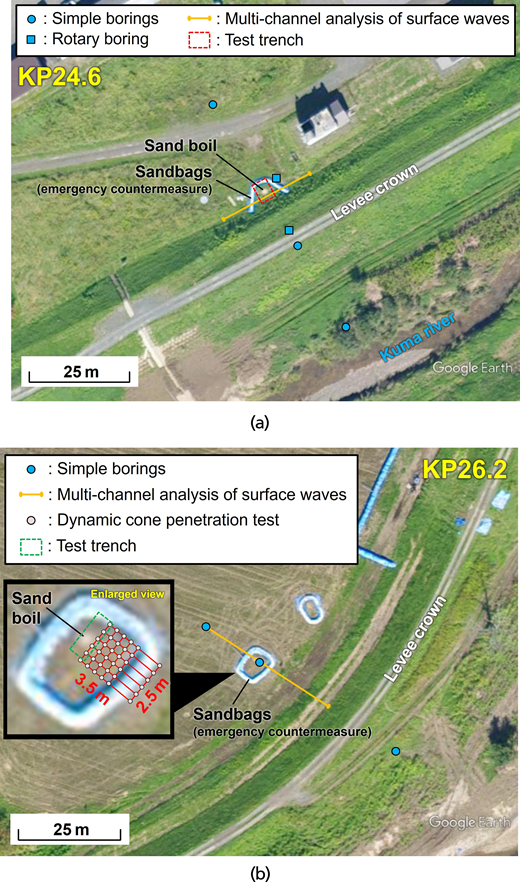
Summary of geotechnical investigation locations and survey contents. (a) KP24.6. (b) KP26.2
Summary of geotechnical investigation locations and survey contents. (a) KP24.6. (b) KP26.2
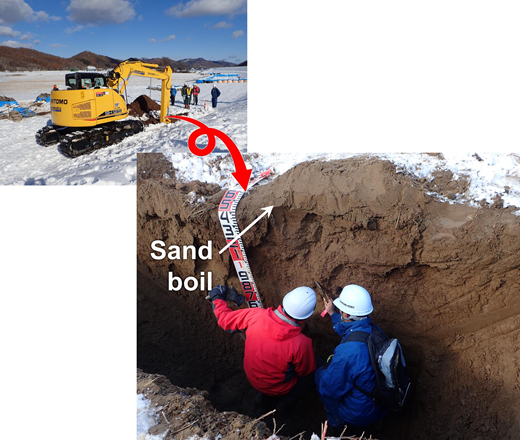
Figure 5 shows an illustrative synopsis of the simplified boring apparatus utilised in this study, characterised by a percussion-type boring machine, wherein a 120 mm diameter sampler is hydraulically driven into the ground (Kawajiri et al., 2024). While the borehole survey is invaluable, it inherently possesses localised limitations. Consequently, multi-channel analysis of surface waves (MASW; Hayashi and Suzuki, 2004; Park et al., 1999) was integrated to afford a comprehensive understanding of ground properties. This geophysical methodology facilitates the acquisition of a two-dimensional distribution of S-wave velocity, a parameter intrinsically linked to the shear modulus of the ground. The instruments used in this study were a seismometer (Model McSEIS-SXW, OYO Corporation, Tokyo, Japan) and a geophone (Model GS-11D, OYO Geospace Corporation, Houston, Texas, USA). The geophone’s natural frequency is 4.5 Hz. The geophones were installed at intervals of 1 m along the survey line. Rayleigh waves were generated in the soil by applying a vertical force to the soil surface using a large wooden portable hammer. The hammer shots were taken at 1 m intervals, as the hammer shots were taken between the geophones. In this study, we applied the common mid-point cross-correlation analysis proposed by Hayashi and Suzuki (2004) to shot gathers to improve the lateral resolution of shear wave velocity profiles. Low and high frequencies correspond to the deep and shallow parts of the soil layer, respectively. The one-dimensional shear wave velocity profile is reconstructed by applying the non-linear least squares method to each dispersion curve. The initial model was generated by fixing the number of layers to 10 and using the wavelength-depth conversion (Xia et al., 1999). The two-dimensional shear wave velocity profile was obtained by aligning the one-dimensional shear wave velocity profile, and the shear wave velocity profile along each line of the survey was estimated. In addition, Watabe and Sassa (2008) applied MASW to understand the formation process of tidal flats and reported the validity of the above analysis method.
Around KP26.2, sand boils, measuring approximately 1.5 m in diameter and 0.3 m in height, manifested at a distance of roughly 8 m from the slope toe on the landside, indicative of a distinctive occurrence pattern compared with that observed at KP24.6. Concurrently, simplified boring operations were undertaken at this site to elucidate the genesis of the sand boils predicated upon the lateral soil composition of the levee. Moreover, to facilitate a more direct assessment of the geotechnical attributes of the ground surrounding the sand boil epicentre, measurement points were strategically positioned at 0.5 m intervals (occasionally 1.5 m intervals) within a delineated area measuring 2.5 m × 3.5 m, spanning between the site of sand boil occurrence and the sloping toe on the landside of the levee. A dynamic cone penetration test (DCPT) was conducted at this measurement point. In this study, the DCPT measures the blow count (Nd value) required to penetrate a 25 mm diameter cone 100 mm with a 5 kg weight dropped freely from a height of 500 mm. In addition, MASW was performed to interpolate findings from the simplified boring and DCPT, as shown in Figure 6.
Progress on implementation of multi-channel analysis of surface waves in KP26.2
Progress on implementation of multi-channel analysis of surface waves in KP26.2
Results of geotechnical survey
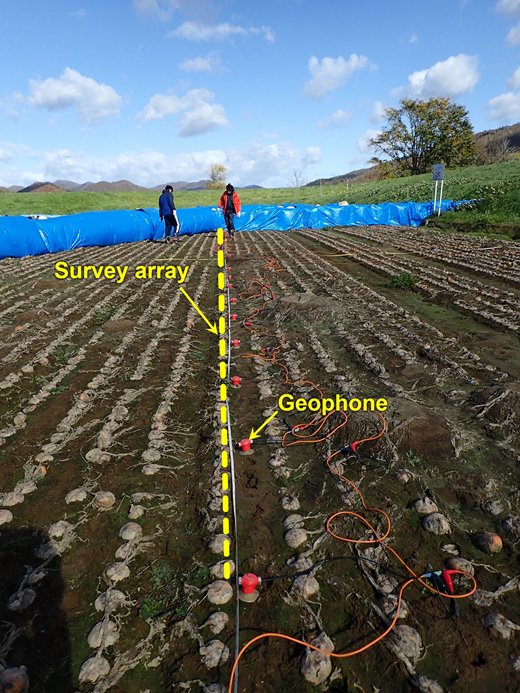
It is assumed that the increase in seepage pressure within the permeable foundation soil, caused by the increase in the water level of the river, triggers the formation of sand boils. Consequently, a correlation between the size of the sand boil and the extent of seepage pressure propagation as pressure can be expected. Specifically, a direct relationship is hypothesised in which larger sand boil sizes correspond to proximity to the landside slope. In comparison, smaller sand boil sizes correlate with greater distances from the toe of the slope. Notably, the current research in the literature has yet to provide empirical support for the mechanism underlying the formation of sand boils in the real field.
Figure 7 shows the correlation between the area of the sand boil, Ab, and the distance from the toe of slope at the landside to the centre of the sand boil, Lt, concerning the slope toe on the landside across various KP designations. While it would be desirable to employ indices such as eruption volume or mass for gauging eruption scale, the challenge of ascertaining elevation from orthophotographs necessitated the adoption of sand boil area as a surrogate metric. Although caution is required because the amount of data is not uniform, the relationship between Ab and Lt differs for each KP. In KP27.0–27.2 and KP26.8–27.0, there was a tendency for Ab to increase as Lt decreased. In these KP, it was possible to predict that sand boils would occur due to a simple mechanism, as shown in Figure 1. In other words, large-scale sand boils were observed at the toe of the landslide, where water pressure is easily released. On the other hand, at KP26.8–27.0 and KP26.6–26.8, small-scale sand boils with small Ab values were observed, especially near the toe of the landside slope. This result suggests that the occurrence of sand boils is influenced by complex underground structures that differ from the simple mechanism shown in Figure 1. The differences in the relationships between Ab and Lt shown above may be due to the influence of the levee’s height and geological structure. However, detailed data sets were not available for the levee’s height. Therefore, this study focused on the influence in geological structure.
Relationship between the area of the sand boil and the distance from the toe of slope at the landside to the centre of the sand boil
Relationship between the area of the sand boil and the distance from the toe of slope at the landside to the centre of the sand boil
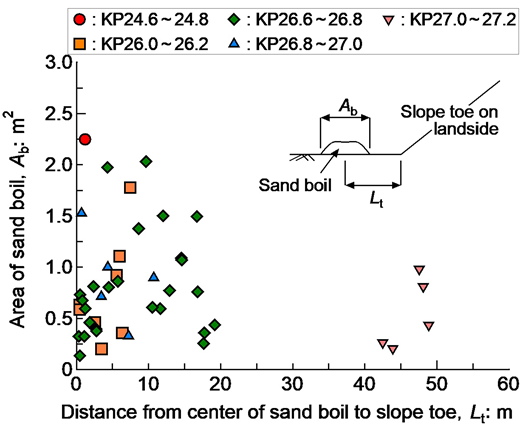
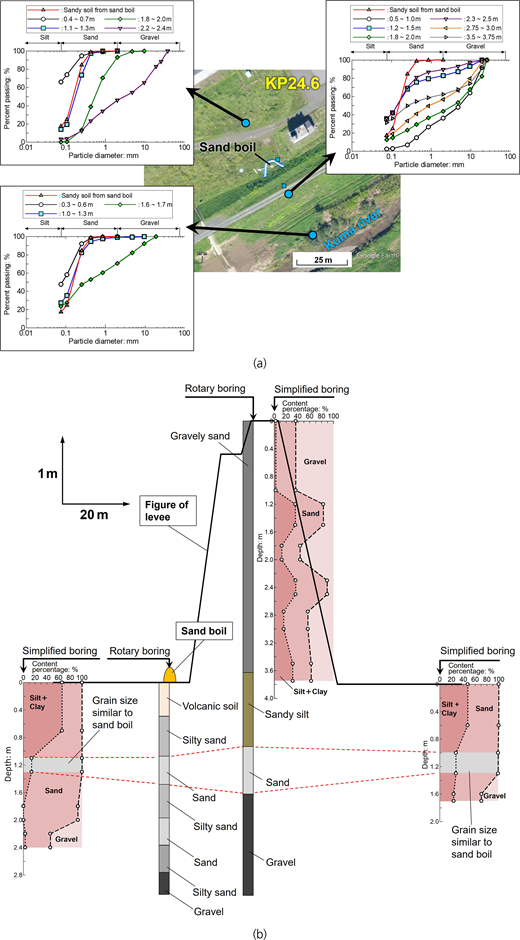
Figures 8(a) and 8(b) show the grain size characteristics of the samples collected at each depth by simplified boring conducted in KP24.6 and the results of rotary boring and simplified boring, respectively, reflected on the levee cross-section. Figure 8(a) shows that the grain size of the sand boil is classified as sandy soil. Sandy soils similar to the sandy sediment were observed at sampling depths of 1.1–1.3 m in the landside area and 1.0–1.3 m in the riverside area. As for the results at the crown of the levee, it took much work to collect samples from depths corresponding to the sampling depths of 1.0–1.3 m for the landside and riverside areas since the sampler could not be driven into the levee foundation with the simplified boring Therefore, the depth of sandy soil distribution was unknown from the simplified boring at the crown of the levee. Figure 8(b) shows the grain size characteristics of the soil at each of the locations in Figure 8(a), compared with a cross-section of the levee. The surface layer on the landside and riverside is a fine-grained soil with a silt and clay content of 40%–60% to a depth of about 1.0 m. The subsoil is composed of sand, silt, and clay. Sandy soil with the same grain size characteristics as the sandy sediment is deposited in the subsoil. According to the soil information obtained from the rotary boring at the top of the levee and around the sand boil, sandy soil with the same grain size characteristics as those of the sand boil is deposited with a thickness of about 1.0 m just below the levee and 0.4 to 0.6 m from the landside to the riverside. In other words, the sandy soil layer is presumed to be deposited in a lenticular manner. The sandy soil layer was continuously deposited from the landside to the riverside.
Grain size analysis results and estimated soil profile at KP24.6. (a) Grain size distribution at each location. (b) Soil profile estimated from borehole data (note: the aspect ratio of the figure is different)
Grain size analysis results and estimated soil profile at KP24.6. (a) Grain size distribution at each location. (b) Soil profile estimated from borehole data (note: the aspect ratio of the figure is different)
Figures 9(a) and 9(b) show the grain size characteristics of soil samples procured at KP26.2 and their manifestation within the levee cross-section, respectively. The sandy soil, possessing similar grain size characteristics to those sampled from the surface of the sand boil, was found distributed both on the landside and in proximity to the sand boil, spanning depths from 1.45 to 1.55 m and 1.1 to 1.4 m, correspondingly. Moreover, a distribution of fine-grained soil was observed on the ground surface within the upper layer of the sandy soil layer, with a discernible elevation in the quantity of fine-grained soil at KP26.2 relative to KP24.6, attributable to the cultivated nature of the landside at KP26.2. Furthermore, an increment in the fine-grained composition of the cultivated soil was noted in the landside direction in contrast to the locus of the sand boil. Sandy soils with similar grain size characteristics to those of the sand boils were not found to be deposited in the riverside ground. However, it is important to note that information on the soil properties below a depth of 2 m in the riverside ground is currently lacking and needs to be included. This result differs from the soil composition observed in KP24.6. Figure 9(b) shows the difference in both depth and thickness of the sandy soil layer, reflecting identical grain size characteristics to the sand boil between the landside and riverside of the sand boil at the ground. The sandy soil layer on the riverside manifested a shallower depth and thicker layer compared with its counterpart on the landside.
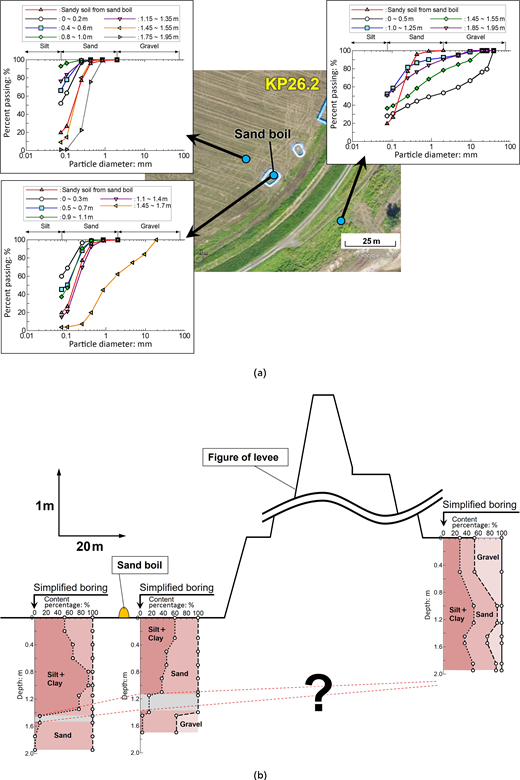
Grain size analysis results and estimated soil profile at KP26.2. (a) Grain size distribution at each location. (b) Soil profile estimated from borehole data (note: the aspect ratio of the figure is different)
Grain size analysis results and estimated soil profile at KP26.2. (a) Grain size distribution at each location. (b) Soil profile estimated from borehole data (note: the aspect ratio of the figure is different)
Figure 10 shows the conditions of the test trench. The initial step in constructing this trench involved excavating the ground with a backhoe to obtain a preliminary observation section. Subsequently, this initial cross-section was meticulously refined through manual labour, utilising small shovels and sickles to enhance the visibility of the soil layers. Figures 11(a) and 11(b) show cross-sectional views of the test trenches on the riverside and the landside, respectively, delineated by a sand boil adjacent to the sand hill. In Figure 11(a), a layer of silty soil extends from the surface down to a depth of 1.0–1.3 m, beneath which lies sandy soil similar to that found in the sand boil. Below this silty layer, the deposition of sandy soil resembling that of the sand boil is observed, followed by gravelly soil interspersed with rounded gravel. These observations agree with the boring data shown in Figure 9. Conversely, the cross-section moving landward from the sand boil, as shown in Figure 11(b), reveals silty soil reaching depths of 1.5–1.8 m, below which sandy soil is encountered. As indicated above, the sand accumulation from the sand boil is a demarcation between the levee and the landward side, with distinct soil compositions on each side. The above suggests that the silty soil layer on the landside may have functioned as a barrier, preventing the horizontal transmission of seepage pressure from the river channel. This seepage pressure may have been directed upwards towards the surface in front of the silty layer, promoting the occurrence of sand boils.
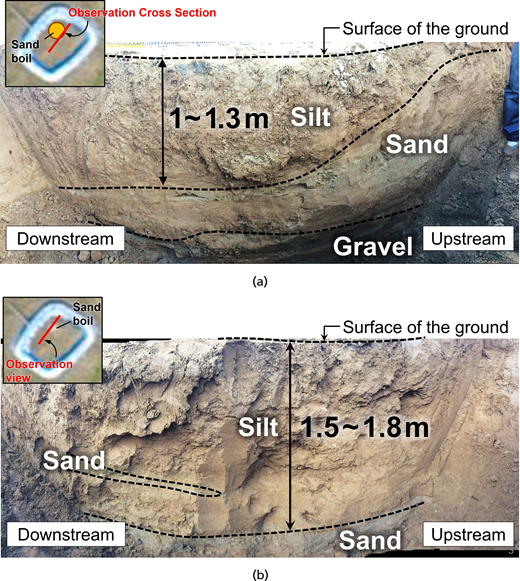
Observed surface of test trenching at KP26.2. (a) Levee side from the centre of the sand boil. (b) Landside side from the centre of the sand boil
Observed surface of test trenching at KP26.2. (a) Levee side from the centre of the sand boil. (b) Landside side from the centre of the sand boil
Figure 12 shows the two-dimensional distribution of VS at KP24.6 obtained from the surface wave survey conducted at the survey line shown in Figure 4(a). The figure also shows the soil profile obtained from the rotary borehole near the location of the sand boil. Typically, VS increases with depth. However, at Y = 1.0–1.5 m, where sandy soil with grain size characteristics similar to those of the sand boil is distributed, a low-velocity region of VS = 110–130 m/s is distributed in the direction of the levee extension (X = 0–24 m), as indicated by the blue boxes in the figure. On the other hand, VS = 120–130 m/s is relatively high near the point of sand boiling point (X = 6–14 m) within this low-velocity region. In other words, the VS of the sandy soil layer, the source of sand boiling, is lower than that of the upper and lower layers, but the VS at the sand boiling occurrence point is slightly higher within this region. This result suggests that the soil density in the foundation around the sand boil may have changed due to the soil disturbance caused by the soil piping.
S-wave velocity profiles obtained from MASW near the sand boil occurrence at KP24.6 (survey array was placed in the longitudinal direction of the levee)
S-wave velocity profiles obtained from MASW near the sand boil occurrence at KP24.6 (survey array was placed in the longitudinal direction of the levee)
Figure 13 shows the three-dimensional distribution of DCPT Nd values near the sand boil occurrence at KP26.2. As a general observation, Nd values exceed 20 at depths beyond 1.5 m. This depth aligns with the distribution of gravelly soil within the soil profile, as determined from simplified boring and illustrated in Figure 9. Downstream of the soil profile, Nd values range from 5 to 8 to approximately a depth of 1.0 m. Beneath this, a layer is identified with Nd values as 3 or less, indicative of sandy soil and consistent with the soil profile analysis. Similarly, the upstream side exhibits surface areas where Nd values were 3 or less. This observation aligns with the findings from the test trench investigations presented in Figure 9. These results suggest that the sandy soil layer, exhibiting grain size characteristics similar to those associated with sand boils, presents as a loosely compacted zone with Nd values of 3 or less. The distribution of this sandy soil is not uniform towards the levee but appears in a network pattern. Visual identification of cavities or sand columns was not possible during the test trench survey. Consequently, it is inferred that the seepage pressure generated in and around the levee support ground propagated selectively, as indicated by the dashed lines in Figure 13(b).
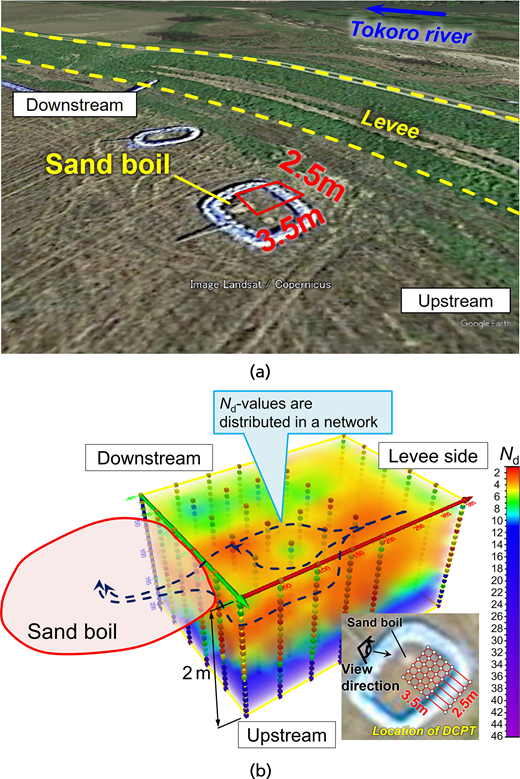
DCPT locations and Nd values obtained from DCPT at KP26.2. (a) Bird’s-eye view of the area subjected to DCPT. (b) Three-dimensional distribution of Nd values around the sand boil
DCPT locations and Nd values obtained from DCPT at KP26.2. (a) Bird’s-eye view of the area subjected to DCPT. (b) Three-dimensional distribution of Nd values around the sand boil
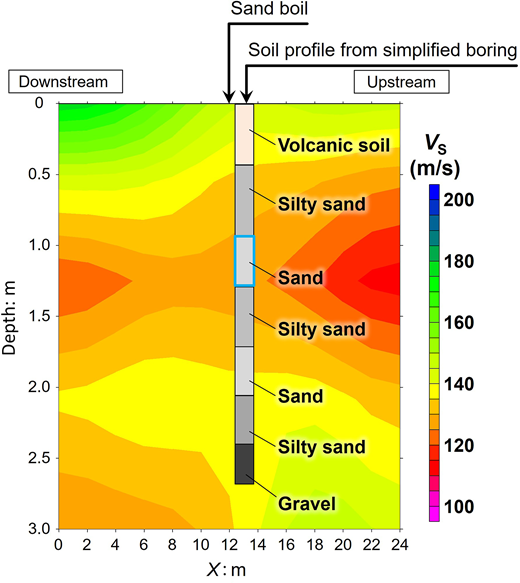
Figure 14 shows the two-dimensional distribution of VS around KP26.2 (Kawajiri et al., 2019). The soil layer classifications obtained from the boreholes near the sand boil (see Figure 9(a)) and 9(b)) are also shown. The S-wave velocity of the sandy soil with similar grain size characteristics to the sand boil shown in the blue box is 100–110 m/s. This velocity range is distributed between 100 and 110 m/s toward the soil surface where the sand boil occurred. This result can be interpreted as the sand boiling pushing the sandy soil layer towards the ground surface. Another interpretation is that the silty soil layer may have been locally thin even before the sand boiled, and the sand may have erupted through these areas. As shown above, the S-wave velocity distribution at the location of the sand boil was different depending on the occurrence of the sand boil. In the case of a large sand boil at the slope toe on the landside, an increase in S-wave velocity was suggested in the path of the backward erosion piping. On the other hand, the sand boil that occurred distant from the slope toe on the landside showed a reticulated area with low Nd values, suggesting that this area may have been the path of the backward erosion piping. At KP24.6, the movement of sandy soil with grain size characteristics similar to the sand boils due to seepage pressure and river water inflow is expected to have increased the density of the loosened area. On the other hand, KP26.2 has heterogeneous hydraulic conductivity and density, and this heterogeneity caused the development of a network of water channels when seepage pressure was applied. Sediment gradually moved through these water channels, and thus, it can be inferred that areas with low Nd values remained in the network after sand boiling occurred. Therefore, the profile of VS and Nd values at the sand boil site is considered a characteristic distribution that contributes to the investigation of the mechanism of sand boil occurrence.
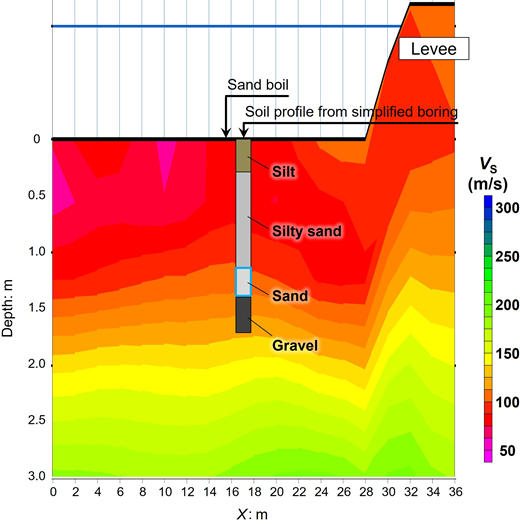
S-wave velocity distribution obtained at the MASW near the sand boil occurrence at KP26.2 (survey array is placed orthogonal to the longitudinal direction of the levee)
S-wave velocity distribution obtained at the MASW near the sand boil occurrence at KP26.2 (survey array is placed orthogonal to the longitudinal direction of the levee)
Discussion
Around KP24.6, where a sand boil occurred around the toe of the slope at the landside, sandy soil, considered the source of the sand boil, was deposited below the silty soil on the ground surface. The sandy soil was distributed in layers of similar thickness from the landside to the riverside. S-wave velocity was locally changed in the sandy soil layer around the sand boil. These results suggest that seepage pressure was exerted on the sandy soil layer in the basement due to the rise of the river level at KP24.6. The sand boil occurred at the slope toe on the landside, where this osmotic pressure will most likely be released. The riverbank is exposed near KP24.6. As a result, when the river level rises, river water tends to flow into the well-permeable sandy soil layer on the exposed river bank. The concentrated inflow of river water is assumed to have been a factor in the increase in the magnitude of sand boils.
In the vicinity of KP26.2, where sand boils occurred further from the slope toe on the landside than inside the levee, the sandy soil layer that served as the source of the sand boils was located beneath the surface layer of silty soil. However, the transverse distribution pattern of this sandy soil at KP26.2 was different from that at KP24.6. The sandy soil layer was distributed at a shallower depth on the levee side of the sand boil site, whereas a thicker layer of silty soil was present on the landside. In addition, no distribution of sandy soil with grain size characteristics similar to the sand boils was observed outside the levee.
Although no clear cavities or sand pipes associated with the sand boils were identified by test trenching, the three-dimensional distribution of Nd values revealed a network of loosened zones with Nd values of 3 or less. Considering the local conditions at KP26.2, unlike KP24.6, river water infiltration into the foundation was minimal because the sandy soil layer was not exposed outside the levee. However, the seepage pressure affected the sandy soil layer on the landside. The presence of the silty soil, which acted as a barrier against the horizontal propagation of the seepage pressure, probably changed the direction of this pressure from horizontal to vertical toward the surface, resulting in sand boils. Note that in the design of levees in Japan, one of the criteria for checking the occurrence of backward erosion is to ensure that the ratio of the thickness (weight), G, of the low-permeability layer to the uplift pressure, W, acting on it is 1.0 or less. In this study, we did not perform seepage flow analyses for the surveyed locations, so a quantitative discussion of the ratio of G to W (G/W) is impossible. However, understanding the thickness of the low-permeability layer through geotechnical investigations is crucial for assessing the risk of backward erosion.
This discussion examines the relationship between sand boils and levee stability. At KP24.6, sandy soils similar to those involved in sand boil formation are also distributed within the levee. Therefore, if high water levels continue and the extent of sand boils increases, there is a potential for levee collapse, as shown in Figure 1, indicating that the impact of sand boils on levee stability is significant. Conversely, at KP26.2, although the distribution of the sandy soil layer within the levee foundation ground has yet to be confirmed, it is apparent that the sandy soil layer does not extend continuously from the landside to the riverside. Therefore, compared with KP24.6, more time is probably taken before the levee foundation soil is subject to cavitation. These results indicate that the sand boils are likely to have a short time on the stability of the levee. The S-wave velocity and Nd value profiles obtained this research reflect conditions after sand boil formation. In that case, traditional geotechnical survey methods will prove valuable in understanding the impact of sand boils on the surrounding ground. In that case, traditional geotechnical survey methods will prove valuable in understanding the impact of sand boils on the surrounding ground. In the future, surface wave surveys (MASW) and DCPT will be helpful in areas with air blow and soil compositions similar to those of sand boil sites but where sand boil formation has not occurred. In particular, although this paper does not discuss it because the data set is insufficient, more accurate ground properties can be expected to be evaluated by examining the correlation between Vs and Nd values.
In the future, it will be necessary to collect and carefully analyse geotechnical data from ground conditions before the occurrence of sand boils. In these investigations, novel geotechnical survey methods are also useful. Ghorbani et al. (2024) conducted 2.5D and 3D resistivity and normalised charge ability tomography on river levees where sand boils had occurred. The results revealed that parts of the levees were constructed over paleochannel filled with sand, allowing water to flow beneath the levees and their clay cores during floods. In addition to S-wave velocity and Nd value, the application of the latest geophysical exploration methods is useful for understanding levee failures caused by piping. The results of the blind field tests reported by Kyrkou et al. (2022) are useful for improving the sophistication of MASW and for finding appropriate ways to organise data. By referring to this method, improving the efficiency and systematisation of data processing in MASW should be possible.
Conclusions
In this study, geotechnical investigations and laboratory soil tests were conducted to determine differences in the geotechnical occurrence of sand boils in river levees. A summary of the results is presented below.
- ▪
Interestingly, we observed a tendency for the magnitudes of sand boils to decrease as the distance from the landside slope toe to the emergence point increased. However, the observation of numerous small sand boils in close proximity to the landside slope toe led us to a surprising conclusion – there is no strong correlation between the size of sand boils and their distance from the landside slope toe. This unexpected result underscores the stratified distribution of soil types in the actual levee foundation and in the soil from the landside to the riverside, as well as local variations in soil density.
- ▪
In cases where large sand boils occurred near the toe of the slope on the landside, sandy soil with grain size characteristics similar to those of the sand boils was found to be stratified and continuously distributed in the soil from the landside to the riverside, as well as in the foundation soil. In addition, there was no significant variation in the thickness of the sandy soil layer across the direction of the levee, and silty soil had accumulated to the surface above the sandy soil layer. Infiltration of river water from the riverbanks during increased river flow exerted a percolation pressure on this soil composition. This percolation pressure was probably relieved at the toe of the slope on the landside, resulting in the formation of sand boils.
- ▪
In cases where sand boils were observed, approximately 8 m from the slope toe on the landside, the soil composition differed across the boundary marked by the sand boils. On the levee side of the sand boils, sandy soils similar to the sand boils were distributed at relatively shallow depths, with silty loam extending to the surface above. On the other hand, on the inner side of the sand boils, the sandy soil distribution depth became deeper, and the upper silty loam layer contained a greater number of fine particles. Therefore, it is concluded that the direction of the seepage pressure acting on the sandy soil layer changed from horizontal to vertical toward the surface due to the silt loam layer with a higher content of fine particles, resulting in sand boils.
- ▪
In the vicinity of the sand boil occurrences, changes in the S-wave velocity of the sandy soil layers were observed to be locally variable, with areas of low Nd values distributed in a network pattern. The S-wave velocity regions corresponding to the sandy soil layers exhibited a convex shape toward the surface at the locations of sand boil formation. These results indicate that geotechnical investigations could be used to identify the soil properties resulting from the occurrence of sand boils.
Acknowledgements
The authors would like to acknowledge Hokkaido Regional Development Bureau, Ministry of Land, Infrastructure, Transport and Tourism (MLIT) and Mr. Kazuaki Hashimoto and Mr. Ken Nagakura (Nippon Koei Co., Ltd.), who collectively investigated this project.
