

In situ measurements of soil suction and water content in deep soil layers still represent an experimental challenge. Mostly developed within agriculture-related disciplines, field techniques for the identification of soil retention behaviour have been so far employed in the geotechnical context to monitor shallow landslides and seasonal volume changes beneath shallow foundations, within the most superficial ground strata. In this paper, a novel installation technique is presented, discussed and assessed, which allows extension of the use of commercially available low-cost and low-maintenance instruments to characterise deep soil layers. Multi-depth installations have been successfully carried out using two different sensor types to measure the soil suction and water content up to 7 m from the soil surface. Preliminary laboratory investigations were also shown to provide a reasonable benchmark to the field data. The results of this study offer a convenient starting point to accommodate important geotechnical works such as river and road embankments in the traditional monitoring of unsaturated soil variables.
Notation
Introduction
The evaluation of negative pore water pressures plays a crucial role in the description of the stress state of an unsaturated soil. Negative pore water pressures directly relate to soil suction, particularly the matric suction component, which influences soil water content. The soil suction is typically given as a function of soil water content, through the soil water retention curve (SWRC), which sets the foundations for unsaturated soil mechanics. The SWRC can be measured either in the laboratory or in the field. However, in situ measurements of SWRC may differ from that determined in the laboratory, due to different boundary and stress conditions in the field (Bordoni et al., 2017). Field measurements enable larger soil volume to be investigated and allow for accounting the time and spatial variability of water content and soil suction. As a result, field measurements of these unsaturated soil variables play a crucial role in identifying the initial stress state at a specific site and provide relevant monitoring data, complementing the laboratory data in the development and validation of unsaturated soil models (Fredlund, 2006).
The most widespread tools for in situ evaluation of soil water content are based on electromagnetic indirect methods such as frequency, time or amplitude domain reflectometry and capacitive sensors (Bittelli, 2011). Water-filled tensiometers are, on the other side, the most widely used instruments for in situ measurement of suction in the lowest range (i.e. less than −100 kPa). Since the pioneering work by Ridley and Burland (1996), know-how regarding high-capacity tensiometers (HTCs), capable of measuring in excess of 1 MPa, has advanced considerably (Lourenço et al., 2008), but only recently have designs specific to field applications been developed (e.g. Toll et al., 2011). Nonetheless, the use of HTCs in situ has so far been limited to research applications. In addition, these installations have to provide the possibility of removing the instrument, as conditioning is necessary before installation and upon air entry. Thermocouple psychrometers and heat dissipation sensors, which can determine either the water content or the soil water potential and extend the range of measurement compared to tensiometers, are also used frequently. These instruments generally require lower economic and maintenance efforts compared to the more advanced HTCs, leading to the possibility of an extended monitoring system with relatively low operation costs. However, HTCs allow measurement of positive values of pore pressure, while this is not possible with indirect methods. Degré et al. (2017) have recently given an essential summary of these instruments along with an accurate overview on the performance of new sensors such as polymer tensiometers, matric potential sensor probes or pF meters.
Significant contributions to the development of these instruments have come from agriculture-related disciplines, such as soil science, soil physics and agronomy, as the SWRC essentially governs the amount of plant-available water deeply influencing irrigation management procedures. For such applications, special attention is paid to evapotranspiration process, atmospheric coupling and interaction with vegetation. Since their developments, these instruments have also found utilisation in some geotechnical problems, most commonly in the field of monitoring landslides (e.g. Bordoni et al., 2015; Cascini et al., 2014; Pirone et al., 2015; Springman et al., 2013) or changes in the soil volume due to seasonal variations of water content for the purpose of foundation design (Harris et al., 2013; Nguyen et al., 2010) and river embankments (Casagli et al., 1999).
For these applications, the instruments were installed within the first few metres below the ground surface, up to maximum depths of 2–3 m. To the authors’ knowledge, only few studies so far have considered deeper soil layers. In these studies, soil suction was measured and HTCs were used, in single installations (Ridley and Burland, 1996) or multiple installations in a single borehole (Mendes et al., 2008). More recently, attempts have also been made to mount HTCs along the sleeve of a penetrometer to allow for measurement at depth (Tarantino et al., 2016).
Simultaneous measurements of soil suction and water content in deep soil layers still offer an experimental challenge and may open the way to a wide range of applications, such as road and river embankments, for which partial saturation conditions may easily extend well beyond 5 m from the ground surface (Gottardi and Gragnano, 2016; Gottardi et al., 2016). Throughout the lifetime of these geotechnical works, soil suction and water content are subjected to variations as function of changes in the hydraulic and meteorological conditions. Continuous monitoring of these variables during wet and dry periods then becomes crucial towards the development and assessment of seepage and stability analyses.
As to the scope, the study presented in this paper focuses on the development of a new methodology for deep measurements of soil suction and water content. The idea was to devise a cost-effective, non-invasive, repeatable technique, whose implementation into monitoring systems could be carried out rather easily over wide areas, ensuring accurate measurements and low-maintenance operations.
The experimental procedures were tested, for the first time, at the crown of a river embankment in Emilia Romagna, Northern Italy, where dielectric water potential and water content sensors, selected as they offered a cost-effective and low-maintenance solution, were installed up to 7 m depth.
In this paper, special attention is given to the tools, procedures and applications of the installation procedures, highlighting practical issues and solutions. Monitoring data collected during installation up to equilibrium with the boundary conditions are presented and discussed. In addition, preliminary laboratory investigations on soil retention behaviour are shown to provide a benchmark to the field data. The technological contributions described herein might provide the starting point to extend the traditional monitoring of unsaturated soil state variables to deeper soil layers, which would enable covering a wide variety of geotechnical applications.
Details of the soil properties at the test site
The study was carried out at an 8 m high embankment, at a suitable site in Emilia Romagna, Northern Italy. Prior to the installation, core samples were taken at the site, at depths between 1·8 and 6·8 m from the embankment crown. In particular, the natural water content, the particle size distribution and the consistency indexes were determined by means of laboratory testing. According to these data, the artificial embankment consists of a single heterogeneous unit, about 6 m thick, characterised by a complex alternation of silt and sandy silt. Figure 1(a) shows the main soil fractions obtained from the grading curves plotted along the embankment depth. The main fraction is silt, ranging between 45 and 70%, while sand varies between 25 and 50%. The clay fraction ranges between 10 and 25% and has a plasticity index (PI) of about 10%, as depicted in Figure 1(b).
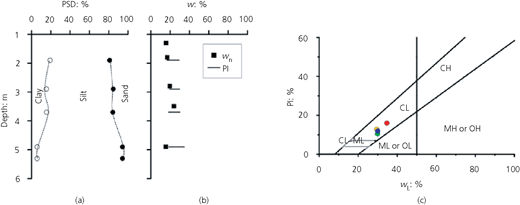
Soil classification at the installation site: (a) particle size distribution (PSD), (b) plasticity index and natural water content with depth and (c) Casagrande chart within the Unified Soil Classification System. C, clay; H, high plasticity; L, low plasticity; M, silt; O, organic
Soil classification at the installation site: (a) particle size distribution (PSD), (b) plasticity index and natural water content with depth and (c) Casagrande chart within the Unified Soil Classification System. C, clay; H, high plasticity; L, low plasticity; M, silt; O, organic
The natural water content (wn) measured on the core samples was close to the plastic limit (wP) and increases from the embankment crown up to 4 m depth (Figure 1(b)). The soil is classified as low-plasticity clay (CL) on the Casagrande chart (Figure 1(c)), with the data points plotting above the A-line characteristic of illite. The mineralogy was also confirmed by the activity index A, which is close to 0·7.
Details of the soil suction and water content sensors
The soil suction sensors used were MPS-6 sensors (Decagon Devices, 2016a), which were recently assessed as having a good performance by Degré et al. (2017). The instrument uses the water content of a porous ceramic disc to calculate the water potential (soil suction) through a highly reliable water retention characteristic curve of the disc, which is the actual monitoring point. The water content itself is obtained through calibration with its dielectric permittivity, which is the quantity directly measured. Assuming hydraulic equilibrium between the ceramic disc and the surrounding soil, the soil suction is measured indirectly. The instrument accuracy is ±10% of the reading +2 kPa, over the range −9 to −100 kPa, while the measuring range extends to dry conditions (−100 MPa). The sensors were installed at depths between 3 and 7 m, as detailed in Table 1 and depicted in Figure 2.
Details of the installation scheme for suction and water content sensors within the embankment
| Borehole | Sensor | Installation depth: m |
|---|---|---|
| MPC1 | GS3 | 2·4 |
| MPS-6 | 3·1 | |
| GS3 | 4·5 | |
| MPS-6 | 4·6 | |
| SPC1 | MPS-6 | 7·0 |
| SPC2 | GS3 | 7·1 |
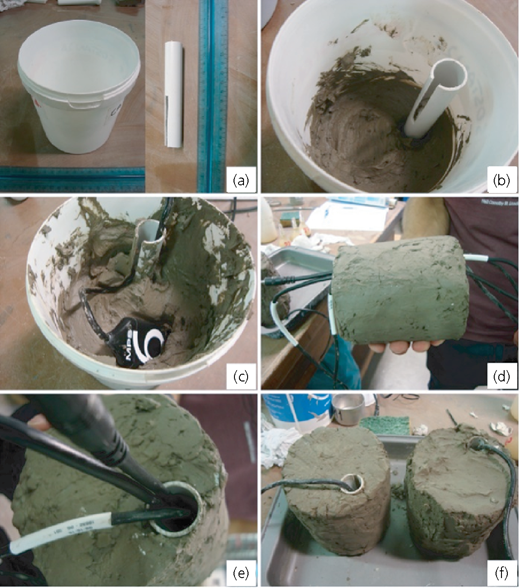
Phases of the laboratory preparation of the ‘soil cake’ used for installing the suction sensor: (a) tools required, (b) initial positioning of the tube, (c) placing of the MPS-6 sensor, (d) side view of sensor cables running through the cake, (e) top view, (f) cakes after curing
Phases of the laboratory preparation of the ‘soil cake’ used for installing the suction sensor: (a) tools required, (b) initial positioning of the tube, (c) placing of the MPS-6 sensor, (d) side view of sensor cables running through the cake, (e) top view, (f) cakes after curing
As the ceramic disc constitutes a fragile element of the probe, special care was taken in the installation phase. To avoid possible damages associated by simply pushing the instrument to the required depth, a specific procedure was developed. The idea underpinning the installation procedure is to secure the suction sensor in a ‘soil cake’ prepared in the laboratory prior to installation. The suction sensor is then in contact with the borehole through the soil cake. Upon installation, if the initial conditions of the soil cake differ from those of the surrounding soil, a transient flow is established between the soil cake and the surrounding soil until the hydraulic equilibrium is reached in correspondence of a unique value of soil suction. The soil used was sampled at the site and had a particle size distribution slightly finer than that found at the installation depth. While filters around piezometers should have a higher permeability (i.e. coarser particle size distribution) than that of the surrounding soil, the opposite is true when measuring suction, as this guarantees a higher air entry value and therefore avoids hydraulic continuity between the soil and the sensor being lost. For this reason, jet-fill and flushable piezometers are sometimes buried in cement–bentonite mixtures. However, this might cause a considerably larger delay in the sensor response than when using soil of the same or similar composition as that in situ. In particular, Toll et al. (2011) found that HTCs measured a lower value when placed in the grouting mixture than in the intact soil. For this reason, a comparison between direct and indirect measurements of suction in a soil volume at the laboratory scale was carried out, developing a specific calibration for the sensor.
The cake was formed using a cylindrical bucket having the same diameter as the boreholes hosting the sensor (10 cm), as depicted in Figure 2(a). A plastic tube having a short longitudinal slot was placed vertically inside a bucket while preparing the cake (Figure 2(b)) to channel out the cable of the host sensor and/or of sensors installed deeper (Figures 2(d) and 2(e)), as in the case of multiple-point installations. As seen in Figures 2(c) and 3(a), the sensor was placed with the ceramic disc oriented upwards to ease air discharge and reduce air entrapment. As the natural soil water content was generally close or below its plastic limit, water was added to ensure workability. However, the water content was kept below the liquid limit to avoid the formation of cracks while curing the cake to approximately the initial water content. This latter step ensured safe handling of the cake as it was left to dry until it was self-sustaining and it also ensured shorter time to reach equilibrium with the field conditions. These preparatory operations carried out in the laboratory with controlled conditions provide a series of soil volumes each containing a soil suction sensor (Figure 2(f)) and allow a highly repeatable procedure. Figure 3 shows a final sketch of the soil cake and its conditions prior to site installation.
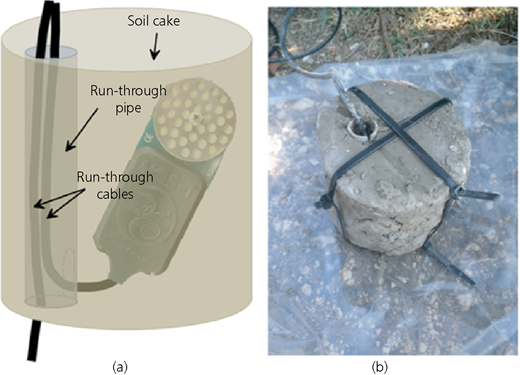
Schematic diagram of the ‘soil cake’ used for installing the suction sensor: (a) drawing and (b) photograph taken at the site prior to the installation
Schematic diagram of the ‘soil cake’ used for installing the suction sensor: (a) drawing and (b) photograph taken at the site prior to the installation
The soil water content sensors used were the GS3 (Decagon Devices, 2016b). The sensor consists of a plastic body from which three parallel steel needles having a slightly tapered end (prongs) protrude at a right angle, which allows direct installation into the intact ground. The sensor measures the dielectric permittivity of the medium in which its prongs are placed by generating a 70 MHz electromagnetic field across them. The dielectric permittivity measured is calibrated against the water content of the soil surrounding the sensor prongs (≈160 cm3). This calibration depends on the type of charge, soil lithology and prong length, and to improve the default accuracy (±3%), user calibrations taking into account all these factors were carried out. Depths of installation on site were between 2·3 and 7·1 m. Because of the geometry of the sensor prongs, it was possible to install it directly in the soil surrounding the host borehole without risking damaging it. This aspect is crucial, as the water content distribution and, more generally, hydraulic properties are highly dependent on the particle arrangement of the soil.
Details of the installation procedures
The suction sensors and water content sensors were installed within boreholes carried out to the scope, in a single or multiple arrangement as depicted in Figure 4. The installation of different sensors within the same borehole offers the advantage of minimising the number of excavations, avoiding preferential water flow paths to be established at the site, which could bias the measurements and locally damage the embankment integrity with possible consequence on its stability. The multiple-point type of installation also facilitates the identification of the field SWRC, as suction and water content sensors can be combined at the same depth in the same borehole.
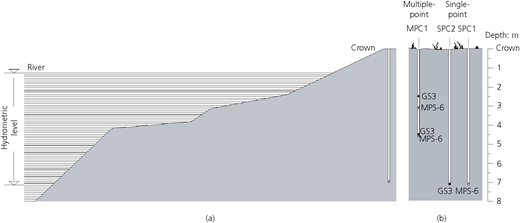
Scheme of the sensor installation: (a) cross-section with likely hydrometric levels and (b) longitudinal section
Scheme of the sensor installation: (a) cross-section with likely hydrometric levels and (b) longitudinal section
Single-point measurements were also designed and implemented, where one sensor only was installed within a given borehole. This procedure, which is comparatively simpler to execute, was followed for the deepest installations (7 m). Details are provided in Table 1, where the type of installation, either multiple (M) or single (S), is given along with the depth at which each sensor (MPS-6 and GS3) was installed with respect to the embankment crown (C). The installations herein described were executed in three boreholes, of which one was a multiple-point installation with four sensors (MPC1), while the other two single-point installations hosted one sensor each (SPC1 and SPC2).
For the installation of the water content sensors, a different experimental technique was developed. As already mentioned, the GS3 sensor is equipped with three-prong-shaped electrodes that can be installed directly in the intact soil, either at the borehole base or side-wall, as illustrated schematically in Figure 5 (installations 1 and 2, respectively). The installation procedure involves pushing the prongs into the soil until full contact between the sensor body and the borehole shaft is achieved. The geometry of the GS3 allows the process to be carried out quite easily, ensuring no damage during installation and keeping the soil disturbance at a minimum.
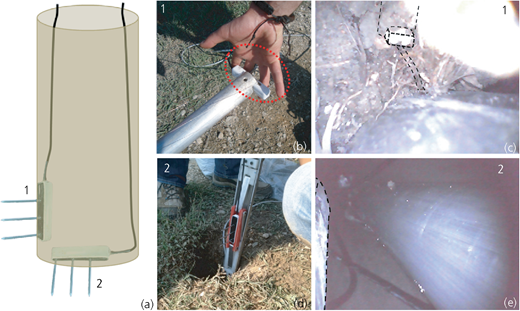
Schematic diagram of the installation of a water content sensor: (a) at the borehole base (1) and side-wall (2); details of installation 1: (b) U-shaped cradle and (c) video inspection; details installation 2: (d) quick borehole installation tool (Q-bit) entering the borehole and (e) video inspection
Schematic diagram of the installation of a water content sensor: (a) at the borehole base (1) and side-wall (2); details of installation 1: (b) U-shaped cradle and (c) video inspection; details installation 2: (d) quick borehole installation tool (Q-bit) entering the borehole and (e) video inspection
To install the GS3 at the borehole base ((1) in Figure 5(a)), the sensor body was positioned in a U-shaped cradle, as shown in Figure 5(b), to keep its prongs vertical during installation. Two thin plastic wires were employed to hold the sensor in place while lowering the assembly down the borehole. These were removed after ascertaining successful installation by means of changes in the transducer’s readings and/or video inspection (Figure 5(c)). In Figure 5(c) and 5(e), the plastic body of the sensor is outlined and, despite the rather poor quality of the images, the sensor prongs are not visible, having entered the ground, hence confirming that the instrument was correctly installed.
For the side-wall installation of the GS3 ((2) in Figure 5(a)), a different procedure was developed that made use of a prototype instrument provided by Meter Group, called quick borehole installation tool (Q-bit). The tool is made of a series of telescopic pipes that thrust the instrument’s head forwards in a horizontal direction and push the GS3 prongs in the soil. As depicted in Figure 6, the Q-bit consists of three main parts: the carriage, the shaft and the handle actuator. The sensor is placed in a plastic housing (cradle), which is mounted on the carriage. Figure 6 shows the carriage in the retracted mode, hosting a GS3. The carriage features a three-leg jack mechanism to convert vertical into a horizontal force, therefore pushing the sensor prongs through the soil of the borehole shaft. If the Q-bit is held perfectly vertical, the mechanism forces the sensor to proceed on a straight line during horizontal displacement, thus assuring a perfect contact between electrodes and soil. This results from identical yet opposite vertical displacement of the two carriage slides. These are, in turn, actuated by the symmetrical levers in the handle actuator, which control two concentric shafts moving in opposite directions. A third external shaft connects the carriage and the actuator and provides the sufficient stiffness to the system.
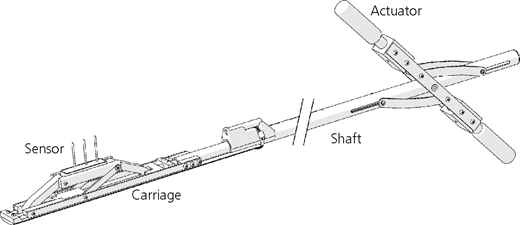
Thanks to the mechanical advantage offered by both the actuator levers and the jack mechanism, in addition to the sharp prong tips, very little force is required to install the sensor in either soft or comparatively harder soils. As a successful installation relies on the integrity of the sensor, the presence of gravel might be problematic. If the user has enough sensitivity in the handles, it is possible to recognise when a rock is being hit by the sensor. In this case, the installation procedure can be interrupted, and the sensor is recovered by gently pulling on the cable.
By means of these techniques, one MPS-6 sensor and one GS3 sensor were installed at the base of boreholes SPC1 and SPC2, respectively. The borehole MPC1 was instrumented with two water content sensors and two suction sensors as follows. Upon completion of the borehole to the prescribed depth (about 4·6 m), the first soil cake was lowered to the borehole base with the aid of a metallic tube, as already described. Afterwards, the water content sensor (GS3) was installed right above on the borehole side-wall (configuration (2) in Figure 5(a)). For the installation, the Q-bit was lowered into the borehole until its head was resting on top of the soil cake (about 4·5 m). As already mentioned, the Q-bit uses the borehole side-wall as a contrast to push the sensor prongs into the soil. Once the sensor was installed, the carriage was retracted, leaving the sensor in place, and the Q-bit was retrieved from the borehole. Attaching a miniature camera to the Q-bit, it was possible to confirm the inspection as shown in Figure 5(e). Completion of the operation was also confirmed by changes in the data recorded, which were monitored while installing the sensors as a warning. The first installation was then sealed, filling 0·5 m of the borehole with bentonite-hydrated pellets, while soil retrieved on site was used to fill the borehole up to the depth of the second installation (about 3 m from the soil surface). Another soil cake hosting an MPS-6 was then lowered into the borehole, and a second GS3 was installed.
Figure 7 shows the monitoring data collected during and right after the installation phases. The MPS-6 measurements start from suction values generally higher than those in situ, which is due to having dried the soil cake prior to installation. Equilibrium with the surrounding soil can be reached in 1 d to several weeks, when no significant external actions occur (as experienced on the monitoring site); the duration of this process is, however, strongly dependent on the initial and boundary conditions of the transient seepage existing between the soil cake and the surrounding soil. The equilibrium time for the GS3 is rather similar for all the sensors installed, and it is less than 1 d. At the end of the equalisation process, measured suction values were consistently between 35 and 60 kPa, while volumetric water content values were between 0·21 and 0·32 m3/m3.
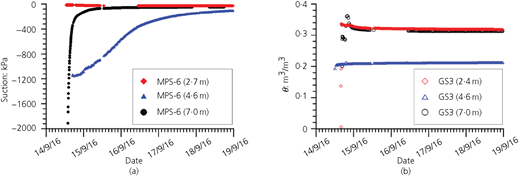
Monitoring data collected right after the sensor installation: (a) suction and (b) water content
Monitoring data collected right after the sensor installation: (a) suction and (b) water content
Soil retention behaviour
SWRCs were also investigated in the laboratory on a set of remoulded samples taken at the installation site at various depths. The experiments were run using the Hyprop (UMS, 2015), which measures the water loss due to evaporation by weighing continuously an initially saturated soil sample. During the evaporation test, two tensiometers measure the matric suction at depths equal to 0·75 and 0·25 times the sample height. At the end of the test, the sample dry density can be calculated by oven-drying the sample at 105°C. The main advantage of this method is that the hydraulic properties are obtained during transient flow, similar to what happens naturally in the subsurface, thereby estimating highly representative hydraulic properties of the porous medium under study (Romano and Santini, 1999).
The main limitation of the instrument is the maximum suction that it can measure accurately, which is limited to a threshold value of 80–100 kPa, above which tensiometers start to cavitate. For this reason, values at higher suction were obtained by coupling the evaporation test to the dew point method, using the WP4 (Decagon Devices, 2007). This method is based on the measurement of the relative humidity in a closed chamber containing the soil sample. When equilibrium is reached between the vapour in the chamber and the liquid phase in the soil, Kelvin’s equation is used to calculate the water potential from the relative humidity. This is a reference method for determining the soil hydraulic potential (Gee and Or, 2002).
Using both instruments, a series of six evaporation tests were carried out on remoulded samples of disturbed soil taken at about 2·8 m depth from the embankment crown (sample 1) and at 4·8 m depth (sample 2). Various initial void ratios were used, reflecting the range observed in the field (e0 = 0·57–0·91). After completing the third evaporation test for each sample at suction values higher than 100 kPa and prior to oven-drying, a subsample was collected for each sample and measurements at higher suctions were carried out with the WP4. Discrete measurements of suction and water content were then performed following the progressive desaturation of the soil specimens. Through this procedure and with the aim to obtain the main drying characteristic curves for a wide suction range, the WP4 measurements were thus combined to retention data that resulted from the relevant evaporation test results for both samples. Figure 8 shows the SWRCs obtained from these tests, where the curves interpolate the experimental data using the well-known van Genuchten model in Equation 1 (van Genuchten, 1980).
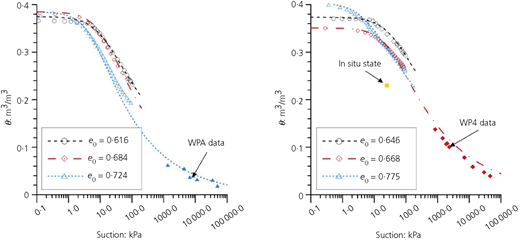
SWRCs for the main drying paths obtained by means of evaporation tests on remoulded soil sampled at (a) 2·8 and (b) 4·8 m depths from the surface. Field values (filled circle) at 4·5–4·6 m depth are plotted when equilibrium is fully reached (31 January 2017)
SWRCs for the main drying paths obtained by means of evaporation tests on remoulded soil sampled at (a) 2·8 and (b) 4·8 m depths from the surface. Field values (filled circle) at 4·5–4·6 m depth are plotted when equilibrium is fully reached (31 January 2017)
Best-fit parameters, obtained using a least square regression, are listed in Table 2. While the water content at saturation θs varies slightly with e0, which changes in the order ±0·05, the dry part of the path tends to be more independent of e0. The experimental data were fitted so as to capture accurately the knee of the curve, which is reflected in nVG and αVG. The first parameter is mainly a function of the pore size distribution and does not change significantly across the different tests, while αVG is the reciprocal of the air entry value and varies nearly an order of magnitude, starting from a few kilopascals due to the rather coarse nature of the soil. Generally, αVG is reduced with increasing e0, as the pore size of the sample increases.
Estimated main soil retention properties, initial void ratio and sampling depths
| Sample | Depth: m | e0 | θr: m3/m3 | θs: m3/m3 | αVG: kPa−1 | nVG |
|---|---|---|---|---|---|---|
| 1 | 2·7–2·9 | 0·616 | 0·00 | 0·375 | 0·092 | 1·172 |
| 0·684 | 0·00 | 0·385 | 0·084 | 1·265 | ||
| 0·724 | 0·01 | 0·385 | 0·186 | 1·267 | ||
| 2 | 4·7–4·9 | 0·646 | 0·00 | 0·373 | 0·027 | 1·204 |
| 0·668 | 0·00 | 0·351 | 0·033 | 1·237 | ||
| 0·755 | 0·00 | 0·404 | 0·185 | 1·164 |
Figure 8 also shows the soil suction and water content values measured in the field after equilibration with the surrounding environment for a specific location – that is, MPC1 at 4·5–4·6 m depth. The coupled values of soil suction and water content recorded in situ plot below, but reasonably close to, the main drying curves identified from the laboratory test, showing that the installation techniques used provide reliable results. The discrepancy could result from a number of reasons, even given the same soil composition. For example, the reconstituted samples have a slightly higher e0 than that measured in situ for that depth and the particle arrangement would not be as that of the intact soil. An additional reason is that the soil retention behaviour experienced in wetting or drying process differs (i.e. hydraulic hysteresis) and water content can be consistently coupled to suction values lower than those encountered along the main drying curve, although monitoring data for a much longer period would be needed to confirm this. Several researchers emphasised that a reliable estimation of soil retention parameters fully representing wetting and drying paths is essential for a complete definition of soil mechanical hydraulic behaviour (Jaynes, 1984; Kool et al., 1987; Likos and Yao, 2014; Topp and Miller, 1966), being particularly crucial when frequent fluctuation in water content occurs with seasonal or daily periodicity – for example, embankments, streambanks and riverbanks. For this reason, a comprehensive suite of laboratory experiments and site monitoring is required for a proper unsaturated soil characterisation and for the determination of stability and seepage conditions of the earthen structures during their lifetime.
Concluding remarks
The paper has presented the experimental aspects of a new technique for the field measurements of soil suction and water content in deep soil layers, with potential applications in the field of monitoring of road and river embankments. The first set of installations was implemented and assessed at the crown of a riverbank in the Emilia Romagna region, where instruments were successfully installed up to 7 m depth. The paper presents the essential features of the field activities and the first measurements along with the results of preliminary laboratory data as obtained by soil samples taken at the site. Special emphasis was given to the tools and the field installation procedures, focusing on practical issues and solutions that were suitably devised to
enable coupled measurement of soil suction and volumetric water content at the same depth, allowing for tracking the evolution of the field SWRC with time
record data at different depths while minimising the infrastructure disturbance
ensure a good balance between accuracy and cost-effectiveness of the instruments
allow for simple maintenance operations following the installation phase
guarantee the procedure’s simplicity and repeatability.
These key aspects provide the basis for the development of a monitoring system, which might extend over wide areas involving the use of several sensors, for which cost-effectiveness and repeatability play a crucial role.
The initial monitoring data show that the techniques adopted were successful in achieving good-quality measurements and demonstrated that the time required to reach equilibrium with the boundary conditions was rather short, but still acceptable, for various geotechnical engineering applications. Furthermore, the combination of suction and water content data was used to calculate the retention state in situ, which was then compared with preliminary retention curves obtained in the laboratory. The results look promising, although further work is required, involving longer monitoring time, comparison with direct measurement methodologies and laboratory determination of retention curves over an extended range based on intact samples. The results of this study provide a convenient experimental starting point to extend the monitoring of the soil retention behaviour in river and road embankments.
Acknowledgements
This work forms part of the activities of project Infrasafe funded in the POR FESR 2014–2020 scheme. This grant is gratefully acknowledged.

