
The aim of the paper is to prove that the compressibility and swelling of compacted fly ash in both unsaturated and fully saturated conditions are dependent on the moisture content at the compaction and on the compaction energy, as in the case of cohesive soils. The studies have been conducted on samples compacted at various water contents in conventional oedometers and the Rowe hydraulic consolidation cell and in California bearing ratio moulds (swelling tests). The one-dimensional compressibility of saturated fly ash is much higher than that of unsaturated fly ash. Deformation of unsaturated samples increases with moisture at compaction, and the samples compacted with greater effort are less compressible. The consolidation of the saturated samples decreases with their moisture content at compaction and at the reduction of the compaction energy. The swelling of ash samples decreases as the moisture during compaction increases and when compaction energy is lower. The highest swelling was obtained for the fly ash with the highest optimum water content.
Notation
- av
coefficient of compressibility
- B
Skempton’s parameter
- CC
coefficient of curvature
- CU
coefficient of uniformity
- cv
consolidation coefficient
- D50
grain effective size that corresponds to 50% passing by weight: mm
- e
void ratio
- e0
initial void ratio
- Gs
specific gravity
- h0
initial height of the sample
- k
hydraulic conductivity
- mv
coefficient of volume change
- n
air content line in relation to soil volume: %
- Sr
degree of saturation
- w
water content: %
- wopt
optimum water content: %
- wsw
water content after swelling: %
- γw
unit weight of water
- ΔwMP
difference of moisture content for sample compacted the standard Proctor method: %
- ΔwSP
difference of moisture content for sample compacted the modified method: %
- ϵv
relative vertical deformation: %
- ρd
dry density: Mg/m3
- ρd max
maximum dry density: Mg/m3
- σv
vertical stress: kPa
effective vertical stress: kPa
Introduction
The compressibility of the soil under one-dimensional (1D) strain state (oedometer compressibility) is a volume compaction process in which the vertical stress value can be increased without restriction. Between particular grains, the contact shear resistance is exceeded, but the soil sample does not yield to shearing. The identification of soil compressibility with deformability – when there is no volumetric strain in the compressed material and shear strain occurs to a very limited extent – is only suitable for the compression of the isotropic material under hydrostatic stress conditions. Compressibility without the possibility of lateral expansion takes place when the subsoil is loaded evenly over a wide surface, which corresponds to, for example, the work of the ground loaded with the embankment or the work of the mineral seals beneath the landfill. The shape of the stress–strain curves obtained in the oedometer tests is different compared to the curves determined in situ and in laboratory tests of the uniaxial and triaxial compressions. Soil swelling consists of the increase of pore volume in the soil, which is due to the increase of water content in the soil, and is a reverse process for consolidation. The relative vertical deformation ϵv, in oedometric conditions, is represented by the formula ϵv = Δh/h0, where h0 denotes the initial height of the sample, and Δh is the change of the height and corresponds to adopted range of strain. In the case of the impossible horizontal deformation, the relative vertical deformation is equal to the volumetric strain of the soil. Values of relative vertical deformation ϵv and the void ratio e are then subject to the following relation
where e0 is the initial sample void ratio and e is the final void ratio. In the instance of swelling of soil, the ϵv value is referred to as the swelling potential.
The aim of the study is to show that the swelling and compressibility of compacted fly ash in both unsaturated and fully saturated conditions are dependent on the moisture content at the compaction and on the compaction energy, as in the case of cohesive soils.
In some classical works in the field of soil mechanics (e.g. Lambe and Whitman, 1969; Mitchell et al., 1965) the engineering properties of compacted cohesive soils were related to the compaction state, which was explained by the dispersed microstructure of soil compacted on the wet side and flocculated microstructure of the soil compacted on the dry side of the Proctor compaction curve. Mercury intrusion porosimetry tests for cohesive soils confirmed that the microstructure on the dry side of optimum water content was composed of aggregates with a well-defined distinction between the ‘intra-aggregate pore population’ and the ‘inter-aggregate pore population’ full of air, because water was located only in the aggregates (Delage et al., 1996; Tarantino and De Col, 2008). For material compacted on the wet side of the Proctor optimum water content, the initial bimodal pore size distribution depends heavily on the state of saturation during compaction (Delage et al., 1996). The as-compacted structure is erased on saturation (Burton et al., 2015). Macropore space decreases as the water content or the compaction energy increases, whereas the micropore space remains unaltered by compaction. Comparing the behaviour of saturated soils under oedometric compression, it is possible to conclude that the aggregates remain even at high stresses (Otálvaro et al., 2015). According to Alonso et al. (2013), if water accesses to an initially compacted dry soil, the microstructure will saturate first, because of the strong affinity between water and clay platelets. As soon as the microvoids in clay aggregates are saturated, any excess water will enter the macropores. Merely the water partially filling the macropores will have a significant mechanical effect on the soil because the capillary effects will be exhibited just by the water forming menisci between aggregates and inert soil particles.
Fly ash differs in structure from cohesive mineral soils. The fly ash structure depends on the type of coal and the temperature distribution in the boilers. At high combustion temperatures, spherical grains form (hollow microspheres), which are also lighter than water. The most common phases and minerals forming fly ash include glass, char, quartz, mullite, magnetite, haematite, clay minerals, feldspars (plagioclase and K-feldspar), lime, calcite and gypsum–anhydrite (Vassilev and Menendez, 2005; Vassilev and Vassileva, 2007). Compacted fly ash from combustion of bituminous coal in conventional furnaces, despite its macroscopic similarity to non-cohesive soils, should always be evaluated taking into account moisture content at compaction (as determined by the compaction energy), as in the case of compacted cohesive soils. The mechanical parameters and hydraulic conductivity of fly ash depend strictly on the moisture content at compaction (Zabielska-Adamska, 2011; Zabielska-Adamska and Sulewska, 2015).
Background
The settlement of embankments built of compacted fly ash, calculated based on Terzaghi’s theory of consolidation, does not coincide with the results of field tests carried out by plate loads and with the observations of settlements of actual compacted waste embankments (Gray and Lin, 1972). Laboratory-scale studies lead to the overestimation of settlement results because they do not consider, inter alia, the increase in the stiffness of the compacted fly ash over time and the ash pozzolanic properties. Gray and Lin carried out a series of laboratory tests of fly ash compacted by the Proctor modified method. They found the influence of the degree of saturation of ash samples with water on their compressibility. Partially saturated samples were significantly less compressible than those saturated with back pressure. Leonards and Bailey (1982) in their field tests confirm the small settlement of fly ash embankment, corresponding to the very compacted sand in the static plate load test – the Vereinigung Schweizerischer Strassenfachleute (VSS) test. Pachowski (2002) cites results of studies on well-grading, compacted at optimum water content fly ash and bottom ash mixtures embedded in embankments. They show high values of deformation modules, determined by the VSS plate after second loading, of 100–300 MPa, and, after saturation with water and multiple loads, greater than 40 MPa.
Leonards and Bailey (1982) report, on the basis of oedometric tests of fly ash compacted at optimum water content, a collapse behaviour of the fly ash structure after being fed a sample of water. This has also been described by Zawisza (1990) and Trivedi and Sud (2004). Zawisza determined that the settlement of the fly ash subsoil at the model station, loaded with σv = 49 kPa, after soaking accounted for about 20–40% of total settlement. Zawisza explains the occurrence of additional settlement by the loss of capillary force action between the ash particles after its hydration. Trivedi and Sud have found that collapsibility depends on, among other things, grain size distribution, fly ash moisture and compaction, degree of consolidation, stress level, test technique and type of liquid used for soaking and even waste disposal. Fly ashes with a silt-particle size content greater than 50% are more likely to collapse than thicker ashes. Researchers have also identified a critical stress scope that ranges between 50 and 125 kPa and found that premoistened ashes show more tendency to collapse than initially dry ashes. Thus, as the ash density is more divergent than that obtained with optimum water content, the more the ash is exposed to collapse.
Kim et al. (2005) carried out compressibility studies of artificially prepared fly ash–bottom ash mixtures with a fly ash content of 50, 75 or 100%. Samples were compacted at optimum water content, subjected to saturation for 24 h and loaded to a stress of 1600 kPa. Regardless of the source of waste combustion, it was noted that the lower the content of fly ash in the mixture, the greater the compressibility of the mixture. Kim et al. provide two possible explanations for this phenomenon: irregular and porous structure of bottom ash particles and their crushability. The sharp edges of the irregular particles tend to concentrate the stresses while increasing the sample load or shearing, thus destroying them. Weak particles contain closed pores that are damaged during compression, and this increases the compressibility of the samples. Fly ash grains fill the resulting outer void, thereby increasing the deformation of the samples. Kim et al. (2005) found that the destruction of individual fly ash particles with a few megapascals of stress did not significantly affect the compressibility of the mixtures. For stresses existing in typical road embankments, the compressibility of fly ash–bottom ash mixtures or fly ash alone is similar to that of compressed mineral soils of corresponding grain size.
Kaniraj and Gayathri (2004) draw attention to the rate of the consolidation process of fly ash compacted at optimum water content and tested in the Casagrande-type consolidometer. Their samples were moistened by capillary water. Kaniraj and Gayathri suggest that Casagrande’s and Taylor’s formulas, commonly used to determine the consolidation coefficient cv on the basis of which the rate of the consolidation is evaluated, should be replaced by the equation of the basis of Terzaghi’s theory of 1D consolidation cv = k/mv·γw, where k is the fly ash hydraulic conductivity, mv is the coefficient of volume change, and γw is the unit weight of water. According to the author, this statement should not be relied on for all fly ash studies. The above equation is based, inter alia, on the assumption of the two-phase ground – that is, the full saturation of soil pores – and assumes a linear dependence of the velocity of water flow from the hydraulic gradient. In practice, this relationship is often curvilinear. Differences in the calculated cv values obtained by Kaniraj and Gayathri (2004) using Casagrande’s and Taylor’s formulas may be due to the incomplete saturation of capillary watered specimens. Mir and Sridharan (2014) investigated the effect of adding fly ash from bituminous coal combustion (0–100%) to clays of high shrinkage and swelling characteristics. The coefficient of consolidation of fly ash-treated clays increases with the increase in per cent fly ash. Nevertheless, under larger vertical stress, the effect of the percentage of fly ash on the coefficient of consolidation becomes less significant. The specimen treated with 40% of fly ash gives a swell of 0·1 and 0·25% with curing for 7 and 28 d, respectively.
All the fly ash or fly ash–bottom ash compression studies described above are based on ash compacted at optimum water content to maximum dry density or lower values of ρd. In the available literature, however, no evidence of the dependency of compressibility of ash samples on the moisture content at compaction has been found; according to the author’s own research, this is an important factor affecting ash settlement. The compressibility of fly ash depends on the moisture content at the compaction and on the compaction energy, as in the case of cohesive soil with similar grain size distribution.
In the case of compacted cohesive soils, the coefficient of compressibility depends on the acting load and on the moisture content at compaction (Lambe and Whitman, 1969; Rico Rodrigues et al., 1988). At low values of normal loads, the coefficient of compressibility for soil compacted at w < wopt is lower than that when the soil was compacted at w > wopt. At high loads, the coefficient of compressibility shows inverse relations. Carrier (2000) also extends this statement to slightly silty quartz sand (non-plastic fines), stating that the samples compacted on the dry side of optimum were found to be stiffer than samples compacted on the wet side of optimum, at the same relative compaction. Carrier thus undermines the statements of other researchers that the compressibility of compacted sands is independent of their moisture content at compaction.
The swelling of cohesive soils, as a result of access to water, is related to the degree of orientation of grains and clay platelets during compaction process. According to Rico Rodrigues et al. (1988), the smallest swelling of cohesive soils is obtained at the best compaction – that is, at optimum water content. Pisarczyk (2004) states that swelling decreases with moisture content at compaction and that the lowest values of swelling potential are obtained by compacting the cohesive soil at moisture content w > wopt, while the largest swelling is observed for samples compacted at w < wopt. The swelling also depends on the compaction energy and type of soil compaction technique (Rico Rodrigues et al., 1988). Cohesive soils compacted by means of higher energy are characterised by a larger volume increase in the presence of water. Conventional swelling tests performed on four clays (Ferber et al., 2009) confirmed the influence of initial moisture content and dry density on the swelling potential. Mercury intrusion porosimetry measurements suggested that the influence of the moisture content and the dry density was related to the microstructure changes and showed that swelling leads to an increase in micropores and a decrease in macropores.
Linear fly ash swelling tests were carried out by Wolfe et al. (2001) on samples compacted by the Proctor standard method. The research was conducted over a period of almost 3 years. It was observed that the maximum swelling of samples, tested under 2·2 kPa and compacted at w = wopt − 10%, was less than 2% and, at optimum water content, less than 1%. Increasing the load to 8·8 kPa reduced the swelling to 0·2%. These results confirm the dependence of fly ash swelling on moisture content during compaction.
Laboratory testing programme
Material
Studies on the compressibility and swelling of fly ash were carried out on various research samples of a fly ash and bottom ash mixture, henceforth referred to as fly ash because there is only a vestige of bottom ash in the mix. The waste came from the combustion of bituminous coal in the Bialystok Thermal-Electric Power Station and was taken from different locations of the dry storage yard.
The physical parameters of averaged fly ash research samples are shown in Table 1. The particular research samples slightly differed in specific gravity and grading, but all samples corresponded in terms of grading with sandy silt. Compressibility tests were performed on research samples, I, II, III and IV, and swelling tests on research samples, I, III and V.
Parameters of averaged fly ash research samples
| Sample number | D 50: mm | C U | C C | G s | SP compaction method | MP compaction method | ||
|---|---|---|---|---|---|---|---|---|
| w opt: % | ρ d max: Mg/m3 | w opt: % | ρ d max: Mg/m3 | |||||
| I | 0·08 | 5·63 | 1·11 | 2·28 | 39·0 | 1·130 | 33·0 | 1·230 |
| II | 0·09 | 4·80 | 1·63 | 2·20 | 37·5 | 1·095 | 31·5 | 1·186 |
| III | 0·07 | 3·40 | 1·69 | 2·15 | 50·0 | 0·950 | 42·5 | 1·032 |
| IV | 0·07 | 4·00 | 1·26 | 2·09 | 46·0 | 0·984 | 37·0 | 1·090 |
| V | 0·05 | 4·00 | 1·00 | 2·08 | 46·0 | 0·948 | 37·0 | 1·065 |
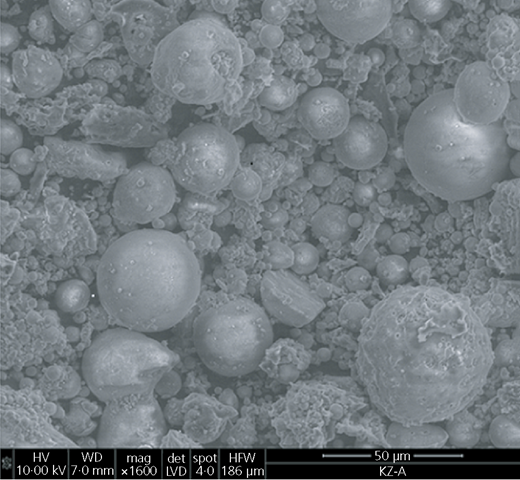
Figure 1 shows scanning electron microscopy (SEM) image of fly ash (research sample IV). X-ray diffraction patterns of the fly ash indicated basic mineralogical composition as quartz (SiO2), mullite (3Al2O3·2SiO2) and calcite (CaCO3).
Methods
The studies were performed on samples of fly ash compacted according to the standard Proctor (SP) and the modified Proctor (MP) methods of optimum water content w opt ± 5%. The range of water content corresponds to the moisture of fly ash built into the road embankments as well as into sealing barriers. The studies have been conducted as
oedometric compression tests (on compacted and non-saturated samples)
tests in the Rowe hydraulic consolidation cell (on compacted and saturated samples)
swelling tests in California bearing ratio (CBR) moulds – samples soaked after compaction.
Oedometric tests have been carried out in classical apparatus (without the measurement of the pore pressure) to stabilise sample settlements under the vertical stress σ v equal to 12·5, 25, 50, 100, 200 and 300 kPa. Fly ash was directly compacted in the oedometric ring (h 0 = 2·0 cm) to the density corresponding to the fly ash compaction curves.
The saturated fly ash compressibility tests were performed in a consolidation cell, which is generally known as the Rowe cell, which allows the testing of samples of a diameter of 15·0 cm and a height h 0 of 5·0 cm. Samples were dynamically compacted directly in the cell body or compacted in a CBR mould and then carefully relocated to the cell. The 1D consolidation of fly ash samples in the Rowe cell was carried out at vertical drainage (bottom to top), after the sample’s full saturation reached by applying increments of back pressure. The tests were performed to stabilise sample settlement under the effective vertical stress equal to 20, 50, 100, 150 and 200 kPa, induced by the pneumatic–hydraulic system.
The Rowe cell permits the saturation of the tested samples and controlling it at every stage of the cell pressure raising. Soil saturation with water is estimated based on parameter B (Skempton, 1954). According to Skempton, soil is fully saturated with water (S r = 1), when parameter B = 1. For partially saturated soils, B takes values of 0 < B < 1, and for soils compacted with the Proctor method at optimum water content, B is in the range 0·1–0·5. It is considered that using a rigorous criterion of full saturation, B = 1, for all soils is unreasonable (Lipiński and Wdowska, 2010; Shahu et al., 1999). Saturating the soil to the minimum value of Skempton’s parameter is called the quasi-saturated state. The minimum value of parameter B can be determined on the basis of the relationship between Skempton’s parameter B and the degree of saturation S r. The value of Skempton’s parameter B, which describes the minimum sufficient saturation of compacted fly ash, was established as B = 0·8.
The linear swelling values, as a relative vertical deformation of the specimen submerged in water (swelling potential) under the specific load, were determined in CBR moulds after 4 d of soaking of the sample in water (after maximum swelling). All tests were made with a consolidation load of 2·44 kPa (with ring weight of 2 × 2·27 kg) recommended by ASTM D 1883-16 (ASTM, 2016) as a minimum and sufficient load. The results of swelling of fly ash samples are limited to linear swelling, without specifying the swelling pressure.
Results and discussion
Oedometer tests
On the basis of the compressibility curves of fly ash (Figure 2), it can be stated that the settlement results of the samples are determined primarily by the compaction energy. Research sample I, with the most favourable grading, shows the lowest settlement, both primary and secondary. Research samples II and III were characterised by inferior graining parameters and show higher initial compressibility and greater settlement.
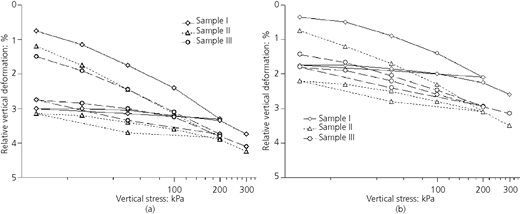
Results of oedometric tests for various unsaturated fly ash samples compacted at optimum water content (sample: I, II and III): (a) SP compaction, (b) MP compaction
Results of oedometric tests for various unsaturated fly ash samples compacted at optimum water content (sample: I, II and III): (a) SP compaction, (b) MP compaction
Figure 3 shows the load–settlement curves obtained for research sample III compacted by the SP and the MP methods at moisture contents within the range of w opt ± 5% for each compaction method. As can be seen in the figures, the moisture content of the unsaturated ash samples has a significant effect on their compressibility. Thus, the compressibility of unsaturated ash samples increases with the moisture content of the ash. The settlement of samples is the smallest at moisture content w = w opt − 5% and the highest at w = w opt + 5%. The increased stiffness of samples compacted at lower moisture content is associated with a different structure of samples compacted at various moisture contents. Ashes compacted at low moisture content form a structure of a random character. The degree of saturation of the investigated fly ash at w = w opt − 5% is about 0·75 – the fly ash is moist. The capillary forces occurring in the sample make it difficult to move the grain and thus the compressibility of the sample is low. The increase in moisture content at compaction results in less capillary forces and greater orderliness of the structure and thus greater settling of the sample during compaction. The described relationship is more visible in curves (the dependence can be determined at every initial moisture content), than in curves – for which it can be observed under higher stress (Figure 3). The relative vertical deformations of fly ash samples compacted in the 5% w opt moisture range (under σ v = 300 kPa) are 3·6–4·9% – with the SP method – and 2·9–3·8% – with the MP method – and increase proportionally to the moisture content at the compaction.
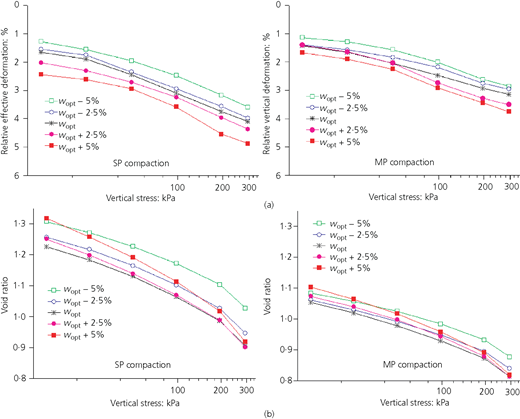
Results of oedometric tests of unsaturated fly ash samples (sample III) compacted at the moisture content range of w opt ± 5%: (a) and (b)
Results of oedometric tests of unsaturated fly ash samples (sample III) compacted at the moisture content range of w opt ± 5%: (a) and (b)
Saturated sample tests
Figure 4 shows the load–settlement curves obtained for research sample IV, compacted by the SP and the MP methods. Based on the figures, it can be concluded that the moisture content at compaction – in the case of fully saturated fly ash samples – has a significant influence on their compressibility. The ash compressibility decreases as the moisture content at compaction increases. The settlement of samples is the smallest at moisture w = w opt + 5% and the largest at w = w opt − 5% – the inverse of the relationship seen in the unsaturated samples. The greater stiffness of the samples compacted at higher moisture content can be described by Figure 5, which shows the compilation of fly ash compaction curves depending on moisture content curves and moisture content at compaction curves (while maintaining a constant sample height when saturated). Samples compacted at moisture content lower than optimum can absorb as much water as the volume of air in the compacted sample. The larger volume of water can be absorbed at lower moisture content at compaction. On the other hand, samples compacted with higher than optimum water content are already very close to their full saturation, so they absorb less water when soaked. The water in the sample can penetrate the spherical fly ash particles and is therefore more difficult to drain than the water filling the pores between the contacting ash particles when the compaction is performed at w ≤ w opt. In the case of samples compacted by the modified method, the value of negative pressure produced in the sample during saturation is higher, so that the sample can absorb more water in the porous grain.
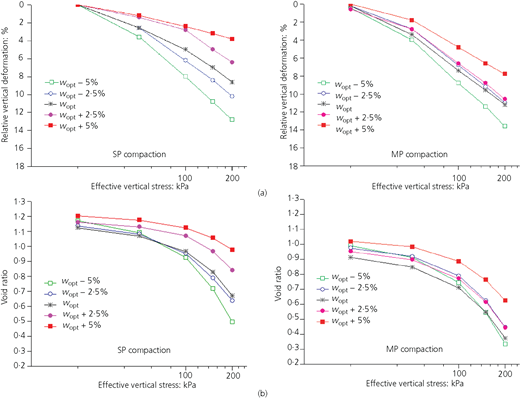
Results of tests in the hydraulic consolidation cell for saturated fly ash samples (sample IV) compacted at the moisture content range of w opt ± 5%: (a) and (b)
Results of tests in the hydraulic consolidation cell for saturated fly ash samples (sample IV) compacted at the moisture content range of w opt ± 5%: (a) and (b)
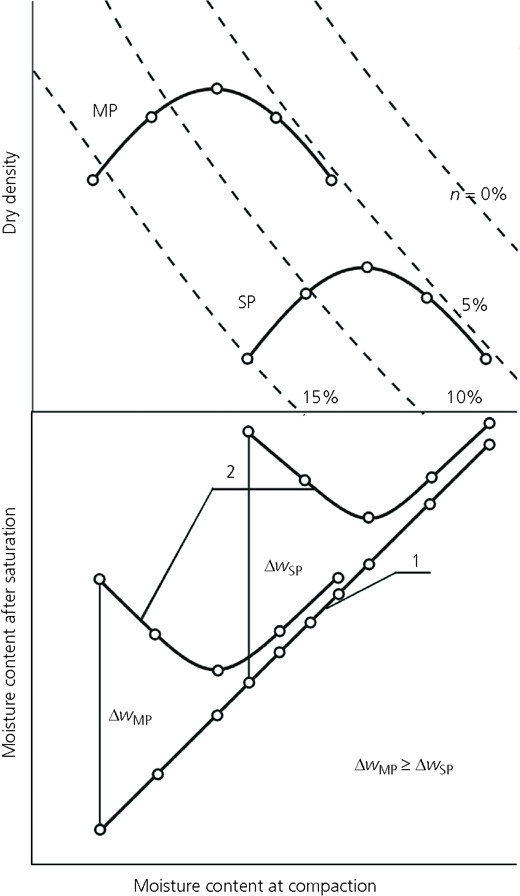
Fly ash compaction curves compared to moisture content curves after saturation and moisture content at compaction: (1) initial moisture content of the saturated samples and (2) moisture content curves of the saturated samples when it is not possible to increase the height of the samples, respectively, at standard and modified compactions
Fly ash compaction curves compared to moisture content curves after saturation and moisture content at compaction: (1) initial moisture content of the saturated samples and (2) moisture content curves of the saturated samples when it is not possible to increase the height of the samples, respectively, at standard and modified compactions
As in the case of unsaturated samples, the relationship is more evident in curves than in curves, for which it can be observed under stress higher than about 100 kPa (Figure 4). The relative vertical deformations of fly ash samples compacted in the moisture content range of w opt ± 5% (under ) are 3·8–12·8% – with the SP method – and 7·8–13·6% – with the MP method – decreasing proportionally to the moisture content at the compaction. The difference between the curves increases along with the increase in the effective stress during consolidation. curves, constructed under effective stress , can be approximated by straight lines. The author’s studies confirm that the compressibility of ash samples subjected to back pressure saturation is much higher than the compressibility of unsaturated samples (Gray and Lin, 1972). Saturation weakens interparticle contacts and removes capillary forces that counteract displacement – thus, fly ash particles are more easily displaced.
Swelling tests
Figure 6 shows the relative vertical deformation of fly ash samples soaked in water under a load of 2·44 kPa, depending on the moisture content at the compaction and the compaction method (research samples, I, III and V). The swelling potential of the samples compacted by the modified method is higher than that obtained for the same fly ash sample at standard compaction. For each of the compactions, the swelling decreases as the moisture content at compaction becomes higher. This phenomenon can be explained by the sample moisture after maximum swelling. Figure 7 shows the dependence of the moisture content of the swollen samples on their moisture content during compaction (initial moisture content), and Figure 8 shows a schematic interpretation of this phenomenon.
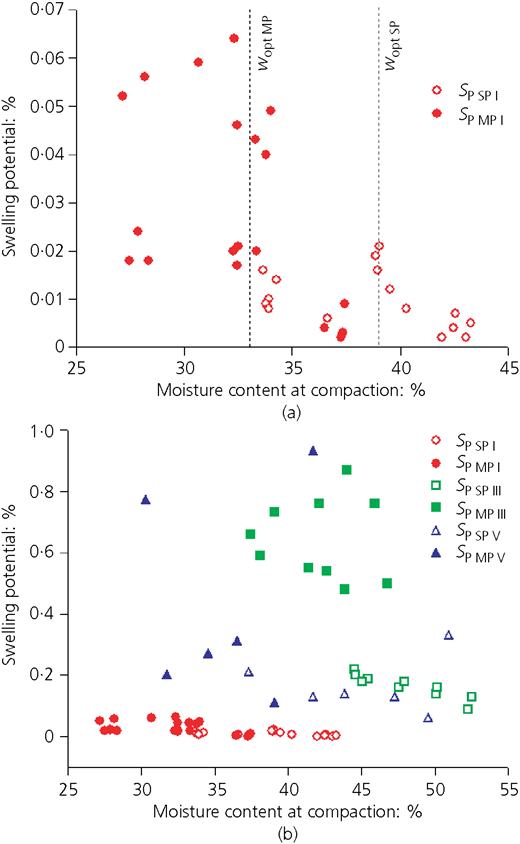
Swelling potential values of 2·44 kPa loaded samples, depending on the moisture content at compaction and the compaction method: (a) sample I and (b) all tested samples – I, III and V
Swelling potential values of 2·44 kPa loaded samples, depending on the moisture content at compaction and the compaction method: (a) sample I and (b) all tested samples – I, III and V
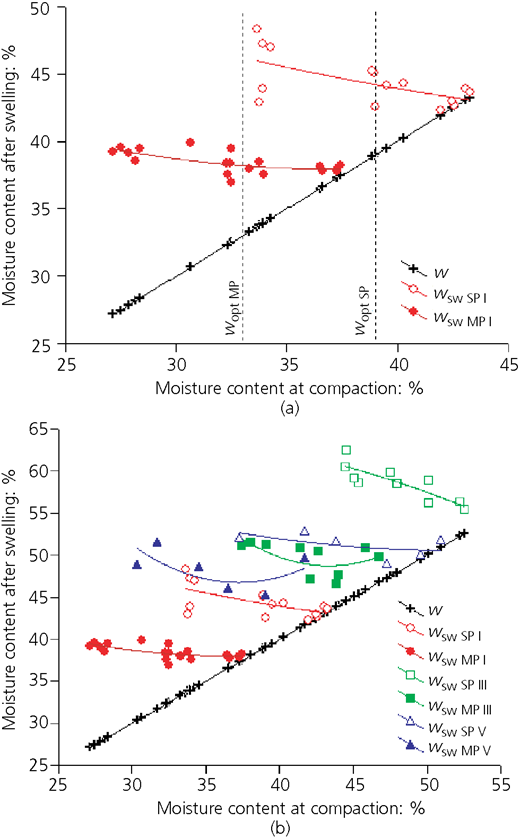
Dependence of the moisture content of the samples after their maximum swelling from moisture content at compaction: (a) sample I and (b) all tested samples – I, III and V
Dependence of the moisture content of the samples after their maximum swelling from moisture content at compaction: (a) sample I and (b) all tested samples – I, III and V
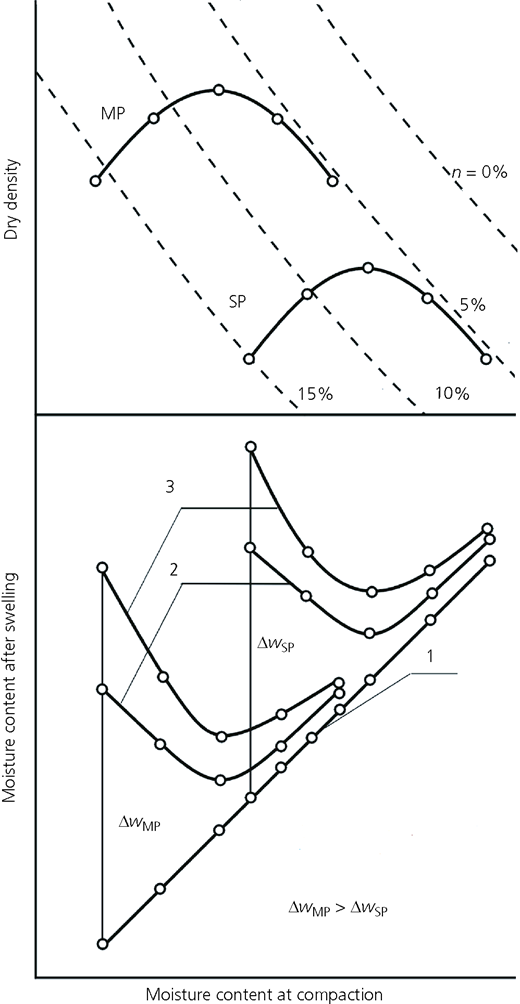
Fly ash compaction curves compared to moisture content curves after maximum swelling and moisture of the saturated samples: (1) initial moisture content of the saturated samples; (2) moisture content curves of the saturated samples when it is possible to increase the height of the samples, respectively, at standard and modified compaction; and (3) moisture content curves of the samples after maximum swelling, respectively, at standard and modified compactions
Fly ash compaction curves compared to moisture content curves after maximum swelling and moisture of the saturated samples: (1) initial moisture content of the saturated samples; (2) moisture content curves of the saturated samples when it is possible to increase the height of the samples, respectively, at standard and modified compaction; and (3) moisture content curves of the samples after maximum swelling, respectively, at standard and modified compactions
Fly ash samples compacted at lower than optimum water content, after allowing for their linear expansion (swelling), absorb more water than those compacted at moisture greater than optimum water content. Samples compacted at lower moisture content are characterised by greater pore negative pressure, higher for modified compaction than the standard one. Samples are not limited to height changes, so they can swell. The higher the difference between the moisture content at compaction and the moisture content of swollen samples, the more swollen the samples are. Samples compacted by the modified method absorb the least water at optimum water content when the pores are the smallest and partially filled with water. Figure 7(b) clearly presents the parabolic shape of the relationship curve of moisture content after swelling and moisture content at compaction, in the case of samples compacted by the modified method (more swollen), particularly in the case of samples III and V. Samples compacted by the SP method, so less swelling, present this dependency in a straight line. Thus, the lowest moisture content after soaking is obtained by the samples that are compacted at the highest moisture content.
The relative vertical deformations of the samples soaked in water, determined for the various fly ash samples, are from 0 to 0·95%. The highest swelling was obtained in the case of the fly ash sample with the highest value of the optimum water content.
Conclusions
In conclusion, it can be clearly stated that the compacted fly ash, from bituminous coal combustion in conventional power plant, despite the macroscopic similarity to non-cohesive soils, should always be assessed considering the moisture content at compaction (at the specified compaction energy), as in the case of compacted cohesive soils, and not merely based on the value of the relative compaction. On the basis of the test results, the following can be concluded.
Compressibility and swelling are strictly dependent on the fly ash moisture content at compaction.
The settlement of unsaturated samples in conventional oedometer tests increases with moisture content at compaction, and the samples compacted with higher energy are less compressible. The compressibility of unsaturated samples are limited by the capillary forces existing in the sample. Higher moisture content at compaction and lower density, which corresponds to the SP method, reduces the capillary force.
The oedometer compressibility of saturated specimens, tested in the Rowe hydraulic consolidation cell, decreases along with their moisture content at compaction and with the reduction of the compaction energy. Saturated samples that have been compacted at a moisture level close to full saturation absorb less water during soaking and are more difficult to drain than in the case of samples that are compacted at lower moisture content.
The highest linear swelling of compacted fly ash, tested in CBR moulds, was obtained in the sample with the highest optimum water content. Swelling decreases as the moisture content at compaction increases and when the compaction energy is lower. Samples that are compacted at lower moisture content, when linear expansion is possible, may absorb more water during soaking, due to higher negative pressure in pores (higher for the modified compactions), resulting in greater swelling.
The 1D compressibility of fly ash samples subjected to back pressure saturation is much higher than the compressibility of unsaturated samples. The relative vertical deformation ranges 3·6–4·9% for unsaturated samples compacted by the SP method and 2·9–3·8% for the MP method in the 5% wopt moisture range for both compaction methods. In the case of saturated samples, these values reach 3·8–12·8% and 7·8–13·6%, respectively.
The compressibility of fly ash compacted at w = wopt − 5% for both compaction methods after saturation is about four times greater than before saturation. Thus, fly ash during embankment construction should be isolated from rain and groundwater, particularly if it is compacted at a water content below optimum. The greater linear expansion is also obtained for the swelling samples if they are compacted at the lowest moisture content.
Experimental investigations on the fly ash structures are planned to be carried out using mercury intrusion porosimetry and thermoporometry to determine the size and the shape of pores in the compacted fly ash, which will enable the described phenomena to be explained.
Acknowledgements
The work, carried out at Bialystok Technical University in Poland, was supported by Polish financial resources on science under project numbers 5 T07E 051 24 and S/WBiIS/6/2013.
