


A series of three-dimensional finite-element models was developed to investigate the non-linear behaviour of pile groups connected to rigid caps and subjected to torsion. Pile groups of sizes 1 × 2, 2 × 2 and 3 × 3 installed in sand were analysed to investigate group resistance as well as the variation of pile flexural and torsion deformation. Furthermore, the relative contributions of the pile cap, pile torsion resistance and pile lateral resistance to group torsion resistance were quantitatively evaluated. The influence of group size, pile spacing, pile length, cap condition and soil stiffness was thoroughly explored. Piles were assumed to behave in a linear elastic fashion, while soil was modelled by way of the non-linear hardening-soil model. The numerical results showed that the contribution of the torsion strength of individual piles to the group overall strength decreases with the increase in group size and pile spacing but increases with the increase in pile length and soil stiffness. Among these parameters, the torsion resisted by individual piles ranged from 20 to 45% of the external applied torque. Moreover, it is found that the pile cap contributes about 7% of group resistance for surface pile caps, while this contribution increases up to 53% for embedded pile caps.
Notation
- c′
effective cohesion
- cu
undrained cohesion
- Dr
relative density
- d
pile diameter
- Ec
concrete modulus
- Ei
initial modulus
secant Young’s modulus
odometer modulus
unloading–reloading modulus
- Es
soil modulus
- e
distance between the ground surface and the pile head
- G0
soil shear modulus
- Hi
shear force on individual piles
- L
pile length
- Mt
total torsion on the pile group
- Mti
torsional moment on individual piles
- N
standard penetration test value
- n
number of pile spacings
- Pi
normal force on individual piles
reference confining pressure
- Rintf
interface reduction factor
- rm
ratio of the external applied torque to the maximum torsion capacity of the considered pile group
- ro
moment arm
- rp
ratio of the vertical load on the pile group to the ultimate vertical capacity
- S
pile spacing
- t
thickness of the pile cap
- uz
displacement in the z-direction
- γc
unit weight of concrete
- νc
Poisson’s ratio of concrete
- νs
Poisson’s ratio of soil
effective overburden pressure
- φ′
angle of internal friction
Introduction
The behaviour of pile foundations under torsion loading is a complicated phenomenon that widely affects the performance of pile-supported structures. In some typical applications, piles are primarily loaded by axial (vertical) loads due to gravity. However, in many other applications, pile foundations are subject to significant torsion that results from lateral loads produced by wind, earthquakes, ship impact, wave actions and/or other sources. When a pile group is subject to torsion, pile resistances are mobilised in various modes: torsion, axial, shear and flexure, as shown in Figure 1. The existence of torsional load affects significantly the vertical-load-carrying capacity of the pile. The induced circumferential pile–soil interface shear stress due to torsion interacts with the mobilised skin friction accompanied by the axial load. Therefore, the axial capacity decreases and the axial movement increases (Basack and Sen, 2014).
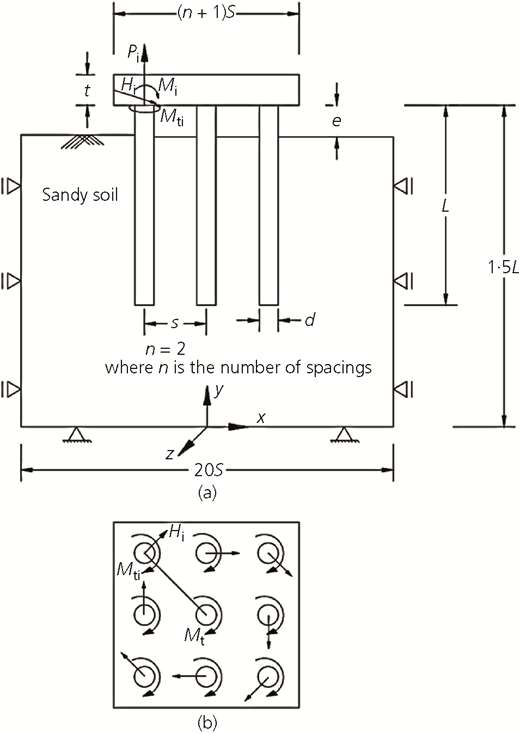
Sketch showing forces induced in individual piles (Pi, Hi and Mti) when the group is subject to torsion Mt: (a) elevation; (b) plan
Sketch showing forces induced in individual piles (Pi, Hi and Mti) when the group is subject to torsion Mt: (a) elevation; (b) plan
The pile–soil interaction under torsion loads has been investigated by only a few studies in recent decades. Numerical and testing models were performed to study the behaviour of single piles subjected to torsion (Arshad and O’Kelly, 2016; Basack and Nimbalkar, 2017; Bizaliele, 1992; Chen et al., 2016; Chow, 1985; Gu et al., 2014; Guo and Randolph, 1996; Hassan, 2019; Kong and Zhang, 2007, 2008, 2009; Laue and Sonntag, 1998; Li, 2017; Misra et al., 2014; Poulos, 1975; Randolph, 1981; Stoll, 1972; Stuedlein et al., 2016; Thiyyakkandi et al., 2016; 2017; Zhang and Kong, 2006).
Poulos (1975) presented charts for the torsion flexibility of a pile as a function of pile geometry and relative stiffness. He assumed a linear elastic behaviour for the pile and soil materials and accounted for the pile–soil interaction by utilising a continuum mechanics approach.
Torque-transfer models were presented by Randolph (1981). He applied the theory of elasticity to obtain the differential equation for torsion pile–soil interaction. A rather simple stress field assumption around single piles was used to develop closed-form solutions. This analysis was later extended by Guo and Randolph (1996), who included the effects of soil non-linearity and inhomogeneity and analysed the torsion response of piles in sand with a Gibson profile. Chow (1985) presented a discrete-element approach in which the pile was modelled as a series of elements and the soil was treated as a series of independent layers.
Zang and Tsang (2005) studied the response of a 2 × 2 bored pile group subjected to torsion using a three-dimensional (3D) finite-difference formulation. Kong and Zhang (2007) conducted a series of centrifuge model tests on torsionally loaded three-diameter-spaced 1 × 2, 2 × 2 and 3 × 3 pile groups in sand. Their results indicated that the group torsion resistance increases with increasing group size and soil density. They also observed that the mobilisation of the lateral resistance of individual piles in a group is closely related to the pile location within the group due to pile–soil–pile interaction. Further, it was found that the horizontal displacement of a pile in the group is proportional to the distance from the pile to the torsion centre of the group. Thus, piles at different locations deflect dissimilarly and mobilise different shear forces and bending moments.
Kong and Zhang (2009) proposed an empirical approach to analysing the response of a free-standing pile connected to a rigid pile cap. In their approach, the lateral and torsion behaviour were modelled by p–y and τ–θ curves, where p is the lateral soil reaction, y is the lateral pile displacement, τ is the torsion shear stress and θ is the local twist angle of the pile. The interaction among piles was predicted from Mindlin’s elastic solution, while the coupling effect of the lateral resistance of individual piles was determined using an empirical factor ‘β’. Many p–y curves are presented in the literature (e.g. Kong, 2006; Reese et al., 1974; Yan and Byrne, 1992), and several τ–θ curves for sand are also presented (Dutt and O’Neill, 1983; Hoit et al., 2001).
The present paper presents a numerical study for non-linear torsion response of pile groups with a rigid cap embedded in homogenous sandy soil. The soil is modelled by using the hardening-soil model (HSM), where the stiffness profile depends on the initial vertical and lateral stresses. Many 3D finite-element simulations are conducted using the well-known Plaxis 3D Foundation package to investigate the behaviour of pile groups subject to torsion accounting for the pile–soil–pile interaction. The influence of group size, pile length, pile spacing, embedment conditions and soil stiffness on the pile group behaviour is explored. For this purpose, the pile group behaviour is assessed in terms of (a) the applied torque against the pile cap twist angle; (b) distribution of individual pile deformation and internal forces with depth; and (c) contribution of the torsion strength of individual piles to the group overall strength. Therefore, the present numerical study expands the domain of the experimental studies published by Stoll (1972), Zhang and Kong (2006) and Kong and Zhang (2009).
Numerical modelling
For the numerical study, the finite-element method is employed. Plaxis 3D Foundation is used in this study as a tool for the analysis of 3D, non-linear soil–structure interaction problems (Bringkgreve and Vermeer, 1998). The parametric study designed and conducted for this work deals with the behaviour of pile caps under torsion loads. Soil–pile interaction analysis is performed in two stages. The first stage considers the soil self-weight to compute the initial stresses inside the soil mass through the procedure of at-rest pressure K0. This stage is conducted under the drained condition prior to the construction of the pile cap. In the second stage, all movements are reset to zero before starting the pile cap installation to ensure that all displacements refer to the external loads.
A 15-node triangular element is adopted to simulate the soil volume and piled foundation. The behaviour of soil in the current numerical analysis is governed by HSM in order to simulate better the non-linear behaviour of soil. The description of HSM was reported in detail in the literature (Zidan, 2012; Zidan and Ramadan, 2015, 2018). Several parameters of soil are assumed to define the HSM for the two types of sand, as shown in Table 1, where c′ is the effective cohesion parameter; φ′ is the angle of internal friction; is the secant Young’s modulus; is the odometer modulus; is the unloading–reloading modulus; ν is Poisson’s ratio; and Rintf is the interface reduction factor.
Soil parameters
| Sand type | c′: kN/m2 | φ′: ° | : MPa | : MPa | : MPa | νs |
|---|---|---|---|---|---|---|
| Dense sand | 1 | 40 | 35 | 35 | 105 | 0·3 |
| Loose sand | 1 | 33 | 10 | 10 | 30 | 0·2 |
In addition, the values of shear strength parameters are assumed at a confining pressure of 100 kN/m2. In order to minimise the effect of mesh dependency, refined mesh is adopted particularly around piles and the pile cap. A thin layer of an interface element is modelled to allow relative movement between the soil and the pile to take place. Therefore, the soil properties’ reduction factor, Ri, is taken equal to 0·8, which is appropriate for friction between sand and concrete. The unit weight of the soil is assumed to be 16 and 14 kN/m3 for dense and loose sands, respectively.
Furthermore, the piles and pile cap are assumed to behave as linearly elastic materials with a unit weight (γc) of 25 kN/m3, Young’s modulus (Ec) of 2 × 10⁷ kN/m2 and Poisson’s ratio (νc) of 0·2. The pile diameter (d) is assumed to be 0·75 m, while the pile cap thickness (t) is assumed to be 1·2 m.
For numerical application, the applied torsion load is modelled using four equal horizontal loads: each load is distributed along one of the four edges of the pile cap. Figure 2 presents a vertical section of the model geometry with the adopted ‘symbolic’ dimensions. Note that the vertical boundaries of the model (four faces) are restrained against horizontal translations, while its bottom boundary is restrained against both horizontal and vertical translations.
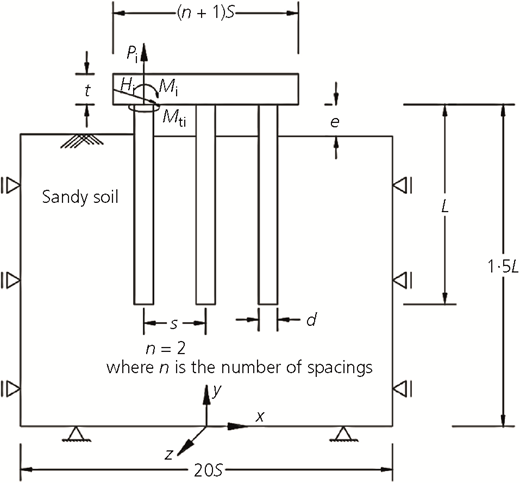
Vertical section of the model geometry for n = 2. Note that e is negative for embedded caps and is positive for piles with free ‘unsupported’ top parts
Vertical section of the model geometry for n = 2. Note that e is negative for embedded caps and is positive for piles with free ‘unsupported’ top parts
The torsion load is applied in increments until failure occurs. The variables investigated in this study include group size (n), pile spacing (S), pile length (L), distance between the ground surface and the pile head (e), soil type and vertical load carried by the pile cap (P). The results are presented in terms of a few dimensionless parameters: (L/d), (e/t) and so on. An example of the deformed mesh is presented in Figure 3 for the case of L/d = 15 and S/d = 3. This mesh includes 22 477 elements and 27 886 nodes. Table 2 lists the parameters of various analyses conducted in this paper.
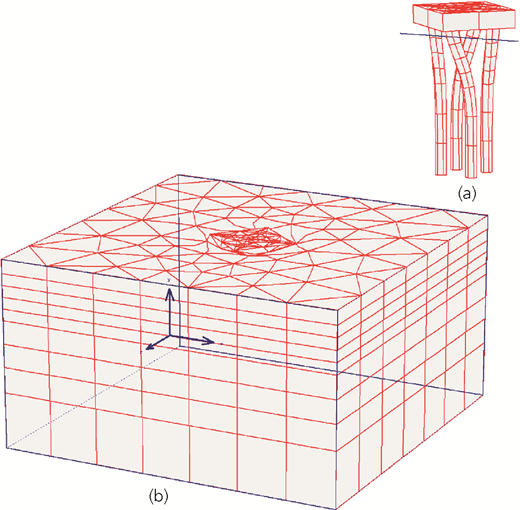
Example of model mesh in a deformed shape after torsion loading: (a) pile cap and piles; (b) soil elements
Example of model mesh in a deformed shape after torsion loading: (a) pile cap and piles; (b) soil elements
Parameters investigated in this study
| Group | Constant parameters | Variable parameters | Remarks |
|---|---|---|---|
| 1 | L/d = 15, dense soil, S/d = 3, P = 0 | Group size: 1 × 2, 2 × 2 and 3 × 3 | Influence of group size |
| 2 | 2 × 2 pile group, L/d = 15, dense soil, P = 0 | S/d = 3, 4, 5 | Influence of pile spacing |
| 3 | 2 × 2 pile group, dense soil, S/d = 3, P = 0 | L/d = 10, 15, 20 | Influence of pile length |
| 4 | 2 × 2 pile group, L/d = 15, S/d = 3, P = 0 | Dense and loose sands | Influence of soil stiffness |
| 5 | 2 × 2 pile group, L/d = 15, S/d = 3, P = 0 | e = t, 0, −t | Influence of embedment |
| 6 | 2 × 2 pile group, L/d = 15, S/d = 3, dense soil | P = ∑pi = 0, 5, 10, 20 and 30 MN | Influence of pile vertical load |
Numerical model validation
In this verification, three reported cases are studied aimed at supporting the current numerical model. The behaviour of a single pile impeded in two-layered soil studied by Stoll (1972) is considered in the first case. In the second verification, the response of a single pile penetrated in two types of sandy soil, loose and dense sands, examined by Zhang and Kong (2006) is simulated by the current numerical model. Finally, the response of pile groups – 2 × 2 and 3 × 3 – computed by Kong and Zhang (2009) is simulated by the current numerical model.
Case study 1
Stoll (1972) examined a hollow steel single pile with a length of 11·9 m passed through clay soil followed by a sand one. The steel pile was filled with concrete and has an external diameter of 0·27 m with a wall thickness of 6·33 mm. In the study by Stoll (1972), the soil profile included the values of a standard penetration test (SPT) (N). The profile of N indicates that the final resistance at the pile tip was 20 blows/foot (6·10 blows/m). Moreover, the height of the pile above the ground surface was 1·0 m. The applied torque and twist angle were monitored during the test. In order to simulate the same test, the soil stiffness along the pile length is based on the values of N reported by Stoll (1972). In the literature, a wide range of soil modulus correlations is reported that rely on N. In this verification, the soil modulus E s is computed according to the empirical equation introduced by Poulos (1994) for the axial response of a pile. In addition, these values are found to be slightly lower than that estimated with the correlation proposed by Imai and Tonouchi (1982), as referred to in the book by Kramer (1996).
According to Stoll (1972), an average N value of 4 was assigned for the top layer, soft clay. For the sandy layer, the value of N started from 4 at the top of the layer and reached 20 at the pile tip. Furthermore, the undrained shear strength parameter (c u) was determined from the correlation c u = 4·5N (Stroud, 1975). The internal friction angle (φ) is computed from SPT N values, as reported by Peck et al. (1967). As the test is modelled numerically through HSM, the secant modulus is assumed to be about 0·55E s, as described in the literature. For instance, Dung (2009) studied the modulus of Baskarp sand, and he found that E 50 equals about 55% of the initial modulus (E i) for both loose and dense sands. The hyperbolic parameters were determined by a laboratory test by Anaraki (2008) and derived numerically by Dung (2009) using the soil test facilities in Plaxis 2D. The assigned parameters for numerical simulation are shown in Table 3.
Input soil parameters for the case studied by Stoll (1972)
| Layer | c u: kPa | φ′: ° | : kN/m2 | : MPa | : MPa | ν s |
|---|---|---|---|---|---|---|
| Top layer | 18 | 0 | 28 | 28 | 56 | 0·4 |
| Second layer | 1 | 30 | 76·9a | 76·9 | 153 | 0·3 |
This value is computed at the middle of the layer where the stiffness increases with depth (16·3 MPa/m according to the soil profile)
It is also worth mentioning that the interface resistance between soil and pile circumference is a crucial issue for the pile–soil interaction problem. Hence, in the current numerical analysis, the interface coefficient (R intf) is assumed to be 0·8 for sand and 0·5 for clay (Tomlinson, 1980; Zidan, 2019). Figure 4 shows the comparison between field test results obtained by Stoll (1972) and the current numerical model. Despite the results of numerical model underestimating the lateral torsional capacity at the majority of twist levels due to the lack of knowledge regarding soil properties, the overall trend shows a satisfactory match between the numerical model and field data.
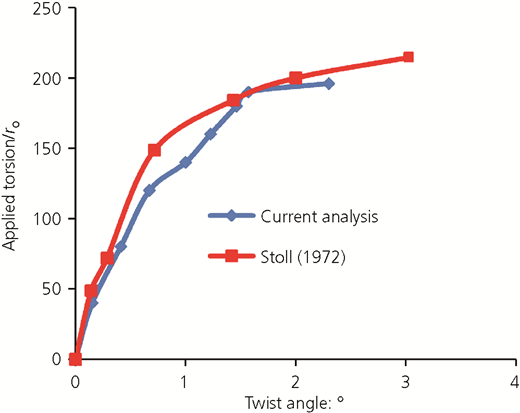
Torque–twist angle relationship measured by Stoll (1972) compared with the current analysis
Case study 2
Zhang and Kong (2006) conducted centrifuge tests on a single pile jacked in two types of sand, loose and dense sands, to investigate the pile torsional response. All tests were performed at 40g by a four-axis robotic manipulator. In their experimental study, the relative densities of loose and dense sands were 32 and 75%, respectively, with D 50 = 0·14 mm. In addition, the maximum and minimum dry densities for sand were 1·59 and 1·32 g/cm3, respectively; hence, the corresponding void ratios were 0·667 and 1·008. An aluminium tube pile with an outer diameter of 15·7 mm and a wall thickness of 0·9 mm was examined. The impeded pile length and the free height above soil were 27 and 3 cm, respectively. Moreover, a container with inside dimensions of 0·71 × 0·58 × 0·38 m was used. The torque at the pile head and the corresponding twist angle were measured throughout the tests.
In numerical simulation, as shown in Table 4, the mechanical properties of soil are calculated according to the relative densities of loose and dense sands, whereas the value of the SPT number (N) is determined by using the correlation proposed by Cubrinovski and Ishihara (1999)
Input soil parameters for the case studied by Zhang and Kong (2006)
| Sand type | c u: kN/m2 | φ′: ° | : MPa | : MPa | : MPa | ν s |
|---|---|---|---|---|---|---|
| Loose sand | 1 | 29 | 32·3 | 32·3 | 65 | 0·3 |
| Dense sand | 1 | 41 | 137 | 137 | 274 | 0·3 |
The angle of internal friction is calculated according to Hatanaka and Uchida (1996), who presented the relationship between the friction angle and the value of N where
Figure 5 shows a comparison between graphs of reported data by Zhang and Kong (2006) and the numerical results. As observed previously in case study 1, good agreement between numerical and experimental results can be observed.
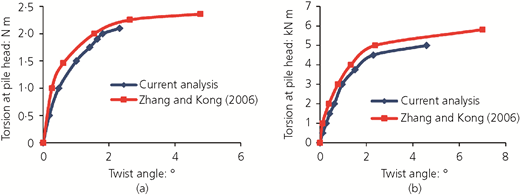
Applied torsion plotted against pile head rotation: (a) loose sand; (b) dense sand
Applied torsion plotted against pile head rotation: (a) loose sand; (b) dense sand
Case study 3
Kong and Zhang (2009) proposed an empirical approach to investigating the non-linear response of a free-standing pile connected with a rigid pile cap. In their study, the proposed approach was verified with the results of the centrifuge model reported by Kong (2006) as well as Kong and Zhang (2007). These studies reported a series of centrifuge model tests on torsion-loaded single piles and pile groups in loose and dense sands. For convenience, input data and results are calculated in prototype scale with an outside pile diameter of 0·76 m and an embedded pile length of 10·8 m. The flexural rigidity (EI) and torsion rigidity (GJ) of an individual pile were 220·5 and 169·9 MN m2, respectively, while the Poisson’s ratio of the pile was 0·3. The pile cap was 1·2 m thick and 1·2 m above the ground surface. Furthermore, the secant modulus of the soil was assumed to be 7000 kN/m2 (Kong and Zhang, 2009) at a confining pressure of 100 kN/m2 . Other soil parameters are reported in Table 5 and detailed in the paper by Kong and Zhang (2009). Although deviations between theoretical and test results are expected due to scale effects in centrifuge modelling, Figure 6 shows that the present numerical model reasonably agrees with both the test data and the theoretical prediction published by Kong and Zhang (2009) for the torque–twist angle curves. Having verified the suitability and accuracy of the present numerical model, it is now utilised in an extensive parametric study to investigate the influence of pile length, pile spacing, soil stiffness, embedment and so on, on the torsion response of pile groups.
Input parameters for cases studied by Kong and Zhang (2009)
| Pile embedded length: m | Pile free-standing length: m | Pile diameter: m | Pile Young’s modulus: MPa | Pile Poisson’s ratio | Soil friction angle: ° | Soil secant modulus: MPa | Soil unit weight: kN/m3 |
|---|---|---|---|---|---|---|---|
| 10·8 | 1·2 | 0·76 | 1·35 × 104 | 0·3 | 33 | 7 | 13·7 |
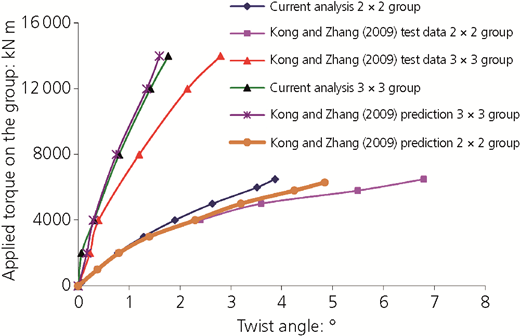
Torque–twist angle comparison between current analysis and the work by Kong and Zhang (2009)
Torque–twist angle comparison between current analysis and the work by Kong and Zhang (2009)
Numerical results
Effect of group size
The discussion in this section is based on pile groups installed in dense sands with L/d = 15, S/d = 3, P = 0 and e = t (i.e. no axial loads and no embedment). Furthermore, r m is defined as the ratio of the external applied torque to the maximum torsion capacity of the pile group. Figure 7 presents the torsion load–deformation relationships for the considered pile groups from start to failure. It is clear from Figure 7 that as the group size increases, the group torsion resistance increases, but the pile caps’ torsion rotation at failure decreases. This is so because for the same pile cap rotation, peripheral piles in larger groups experience larger horizontal translations. In particular, the ratio of the maximum pile translation at the same pile cap torsion rotation for the groups of 1 × 2, 2 × 2 and 3 × 3 is equal to d/2:d/21/2:(2d)1/2 ≈ 1·0:1·4:2·8 for the corner piles and equal to d/2:d/2:d = 1·0:1·0:2·0 for the edge piles. In other words, to have the same horizontal translation at the top of corner and edge piles in groups of 1 × 2, 2 × 2 and 3 × 3, the torsion angles should be in the ratios of 1·00:0·70:0·35 and 1·00:1·00:0·50, respectively. The ratios of maximum rotations in Figure 7 seem to be closer to those corresponding to edge piles than they are to ratios corresponding to corner piles.
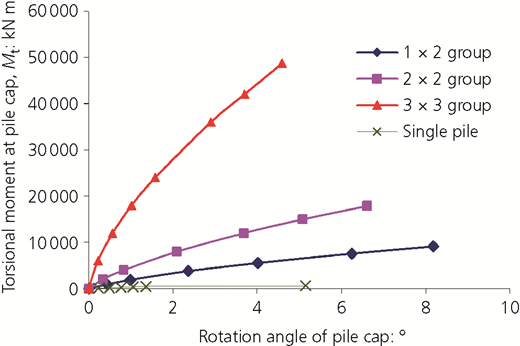
Effect of the group size on the torsion load–deformation relation of pile groups (dense sand, L/d = 15, S/d = 3, P = 0 and e = t)
Effect of the group size on the torsion load–deformation relation of pile groups (dense sand, L/d = 15, S/d = 3, P = 0 and e = t)
The effect of group size on individual piles’ torsion contribution to group torsion resistance is presented in Figure 8. This figure shows that for the small group of 1 × 2, the individual piles’ torsion contribution to group torsion resistance is as high as 45% at small torsion angles but decreases with the increase in torsion angle and becomes 32% near failure. For larger group sizes of 2 × 2 and 3 × 3, the individual piles’ torsion contribution to group torsion resistance is equal to 33 and 21% and decreases to 28 and 12% near failure, respectively. Thus, the individual piles’ torsion contribution to group torsion resistance decreases with the increase in group size or strain level.
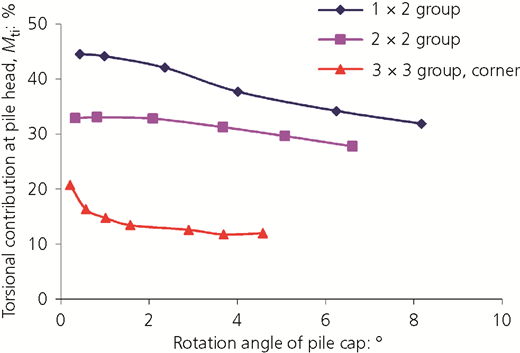
Effect of the group size on individual piles’ torsion contribution to group torsion resistance (dense sand, L/d = 15, S/d = 3, P = 0 and e = t)
Effect of the group size on individual piles’ torsion contribution to group torsion resistance (dense sand, L/d = 15, S/d = 3, P = 0 and e = t)
To complement the investigation of the effect of pile group size on the performance of pile groups subject to torsion, Figures 9(a) and 9(b) present the over-depth variation of pile lateral deformation and pile torsion angle for the case of the 1 × 2 pile group. The data in each figure are presented for various load levels as determined by the parameter r m, defined as the ratio of external applied torque to the maximum torsion capacity of the considered pile group. Further, Figures 10 and 11 present data similar to that in Figure 9 for pile groups of size 2 × 2 and 3 × 3, respectively. Note that the displacement (u z) shown in these figures is the component of the pile top lateral displacement in the z-direction, which is not the total horizontal displacement for corner piles. Figures 9–11 show that the performance of piles in different groups is qualitatively similar. The soil is able to restrain the pile tip against horizontal translation at all load levels up to failure. However, as the load increases, piles develop torsion angles along their full lengths; and near failure, the torsion angle at the pile tip is as large as 65, 57 and 55% of the torsion angle at the pile top for pile groups of sizes 1 × 2, 2 × 2 and 3 × 3, respectively. Thus, for pile groups subject to torsion, the soil loses control of pile torsion angles at the pile lower end at high load levels but keeps control of the pile lateral displacement at pile tips up to failure for the considered cases (dense sand, S/d = 3 and L/d = 15).
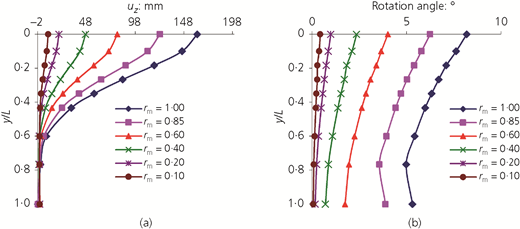
Pile deformation over the pile length for the 1 × 2 pile group (dense sand, L/d = 15, S/d = 3, P = 0 and e = t): (a) lateral deformation; (b) torsion rotation
Pile deformation over the pile length for the 1 × 2 pile group (dense sand, L/d = 15, S/d = 3, P = 0 and e = t): (a) lateral deformation; (b) torsion rotation
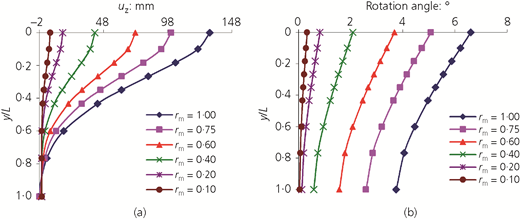
Pile deformation over the pile length for the 2 × 2 pile group (dense sand, L/d = 15, S/d = 3, P = 0 and e = t): (a) lateral deformation; (b) torsion rotation
Pile deformation over the pile length for the 2 × 2 pile group (dense sand, L/d = 15, S/d = 3, P = 0 and e = t): (a) lateral deformation; (b) torsion rotation
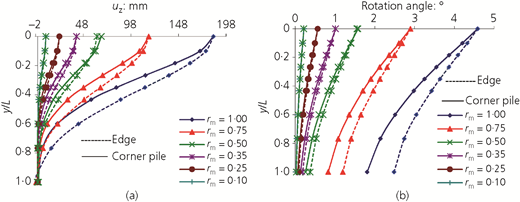
Pile deformation over pile length for the 3 × 3 pile group (dense sand, L/d = 15, S/d = 3, P = 0 and e = t): (a) lateral deformation; (b) torsion rotation
Pile deformation over pile length for the 3 × 3 pile group (dense sand, L/d = 15, S/d = 3, P = 0 and e = t): (a) lateral deformation; (b) torsion rotation
Effect of pile spacing
This section discusses the effect of pile spacing on pile group performance under torsion for 2 × 2 pile groups installed in dense sands with L/d = 15, P = 0 and e = t. Figure 12 presents the torsion load–deformation relationships and the individual piles’ torsion contribution to the group torsion resistance of the 2 × 2 group for S/d = 3, 4 and 5. Figure 12(a) shows that for the same external torsion moment, as the pile spacing increases, the torsion angle greatly decreases. Furthermore, Figure 12(b) indicates that as S/d increases from 3 to 4 then 5, the individual piles’ torsion contribution as a percentage of the group total resistance decreases from 28 to 12% then to 6%.
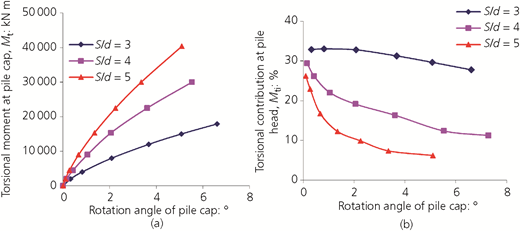
Effect of pile spacing on (a) group torsional resistance and (b) torsion contribution of individual piles (2 × 2 pile group, L/d = 15, dense sand, P = 0, e = t)
Effect of pile spacing on (a) group torsional resistance and (b) torsion contribution of individual piles (2 × 2 pile group, L/d = 15, dense sand, P = 0, e = t)
Figures 13(a) and 13(b) present the over-depth variation of pile lateral deformation and pile torsion angle, respectively, for the 2 × 2 pile group with S/d = 3, 4 and 5. It is clear from Figure 13 that the performance of pile groups with various spacings is qualitatively similar. However, as the pile spacing increases, the soil ability to control pile torsion angles decreases particularly at the pile lower end.
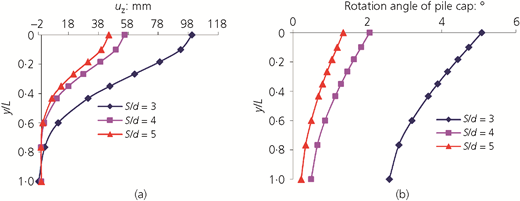
Effect of pile spacing on (a) pile lateral deformation and (b) rotation distribution along the pile length (2 × 2 pile group, L/d = 15, dense sand, P = 0, e = t)
Effect of pile spacing on (a) pile lateral deformation and (b) rotation distribution along the pile length (2 × 2 pile group, L/d = 15, dense sand, P = 0, e = t)
Effect of pile length
To evaluate the effect of pile length on pile group torsion performance, Figures 14(a) and 14(b) present the torsion load–deformation relationships and the individual piles’ torsion contribution to group torsion resistance of the 2 × 2 group for L/d = 10, 15 and 20, respectively. Other parameters are kept constant in all cases: dense sands, S/d = 3, P = 0 and e = t. It is observed from Figure 14(a) that increasing the pile length slightly increases both pile strength and stiffness. In particular, a 100% increase in pile length (from 10d to 20d) results in an 18% increase in pile group strength and a 19% decrease in the group torsion angle. Furthermore, Figure 14(b) shows that the individual piles’ torsion contribution as a percentage of the group total resistance increases from 24% at L/d = 10 to 27 and 30% as L/d increases to 15 and 20, respectively. Moreover, a slight increase in group torsion stiffness with increasing pile length is manifested in Figures 15(a) and 15(b) as the power of the soil to restrain pile lateral and torsion deformation at its tip grows with the increase in L/d.
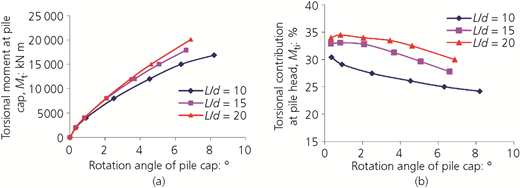
Effect of pile length on (a) group torsion resistance and (b) torsion contribution of individual piles (2 × 2 pile group, L/d = 15, dense sand, P = 0, e = t)
Effect of pile length on (a) group torsion resistance and (b) torsion contribution of individual piles (2 × 2 pile group, L/d = 15, dense sand, P = 0, e = t)
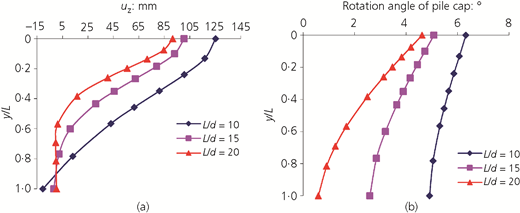
Effect of pile length on pile distribution of (a) lateral deformation and (b) rotation angle along pile length (2 × 2 pile group, L/d = 15, dense sand, P = 0, e = t)
Effect of pile length on pile distribution of (a) lateral deformation and (b) rotation angle along pile length (2 × 2 pile group, L/d = 15, dense sand, P = 0, e = t)
Effect of soil type
In order to determine the influence of soil strength on the torsional response of the pile group, the behaviour of the 2 × 2 pile group embedded in two different types of sand classified as loose and dense is investigated. Figures 16(a) and 16(b) show variations of group resistance and torsional contribution of individual piles, respectively, with the rotation angle of the pile cap. A significant difference in the group response of loose and dense soils is observed from Figure 16(a). At moderate load levels, the rotation angle of the pile group in dense sand is equal to 42% of that of the group in loose sand. Moreover, near failure, the rotation angle of the group in dense sand becomes less than 32% of that of the group in loose sand.
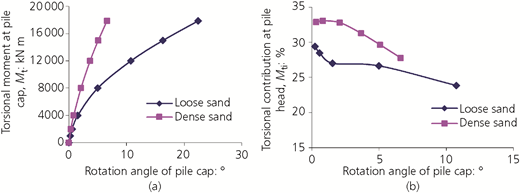
Effect of soil stiffness on (a) torsional resistance and (b) torsion contribution of individual piles (2 × 2 pile group, L/d = 15, dense sand, P = 0, e = t)
Effect of soil stiffness on (a) torsional resistance and (b) torsion contribution of individual piles (2 × 2 pile group, L/d = 15, dense sand, P = 0, e = t)
As shown in Figure 16(b), the torsional contribution of individual piles for the group in dense sand is significantly higher than that of the group in loose sand. At low levels of applied torsion, the torsional contributions of individual piles are 33 and 28% for dense and loose sands, respectively. As the applied torsion increases, these contributions decrease up to 30 and 26%, respectively.
Figures 17(a) and 17(b) show the effect of soil type on variations of the pile lateral displacement (u z) and rotation angle with depth (y). Results in Figure 17(a) are shown for the three load levels (M t = 2000, 8000 and 15 000 kN m), while results in Figure 17(b) correspond to M t = 15 000 kN m. The effect of soil stiffness on pile deformation is not significant at small load levels, but it becomes remarkable at high loads. For instance, at M t = 15 000, the lateral displacement at the pile head for loose sand is about 3·24 times that recorded for dense sand. Finally, Figure 17(b) shows that the pile rotation for loose sand is more than three times of that for dense sand.
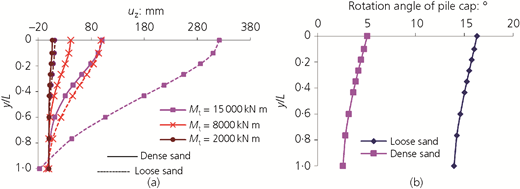
Effect of soil stiffness on the distribution of (a) pile lateral deformation at three load levels and (b) rotation angle at M t = 15 000 kN m (2 × 2 pile group, L/d = 15, P = 0, e = t)
Effect of soil stiffness on the distribution of (a) pile lateral deformation at three load levels and (b) rotation angle at M t = 15 000 kN m (2 × 2 pile group, L/d = 15, P = 0, e = t)
Effect of pile cap soil interaction (pile cap embedment condition)
In this section, the torsion behaviour of the 2 × 2 pile group is investigated for three pile cap embedment conditions (see Figure 2): (a) e = t in which the pile cap is raised above the ground surface and piles are exposed for a distance ‘t’ below the pile cap, where t is the thickness of the pile cap; (b) e = 0 in which the ground surface coincides with the pile bottom surface – that is, the surface pile cap; and (c) e = −t in which the ground surface coincides with the pile cap top surface – that is, the pile cap is embedded.
Figure 18(a) shows the impact of pile cap embedment condition (as determined by the coordinate e) on pile group torsional resistance and the corresponding rotation angle. The resistance of the pile group increases as embedment increases (i.e. as e decreases) due to the mobilised friction between the bottom of the pile cap and soil as well as the passive resistance of surface soil in contact with pile cap side faces. In particular, the torsional capacities for the surface pile cap (e = 0) and the embedded cap (e = −t) cases are about 1·18 and 1·87 times, respectively, that of the raised pile cap case (e = t). Furthermore, Figure 18(b) indicates that the torsion contribution of individual piles – as a percentage of the total torsion resistance – is lowest for the raised-pile-cap case, but highest for the surface-pile-cap case. Although the embedded-pile-cap case has the highest torsion resistance, the torsion contribution of individual piles as a fraction of the total resistance is larger than that of the raised pile cap but smaller than that of the surface pile cap.
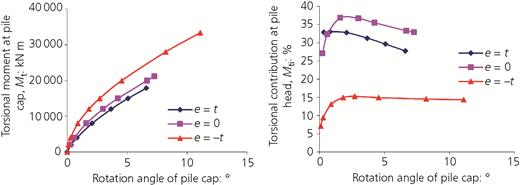
Effect of pile cap embedment condition on the (a) torsional resistance and (b) torsion contribution of individual piles (2 × 2 pile group, L/d = 15, dense sand, P = 0)
Effect of pile cap embedment condition on the (a) torsional resistance and (b) torsion contribution of individual piles (2 × 2 pile group, L/d = 15, dense sand, P = 0)
From the equilibrium of forces acting on the pile cap, the summation of the torsional contribution of individual piles (∑m i), shear contribution (∑H i × S i) and pile cap contribution is equal to the external, applied torsion. Figure 19 shows the relative values of these contributions at various rotation angles for the three considered pile cap embedment conditions. For the embedded cap case (e = −t), the maximum contribution comes from the pile cap and is about 53% at large deformation, followed by pile shear force, then individual pile torsion contributions at 32 and 15%, respectively. For the surface pile cap case (e = 0), the cap resistance relies only on bottom face friction. As a result, the contributions of pile cap, individual pile torsion and pile shear forces become about 7, 38 and 55%, respectively. Finally, for the raised-pile-cap case (e = t), the applied torsion is fully resisted by the piles alone and the contributions of individual pile torsion and pile shear forces are about 67 and 33%, respectively.
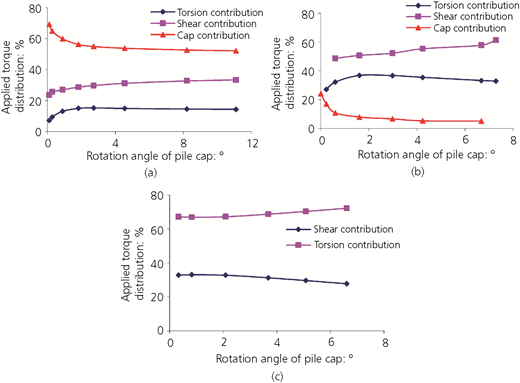
Torsion resistance contributions of individual piles’ torsion, piles’ shear forces and pile cap resistance for three embedment conditions of pile cap: (a) embedded, e = –t; (b), surface, e = 0; (c) raised, e = t (2 × 2 pile group, s/d = 3, L/d = 15, dense sand, P = 0)
Torsion resistance contributions of individual piles’ torsion, piles’ shear forces and pile cap resistance for three embedment conditions of pile cap: (a) embedded, e = –t; (b), surface, e = 0; (c) raised, e = t (2 × 2 pile group, s/d = 3, L/d = 15, dense sand, P = 0)
Finally, the influence of pile cap embedment condition (distance e) on the lateral deformation and rotation angle distribution over the pile length is shown in Figure 20 at the same ‘small’ external torsion of 15 000 kN m. As seen from Figure 20(a), the lateral deformation considerably increases in the absence of soil support to the pile cap. In addition, the effect of pile cap embedment condition is insignificant for the lower third of the pile length. At the pile head, the cap–soil interaction reduced the pile lateral displacement by 17 and 46% for the cases of surface and embedded pile caps, respectively, compared with the case of the raised pile cap. A somewhat similar effect is observed for the torsion angle, as shown in Figure 20(b). The pile twist decreased by about 20 and 48% for surface- and embedded-cap conditions, respectively, compared with the raised-pile-cap case. Contrary to its effect on pile lateral displacement, the effect of pile cap embedment condition on the pile rotation angle continued up to pile tips.
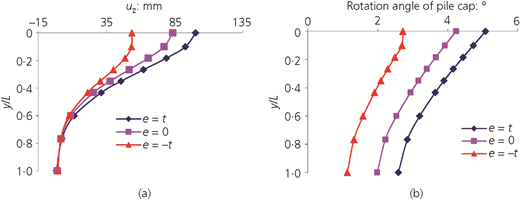
Effect of pile cap embedment condition on the distribution of (a) pile lateral deformation and (b) rotation angle (2 × 2 pile group, L/d = 15, dense sand, P = 0, small torsion moment)
Effect of pile cap embedment condition on the distribution of (a) pile lateral deformation and (b) rotation angle (2 × 2 pile group, L/d = 15, dense sand, P = 0, small torsion moment)
Effect of vertical load on piles
As torsional moments on pile groups are usually accompanied by vertical loads, this section investigates the impact of vertical loads on the torsion performance of pile groups. For tangible results, the vertical load is applied as a ratio of the ultimate vertical load capacity of the group in the absence of torsional moment. Moreover, a torsion moment of 12 000 kN m is assumed and r p is varied as (0·00, 0·15, 0·30, 0·60, 0·90). The assumed torsion is about equal to half the ultimate capacity of the group.
Figure 21(a) shows the variation of the torsional resistance contribution of individual piles with the ratio of the vertical load on piles (r p). The torsional contribution of individual piles decreases almost linearly with the increase in vertical load. The effect is marginal as the torsion contribution of piles decreased from 31·5 to 27% as r p increased from 0·0 to 0·9. However, Figure 21(b) shows that the lateral displacement of piles became more restrained as the applied vertical force increased. In addition, the lateral displacement of the pile head decreased by 21% when the vertical load ratio (r p) increased from 0·0 to 0·9. Furthermore, Figure 21(c) demonstrates that values of the twist angle over the pile length also decreased as the vertical load increased.
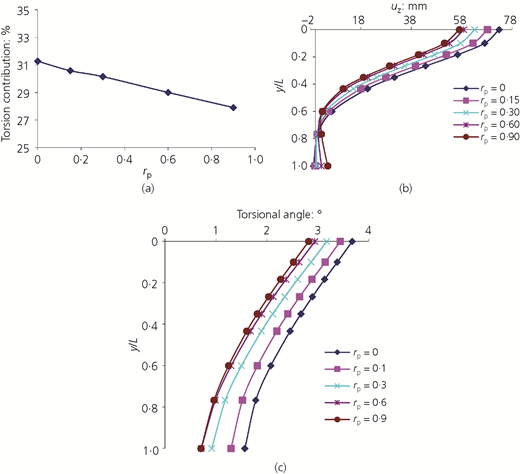
Effect of the vertical load level on the (a) torsion contribution of individual piles, (b) pile lateral deformation and (c) pile rotation angle (2 × 2 pile group, L/d = 15, dense sand, e = t)
Effect of the vertical load level on the (a) torsion contribution of individual piles, (b) pile lateral deformation and (c) pile rotation angle (2 × 2 pile group, L/d = 15, dense sand, e = t)
Conclusions
A 3D finite-element model was developed to investigate the non-linear behaviour of pile groups with rigid caps subjected to torsion. The developed model was verified by comparing its results with previously published theoretical and test results. Then, a comprehensive numerical analysis was conducted to investigate the torsional behaviour of pile groups and the relative effects of several key parameters. Based on the obtained results, the following conclusions can be drawn.
The performance of pile groups installed in specific soil and subject to torsion generally improves with increasing pile spacing, pile length, group size or pile cap embedment.
At a particular rotation angle, the torsional resistance for the 2 × 2 and 3 × 3 pile groups was about two and seven times, respectively, that determined for the 1 × 2 group.
For pile spacing, s, four and five times the pile diameter, d, the group torsion resistance was 1·9 and 2·5 times, respectively, the group resistance corresponding to s = 3d.
The individual piles’ torsion contribution as a percentage of the group total resistance increases with increasing pile length from 24% at L/d = 10 to 27 and 30% at L/d of 15 and 20, respectively.
For ‘raised’ pile caps with piles protruded one pile diameter above the ground surface, the group torsion resistance contributions from individual pile torsion resistance and pile shear resistance were 67 and 33%, respectively. When the pile cap rests at the ground surface, these contributions became 38 and 55%, respectively, where the remaining 7% was resisted by pile cap friction with ground. Finally, when the pile cap is embedded to its full thickness, the relative contributions of individual pile torsion resistance, pile shear resistance and pile cap resistance became 15, 32 and 53%, respectively. This highlights the importance of pile cap embedment condition on group response to torsion.
The torsion stiffness of the pile group increases with the application of/increase in pile cap vertical load. In particular, for the numerical examples analysed in this paper, the lateral displacement at the pile head decreased by 21% when the vertical load increased from 0·0 to 90% of the group ultimate capacity.

