

A land reclamation and ground improvement project requires an extensive study of underlying soils, fill material, performance of ground improvement works and shore-protection structures. The area of the Changi East project in Singapore is underlain by soft compressible soils, which will be filled with a greater thickness of granular soil; the project will create shore-protection structures. Therefore, the large magnitude of settlement and stability of shore-protection structures were major issues for the project. A ground improvement and engineering design process was required. This process required a detailed and comprehensive study of the ground profile and characterisation of underlying soils and fill material. Characterisation and interpretation of geotechnical parameters of soils applying specialised in situ testing has become popular due to its unique feature of measuring parameters under in situ conditions. The measured data from specialised in situ tests can be interpreted to obtain geotechnical parameters quickly in addition to soil classification and profiling without the need to collect samples. This paper presents application of specialised in situ tests as well as interpretation of measured data for land reclamation and ground improvement projects. This paper also discusses how these in situ testing methods were utilised to monitor and verify the progress of ground improvement.
Notation
- Bq
pore pressure parameter
- Ch
coefficient of consolidation due to horizontal flow
- Cu
undrained shear strength
- G
shear modulus
- h
coefficient relating overconsolidation ratio (OCR) with earth pressure coefficients
- Ic
material index
- K
hydraulic conductivity
- K0
earth pressure coefficient at rest
- K0nc
earth pressure coefficient at rest for normally consolidated soil
- K0oc
earth pressure coefficient at rest for overconsolidated soil
- KD
lateral stress index
- kh
hydraulic conductivity due to horizontal flow
- Nkt
cone factor
- Np
coefficient for pressuremeter which relates to the rigidity index
- qt
cone tip resistance
- su
undrained shear strength
- α
coefficient which relates to OCR for cone penetration tests with pore pressure measurements
- σh0
in situ total horizontal stress
- σv0
total overburden stress
effective overburden stress
Introduction
The Changi East reclamation projects in Singapore were implemented in five phases starting from 1991 and were completed in 2005. Each of these overlapping phases lasted for up to 5 years. The total implementation period was 15 years, including the maintenance period. The phases were named as Phase 1A, Phase 1B, Phase 1C, Area A (North) and Area A (South). The project area is shown in Figure 1. Due to the involvement of a large-area fill in the form of land reclamation with up to 20 m thickness of hydraulic fills over 40 m thickness of compressible marine clay, significant challenges were posed to the geotechnical engineers on issues such as slope stability, consolidation settlement and liquefaction potential.
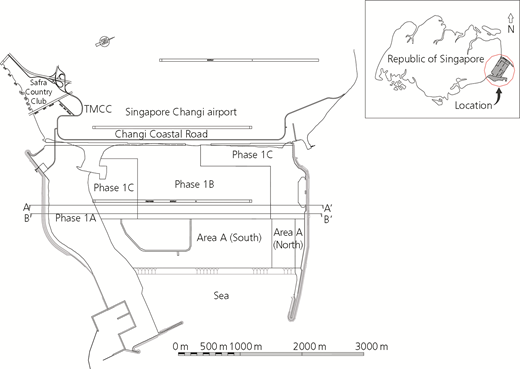
Due to the excessive magnitude of settlement likely to occur over a long period of duration caused by the consolidation process, an extensive area was required to be improved using ground improvement techniques to accelerate the consolidation process. Therefore, an accurate and extensive geotechnical characterisation of underlying soft compressible marine clay was deemed necessary. In addition to improvement of the underlying soils, ground improvement was also required for the land-reclamation fills which were loosely deposited by means of hydraulic filling techniques. Moreover, as the land reclamation was carried out at the foreshore areas, boundaries and edges of land reclamation were required to be retained and protected by suitable forms of shore-protection structures. These shore-protection structures were required for short- and long-term stability.
In order to be able to implement these complex projects successfully, using the latest state-of-the-art technologies, implementation of detailed investigation was required throughout the projects from the master planning to commissioning stages. This paper presents how the various types of specialised in situ tests were applied in the ground investigation process in Changi East reclamation and ground improvement projects which were implemented in the past decade in the Republic of Singapore.
Specialised in situ testing
As the project being carried out has major geotechnical challenges, many advanced geotechnical parameters such as shear strength, coefficient of consolidation due to horizontal flow, modulus of elasticity and overconsolidation ratio (OCR) were required for geotechnical analyses and modelling. Therefore, a few kinds of the following specialised geotechnical in situ tests were extensively used in each phase of the project, prior to land reclamation and during and after the soil improvement work
cone penetration tests (CPTs) with pore pressure measurements (CPTUs)
dilatometer tests (DMTs)
self-boring pressuremeter tests (SBPMTs)
Bengt-Arne Torstensson permeameter test (BATs).
Many of the specialised in situ tests were carried out side by side with conventional in situ tests such as field vane shear tests with standard boring and sampling prior to land reclamation at the proposed reclamation area. This process was implemented to obtain the site-specific empirical correlations, which were required for geotechnical parameter interpretations. After obtaining necessary correlations, more tests were carried out to profile the ground as well as to characterise the underlying soils. These specialised in situ tests were also carried out during reclamation and ground improvement works to monitor the progress of the ground improvement processes as well as after reclamation and ground improvement to verify the performance of reclamation and ground improvement works.
CPTs with pore pressure measurements
Extensive numbers of CPTUs were carried out for site characterisation, stratigraphic profiling, monitoring of the progress of reclamation and ground improvement, validation of the performance of ground improvement and compaction quality control. Cone resistances as well as sleeve frictions were measured during penetration, and the measured parameters were used for classification and interpretation of geotechnical parameters. CPTUs were not only used for determination of clay thicknesses and determination of prefabricated vertical drain (PVD) installation depths, but were also used for measurements of settlement after completion of ground improvement. Pore pressure dissipation tests by holding CPTU tips at the depth of interest were also carried out to determine the coefficient of consolidation due to horizontal flow (C h) as well as the hydraulic conductivity due to horizontal flow (k h). CPTU tips were also held at the particular depths of interest to measure the current state of the stabilised pore pressure to determine the state of consolidation and achievement of specified effective stress gain required. Numbers of CPTUs carried out in Changi East reclamation and ground improvement projects are given in Table 1.
Numbers of CPTs carried out in Changi East reclamation projects
| Projects | Total | |||||
|---|---|---|---|---|---|---|
| Phase 1A | Phase 1B | Phase 1C | Area A (North) | Area A (South) | ||
| Number of offshore CPTs | 0 | 162 | 168 | 4 | 37 | 371 |
| Number of land CPTs (PVD-CPTs included) | 990 | 2666 | 3674 | 881 | 1707 | 9918 |
| Number of CPT dissipation holding tests | 0 | 42 | 0 | 0 | 6 | 48 |
| Number of CPT long-term holding tests | 56 | 74 | 119 | 64 | 26 | 339 |
| Number of precompaction CPTs | 524 | 500 | 750 | 0 | 9 | 1783 |
| Number of postcompaction CPTs | 910 | 1218 | 1765 | 0 | 374 | 4267 |
| Total number of CPTs | 990 | 2828 | 3842 | 885 | 1744 | 10 289 |
| Total number of CPT holding tests | 56 | 116 | 119 | 64 | 32 | 387 |
| Total number of compaction CPTs | 1434 | 1718 | 2515 | 0 | 383 | 6050 |
| Grand total number of CPTs excluding CPT holding tests | 2424 | 4546 | 6357 | 885 | 2127 | 16 339 |
Dilatometer tests
DMTs were also carried out prior to, during and post improvement of compressible soft clay. The dilatometer blade was penetrated with the help of a CPT rig. The penetration was stopped at the depth of interest, and pressures were applied to inflate and deflate the attached membrane at the side of the blade. Pressures required to inflate as well as pressures during the deflation were measured. These measured pressures were used to interpret the material index, dilatometer modulus and lateral stress index. Using these parameters, classification of the soil types as well as interpretation of the geotechnical parameters was carried out. Dilatometer dissipation tests were carried out by holding the blade at the depths of interest, to register the dissipation of total stresses. As the dissipation of the stress was caused by pore pressure dissipation, the coefficient of consolidation due to horizontal flow (C h) as well as the hydraulic conductivity due to horizontal flow (k h) could be interpreted from the total stress dissipation tests. DMTs were also carried out to monitor the progress of ground improvement and verification of performance at the completion of the ground improvement process. Details of DMTs carried out in these projects are described by Arulrajah et al. (2004) and Chang et al. (1998).
Self-boring pressuremeter tests
A borehole was advanced using the self-boring mechanism attached at the tip of the pressuremeter cylinder. Generally, direct circulation using the mud flush drilling method was used. When the depth of interest was reached, an SBPMT was carried out by inflating the pressuremeter membrane. During the inflation, applied pressures and displacements were measured. SBPMTs were carried out to obtain the stress–strain characteristics of soils as well as limit pressures (PLs) of the soils and interpret the geotechnical parameters required using these collected parameters. SBPMTs were also carried out prior to and post ground improvement to verify the improvement of the soils.
Pore pressure dissipation tests were carried out at selected depths by holding the pressuremeter at the same position for a long duration to register the pore pressure dissipation. From the collected data from dissipation tests, the coefficient of consolidation due to horizontal flow (C h) and the hydraulic conductivity due to horizontal flow (k h) were interpreted to be used in the design of ground improvement works.
Details of SBPMT and dissipation tests using various specialised in situ equipment are described in detail by Bo et al. (2000, 2003), Arulrajah et al. (2005a, 2006a, 2006b, 2009, 2011) and Na et al. (1999).
BAT permeameter tests
The BAT tip was penetrated with the help of a CPT rig. At the selected depths of interest, hydraulic conductivity tests were carried out using the BAT permeameter applying both inflow and outflow methods. The inflow test is equivalent to the rising-head test, whereas the outflow test is equivalent to the falling-head test. In BAT permeameter testing, air pressure is used instead of water head to create the pressure gradient. Details of BATs can be found in the paper by Bo et al. (2017).
The parameters obtained prior to land reclamation investigations were used for design of land reclamation, ground improvement, shore protection and retaining structures, whereas those obtained from site investigation during ground improvement were used for monitoring of the progress of ground improvement.
The geotechnical parameters obtained from post-ground improvement site investigation were used for verifying achievement of ground improvement. Table 2 gives the number of specialised in situ tests carried out in Changi East reclamation projects.
Numbers of specialised in situ tests carried out in Changi East reclamation projects
| Projects | Total | |||||
|---|---|---|---|---|---|---|
| Phase 1A | Phase 1B | Phase 1C | Area A (North) | Area A (South) | ||
| DMT | 0 | 11 | 10 | 2 | 4 | 27 |
| SBPMT | 0 | 11 | 10 | 2 | 4 | 27 |
| BAT | 0 | 8 | 27 | 2 | 6 | 54 |
| CPMT | 0 | 85 | 31 | 0 | 0 | 116 |
| RAM sounding | 78 | 1463 | 0 | 0 | 243 | 1784 |
| Seismic cone | 0 | 3 | 0 | 0 | 0 | 3 |
| In situ permeability test | 0 | 0 | 10 | 0 | 3 | 13 |
CPMT, cone pressuremeter test
Application of specialised in situ tests in profiling of underlying soils
Application of CPTUs for soil profiling and others
Using measured cone resistances and sleeve frictions from the CPTUs, profiles of underlying soils were interpreted applying the Robertson and Campanella (1983) chart. Figure 2 shows a comparison of soil profiles interpreted from CPTUs and the sampling borehole at the Changi East reclamation site. It was found that the interpreted profiles are quite accurate and very similar to the soil profiles interpreted from the sampling borehole. Considering that the underlying soils are marine clays submerged under the sea at a depth ranging from 7 to 17 m, the soil deposits are considered to be fully saturated. Therefore, classification applying the Robertson and Campanella (1983) chart works well. With confidence in the verification of accuracy in many initial CPTs carried out at the site, CPTUs were extensively used for soil profiling works in Changi East reclamation projects. In addition, as CPTs can measure cone resistances, the increased cone resistances after penetrating the bottom of the soft clay layer were used for determination of PVD installation depths for soil improvement works. Figures 3(a) and 3(b) show the cross-section and contours of proposed installation depths for PVD for soil improvement works estimated using cone resistance data. As CPTUs can determine the interface between the seabed clay deposit and sand fill, the total settlement of the compressible soft clay layer caused by the load of sand fill after the completion of the consolidation process was determined using CPTU cone resistance data. A couple of metres’ thickness of sand fill above the groundwater level was likely to be partially saturated; therefore, it could be affected by misclassification using the material index I c applying the Robertson and Campanella (1983) chart. However, this sand fill was deposited as a clean granular sand fill consisting of less than 10% fine (fine soil is defined as fine grains of less than 75 μm) applying the hydraulic filling process. Therefore, it is unlikely to be affected by the misclassification described by Lo Presti et al. (2016).
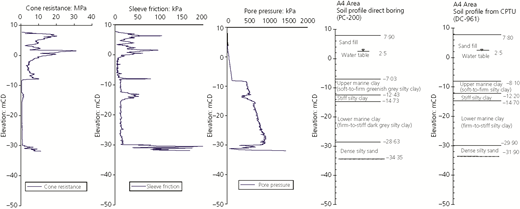
Comparison of soil profile interpreted from CPTUs and sampling borehole. mCD, metres chart datum
Comparison of soil profile interpreted from CPTUs and sampling borehole. mCD, metres chart datum
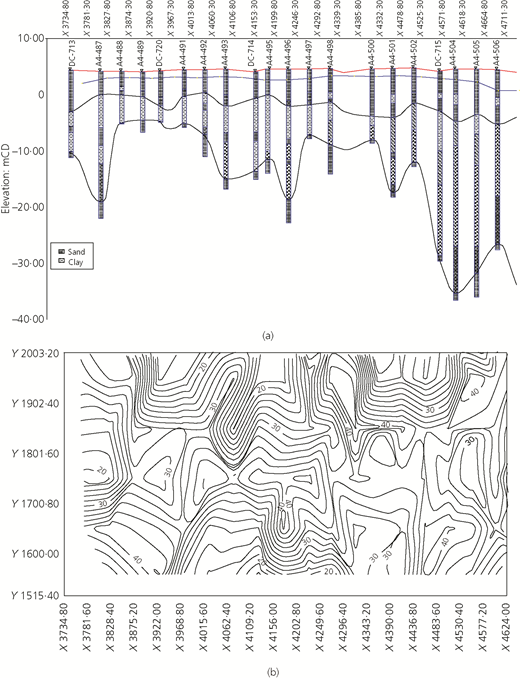
(a) Cross-section and (b) contours of proposed PVD installation depths. Distance in (a) and measurements in (b) are in metres
(a) Cross-section and (b) contours of proposed PVD installation depths. Distance in (a) and measurements in (b) are in metres
Figures 4(a)–4(c) show the magnitude of settlement determined from CPTUs. In addition, due to their ability to differentiate sand and clay, CPTUs can also be used to detect any mud waves which might have occurred during reclamation. Figure 5 shows mud waves detected from CPTUs after reclamation.
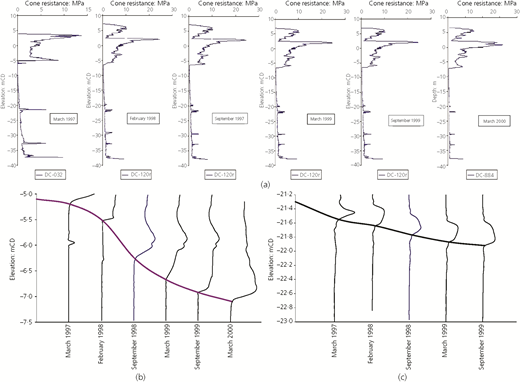
(a) Comparison of CPT profiles obtained from various dates during ground improvement. (b) Settlement profile of seabed interpreted from CPTU tests carried out over a 3-year period during ground improvement. (c) Settlement profile of lower marine clay layer from CPTU tests carried out over a 3-year period during ground improvement
(a) Comparison of CPT profiles obtained from various dates during ground improvement. (b) Settlement profile of seabed interpreted from CPTU tests carried out over a 3-year period during ground improvement. (c) Settlement profile of lower marine clay layer from CPTU tests carried out over a 3-year period during ground improvement
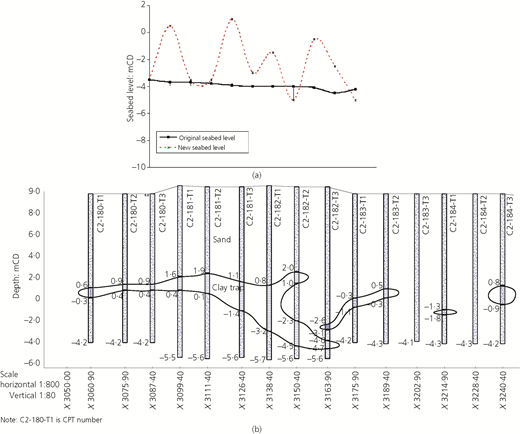
(a) Mud wave of seabed measured from CPTU tests. (b) Mud trapped measurements from CPTU tests
(a) Mud wave of seabed measured from CPTU tests. (b) Mud trapped measurements from CPTU tests
By holding a CPTU at a specific depth for a sufficiently long period of time, a CPTU can indicate the current status of pore pressure in the soil. Figure 6 shows comparison of stabilised current pore pressures from piezometers and measurement with long-duration CPTU holding during the ground improvement process. From this process, an effective stress gain, in other words the degree of consolidation, can be estimated.
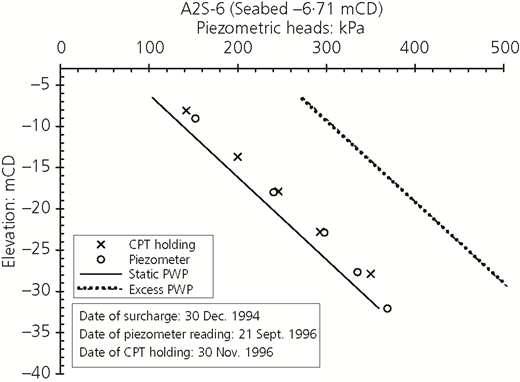
Comparison of stabilised pore pressure measured from long-duration holding CPTUs and piezometers
Comparison of stabilised pore pressure measured from long-duration holding CPTUs and piezometers
Application of DMTs for soil profiling
Measured pressures from DMTs can be interpreted to obtain material indices. Using the interpreted material indices, soil can be classified applying the method of Marchetti and Crapps (1981). This process was also used to profile the underlying soil in Changi East reclamation projects.
Measurement and interpretation of undrained shear strength applying specialised in situ tests
Undrained shear strengths were interpreted from measured, specialised in situ test data either using available correlation equations and coefficients from the published literature or otherwise developed site-specific correlations using direct measurements and parameters from specialised in situ testing.
In this particular case, in situ field vane shear tests using a Geonor vane and specialised in situ tests such as CPTUs, DMTs and SBPMTs were carried out side by side at several locations within the pilot test areas of the land reclamation project. One test location is approximately a metre away from another. Using these correlation test data, site-specific correlations were developed. As Changi East reclamation projects have many stages of pilot areas, these developed correlations were also verified and validated in the subsequent pilot tests. Brief descriptions of correlations developed are given in the following sections.
Correlation of shear strength parameters with in situ measured parameters
Correlation of cone resistance with undrained shear strength
The evaluation of undrained shear strength (su) of clay from the corrected cone resistance (qt) as obtained in the CPTU is usually based on the bearing capacity theory
where σvo is total overburden pressure and Nkt is the cone factor.
Bo et al. (1998) proposed an empirical correlation between Nkt and the plastic index (PI) based on extensive numbers of field vane test data and CPTU data from the Singapore marine clay at the site, and the correlation is as follows
The preceding equation shows that Nkt decreases with PI, although a correlation proposed by Aas et al. (1986) indicates that Nkt increases with PI. Earlier, Lunne and Eide (1976) also showed a similar trend of decreasing cone factor with PI. Details of undrained shear strength interpretation from in situ tests can be found in the paper by Bo et al. (2000). The preceding correlations are obtained by applying regression analyses from a large database using the Nkt calculated from measured cone and field vane shear strengths from the same location; the depth and PI measured from the sample collected from the same location; and the depths. Figure 7 shows undrained shear strength of Singapore marine clay interpreted from specialised in situ tests with field and laboratory measurements.
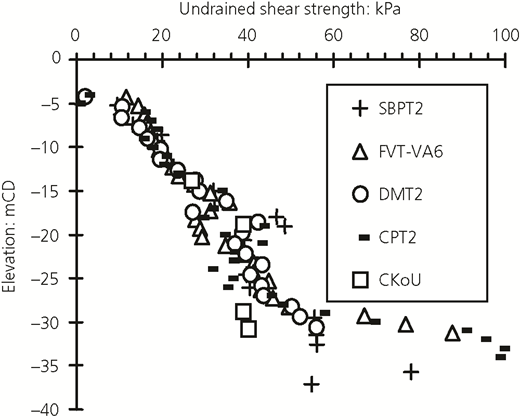
Comparison of shear strength results obtained from field vane shear tests and interpreted from specialised in situ tests
Comparison of shear strength results obtained from field vane shear tests and interpreted from specialised in situ tests
Correlation of lateral stress index from DMT with undrained shear strength
Like CPT, su can also be estimated from KD values obtained from DMT. Marchetti (1980) proposed the correlation between undrained shear strength su with lateral stress index KD as follows
where is the effective vertical stress and KD is the lateral stress index. Bo et al. (2000) proposed 1·0 as the power function for upper and intermediate Singapore marine clay and 0·7 for lower Singapore marine clay instead of 1·25.
Correlation of PL from SBPMT with undrained shear strength
Undrained shear strength can also be estimated from PL using following equation
where
where PL is the limit pressure, σh0 is the in situ total horizontal stress, G is the shear modulus, Cu is the undrained shear strength and Np is a pressuremeter constant. Marsland and Randolph (1977) adopted Np ranging between 5·5 and 6·8. It could be again suggested that the Np values for specific clay should be locally obtained by empirical correlation. Bo et al. (2000) suggested that Np values for Singapore marine clay at Changi are 6·0, 6·4 and 7·2 for upper, intermediate and lower marine clay, respectively.
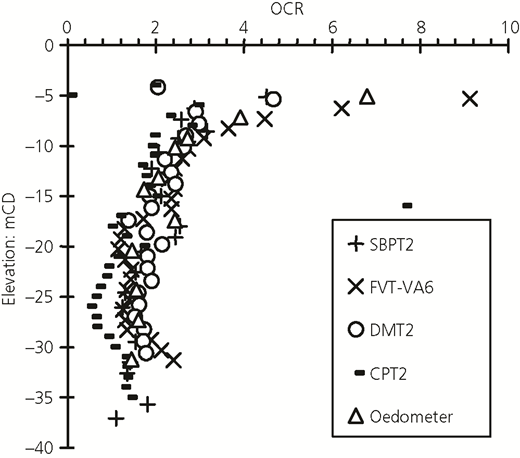
OCR interpreted from specialised in situ tests and laboratory oedometer test results
OCR interpreted from specialised in situ tests and laboratory oedometer test results
Figure 7 shows a comparison of undrained shear strength interpreted from specialised in situ tests and direct measurements using field vane shear tests. It shows that the interpreted shear strength data correlate well to the direct measurements using field vane shear tests. This correlation was obtained by applying regression analyses using many sets of pressuremeter tests and field vane shear strength tests carried out site by site at many locations and depths in Changi, Singapore. Application of undrained shear strength estimated from specialised in situ tests is also discussed and presented in the section headed ‘Application of specialised in situ test data in monitoring of the progress of ground improvement’. It is found that applications of these measurements are useful.
Measurement and interpretation of OCR applying specialised in situ tests
Correlation of OCR with in situ measured parameters
Correlation of cone resistance from CPTU with OCR
Profiling of OCR in clays by piezocone soundings was widely discussed by Mayne and Bachus (1988). Sugawara (1988) proposed the following equation for estimating OCR from clay.
Interpretation of the OCR of Singapore marine clay from CPT was also described by Chang (1991). Chang et al. (1997) proposed the correlation of OCR with pore pressure parameter Bq as follows
The estimation of OCR from the CPT can be based on the net corrected cone resistance normalised by the overburden pressures. Bo et al. (1997a, 1997b, 1998) proposed the following correlation between OCR and normalised corrected cone resistance
where α is a constant and has a value of 0·32 for the Singapore marine clay at Changi.
The preceding correlations are obtained by applying regression analyses on a large database for the Changi site using cone resistance data and OCR values interpreted from oedometer tests carried out on the samples collected at the same location and same depths from the boreholes.
Correlation of dilatometer lateral stress index with OCR
From the lateral stress index KD, the OCR of clay can be estimated as proposed by Marchetti (1980)
Bo et al. (1998) proposed 1·0 as the power function for lower and upper Singapore marine clay and 0·8 for intermediate Singapore marine clay instead of 1·56.
Correlation of total horizontal stress measured from SBPMT with OCR
Since a self-boring pressuremeter can measure the total horizontal stress, it is possible to determine the K0 values; hence, OCR can be estimated. Figure 8 also shows OCR interpreted from specialised in situ tests and laboratory results.
Determination of coefficient of consolidation and hydraulic conductivity due to horizontal flow from specialised in situ tests
Hydraulic conductivities due to horizontal flow of the formation were obtained from direct measurement using the BAT permeameter. Alternatively, the coefficient of consolidation due to horizontal flow can be obtained by carrying out dissipation tests using CPTUs, DMTs or SBPMTs. In CPTUs and SBPMTs, pore pressure transducers are used to monitor the dissipation of dynamic pore pressures which have been created due to penetration and drilling. In DMTs, dissipation of total stresses encountered during the pause of penetration is monitored. The increased total stresses are mainly due to the increase in pore pressure; therefore, the dissipation of the total stress is equivalent to the pore pressure dissipation. Interpretation of those dissipation curves provides the coefficient of consolidation due to horizontal flow. The hydraulic conductivity due to horizontal flow could be interpreted again from Ch. Figures 9 and 10 show Ch and kh interpreted from in situ specialised testing.
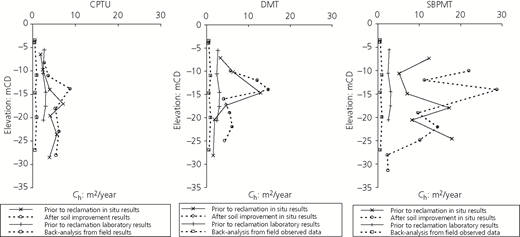
Coefficient of consolidation due to horizontal flow measured from in situ specialised tests
Coefficient of consolidation due to horizontal flow measured from in situ specialised tests
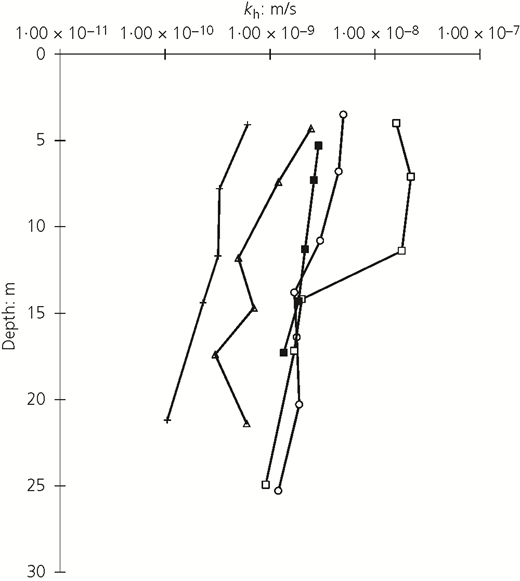
Application of geotechnical parameters interpreted from in situ tests in the design process
Geotechnical parameters for reclamation and ground improvement were obtained by carrying out conventional geotechnical borehole investigation, conventional field vane testing and laboratory tests on the collected samples. As the reclamation and ground improvement area was too large, geotechnical parameters such as undrained shear strength for some of the areas were obtained from specialised in situ tests such as CPTUs. These parameters were utilised mainly in localised slope stability analyses for the shore-protection structures.
The purpose of ground improvement in the Changi East reclamation projects was to eliminate future settlement within a shorter time frame target by accelerating the consolidation process with PVD and preloading. These involve two important aspects of the design process: prediction of the magnitude of settlement and the time rate of settlement. Due to the existence of varying thicknesses of compressible marine clay across the area, settlement as large as over 2 m was predicted and the time required to complete 90% of consolidation was predicted to be 18–24 months with the PVD process. While the accuracy of the magnitude of settlement could be predicted using the compression parameters obtained from laboratory consolidation tests on the collected undisturbed samples, accurate prediction of the time rate of consolidation required an accurate coefficient of consolidation due to horizontal flow, which is technically feasible only from specialised in situ tests such as CPTU, DMT and SBPMT dissipation tests. The time rate of consolidation was predicted by applying the finite-element modelling technique using Plaxis version 8 software, developed by Plaxis BV. A conceptual model was developed using the soil profile obtained from ground investigation involving boring, sample collection and in situ testing at the specific site. Soft soil creep model was used in the modelling. The hydraulic conductivity due to horizontal flow was obtained from in situ dissipation tests carried out at the site. Sand fill was simulated using the Mohr–Coulomb model with the stage construction approach including change in the groundwater level during the filling process. PVD was modelled with drain elements available in a full-scale model. Excess pore pressure along the drain element was set to zero during the consolidation process in all nodes that belong to a drain. Figure 11 shows comparisons of the predicted time rate of consolidation using parameters obtained from in situ specialised tests and those measured at the several pilot test areas. It can be seen the predicted time rates of consolidation are very closely aligned with measured data. Details of finite-element modelling of marine clay deformation under reclamation fills can be found in the paper by Arulrajah et al. (2005b).
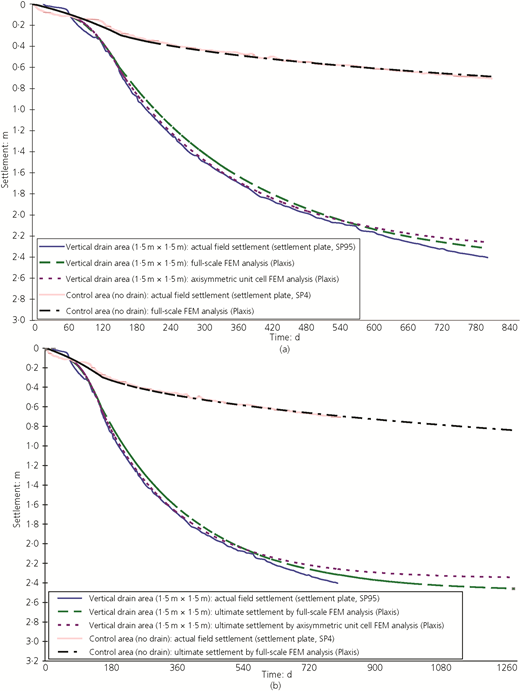
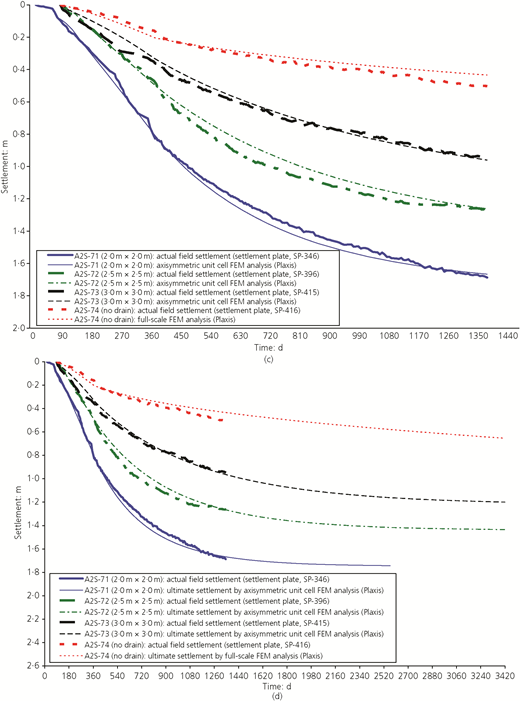
(a) Comparison of finite-element modelling (FEM) results with actual field settlement at in situ test site, 20 months after surcharge placement; (b) comparison of ultimate settlement by finite-element modelling with actual field settlement at in situ test site; (c) comparison of finite-element modelling results with actual field settlement at pilot test site, 32 months after surcharge placement; (d) comparison of ultimate settlement by finite-element modelling with actual field settlement at pilot test site
(a) Comparison of finite-element modelling (FEM) results with actual field settlement at in situ test site, 20 months after surcharge placement; (b) comparison of ultimate settlement by finite-element modelling with actual field settlement at in situ test site; (c) comparison of finite-element modelling results with actual field settlement at pilot test site, 32 months after surcharge placement; (d) comparison of ultimate settlement by finite-element modelling with actual field settlement at pilot test site
Application of specialised in situ test data in monitoring of the progress of ground improvement
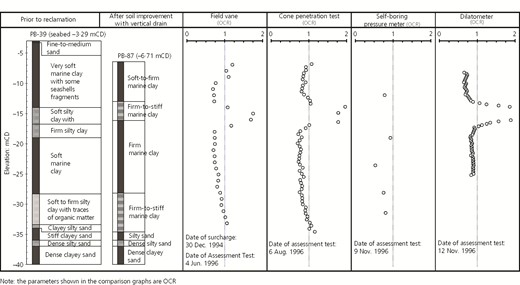
Ground improvement for accelerating the consolidation process using PVD and preloading requires monitoring of the progress of consolidation and verifying the completion of the required degree of consolidation. Such monitoring and verification are generally carried out using monitoring data from geotechnical instruments and laboratory test results from collected soil samples from improved soils at the relevant time. Alternatively, the progress of monitoring and verification of the degree of consolidation can be carried out using in situ tests as well. Two of the distinct parameters which can indicate the progress of improvement and achievement of the degree of consolidation are the increase in effective stress and undrained shear strength of the soil. As undrained shear strength and OCR can be interpreted from specialised in situ tests such as CPTUs, DMTs and SBPMTs, the progress as well as verification of the achievement of the required degree of improvement, such as the degree of consolidation, can be monitored and verified. Assessment of the degree of consolidation and performance verification of soil improvement works using specialised in situ test data were extensively described by Bo and Choa (2000), Bo et al. (2012, 2015) and Arulrajah et al. (2008). Figures 12 and 13 show the degree of consolidation (OCR) and improvement of undrained shear strength due to ground improvement work measured using specialised in situ testing. As mentioned earlier, the deposits of interest are not only submerged under the sea and have gone through the consolidation process under the additional fill load, they are also deemed to be saturated. Therefore, the partially saturated condition is not considered in the assessment.
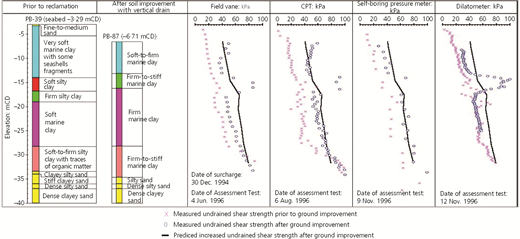
Improvement of undrained shear strength measured using specialised in situ tests after soil improvement
Improvement of undrained shear strength measured using specialised in situ tests after soil improvement
Application of specialised in situ tests in quality verification of densification work
In land reclamation by means of hydraulic filling of granular soil, loosely deposited fill is normally created. This loosely deposited fill would contribute immediate settlement from granular fill and is also prone to liquefaction due to the dynamic forces. In order to eliminate immediate settlement due to additional load and potential liquefaction, these deposits are required to be densified to increase the modulus of elasticity and relative density of the granular fill. In Changi East reclamation and ground improvement projects, granular fills were densified using deep compaction methods such as dynamic compaction, vibroflotation and Muller resonance compaction methods. Details of these methods are described in detail by Bo et al. (2017).
These improved parameters of modulus of elasticity and relative density can be verified using CPTU and SBPMT equipment by measuring cone resistances and stress–strain characteristics of granular soil. Figures 14 and 15 show comparisons of pre- and post-cone-resistance measurements and modulus measurement using CPTUs and SBPMTs. In the Changi project, the required cone resistances for runways and taxiways after deep densification were specified to be 15 and 12 MPa, respectively, for the 7–10 m thickness of sand fill. Nearly 70% of sand fill profile was submerged under the groundwater level and considered to be saturated granular soil. The remaining top part of sand fill could be partially saturated. It could slightly underestimate the relative density of sand fill which is partially saturated (Lo Presti et al., 2016). However, it will have a positive effect on the achievement criteria. In addition, the material index interpreted from registered cone resistances and the sleeve friction from CPTU reconfirmed the quality of sand fill. It was also possible to assess the liquefaction potential by applying the yield stress ratio interpreted from CPTU data (Mayne, 2014, 2017; Mayne and Styler, 2018; Mayne et al., 2009, 2017). The factor of safety for liquefaction assessed based on the cyclic resistance ratio and cyclic stress ratio could also be interpreted (Boulanger and Idriss, 2016; Moss et al., 2006; Robertson and Wride, 1998; Stark and Olson, 1995; Suzuki et al., 1995).
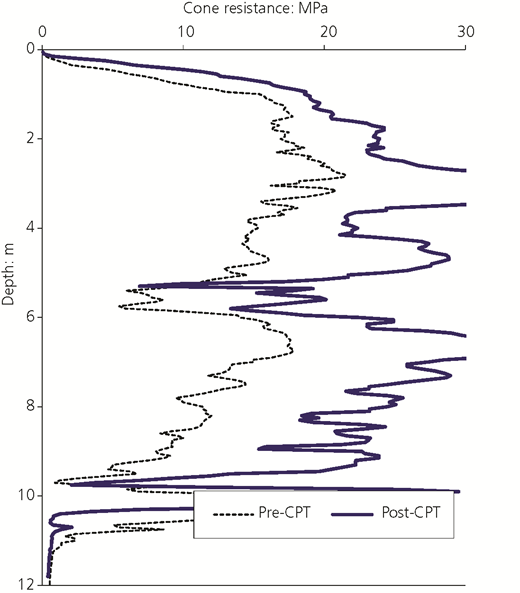
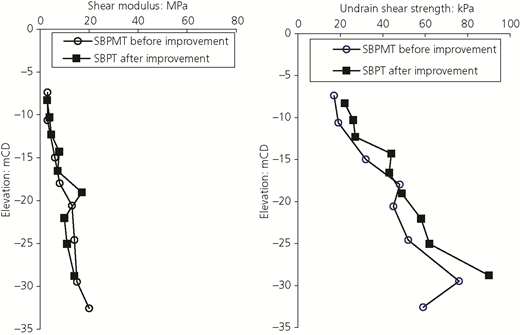
Verification of improvement of modulus of elasticity using specialised in situ tests
Verification of improvement of modulus of elasticity using specialised in situ tests
Conclusions
This paper presents how specialised in situ tests were utilised in land reclamation and ground improvement projects in Singapore. Geotechnical characterisation was undertaken using conventional site investigation, specialised laboratory testing and specialised in situ testing techniques.
These specialised in situ tests were not only used for soil classification but also used for determination of PVD installation depths, settlement measurements and detecting mud waves created and mud trapped during the sand-filling process.
Using the empirical correlations developed earlier for this specific site, geotechnical parameters such as undrained shear strength, OCR, modulus of elasticity and coefficient of consolidation due to horizontal flow were able to be interpreted for the large project area by applying specialised in situ testing methods. Not only were these interpreted parameters for design of land reclamation and ground improvement works, they were also used for monitoring of the progress of ground improvement as well as verification of the degree of the consolidation process.
These specialised in situ testing methods were very useful tools for a large-area project where an extensive amount of field investigation is required for geotechnical characterisation, ground improvement quality control, monitoring and verification of ground improvement works.

