

The recent growth in the number of sinkhole occurrences due to human activities has highlighted the need for better understanding and prediction of the problem. This paper investigates the use of Broms and Bennermark’s original stability number for trapdoor problems in cohesive soil. The shear-strength-reduction method built in a finite-difference method software program (FLAC) is used to obtain the factor of safety (FOS) under different combinations of pressures for collapse and blowout. Unlike previous research on the use of critical pressure ratios, the FOS results are now functions of the original stability number and depth ratio. The obtained numerical results are compared and validated by using rigorous upper- and lower-bound finite-element limit analysis, as well as other existing solutions available in the literature. Surface failure extents are also examined in the paper. The dimensionless ratios employed in this study are useful for preparing design charts with a broad range of trapdoor geometries and soil parameters.
Notation
- C
soil cover
- D
tunnel diameter
- E
extent of the failure surface
- H
depth from the ground surface to the trapdoor opening
- N
‘designed’ stability number
- Nc
critical stability number
- r2
correlation coefficient
- Su
undrained shear strength of soil
- W
trapdoor width
- γ
soil unit weight
- σs
surcharge pressure
- σt
support pressure
- Φ
internal friction angle of soil
Introduction
Sinkholes present environmental risk through subsidence or sudden ground collapse, leading to loss of life and infrastructure. The recent growth in the number of sinkhole occurrences due to human activities, such as urbanisation, mining and agricultural development, has highlighted the need for better understanding and prediction of the problem (Drumm et al., 2009).
Sowers (1996) outlined the sub-profile of karst soil and described the process of forming a sinkhole. It was suggested that in limestone areas, the gradual erosion of rock at a depth caused by the passing of underground water leads to subsidence of overburden deposited soil, resulting in a saucer-shaped depression. Field investigation studies (Newton, 1976; Sowers, 1996) also suggested that the underground voids, created either naturally or by humans, initiated in cracks between the underground rocks. As indicated by Tharp (2003), the initial size of the cavity does not reflect the actual size of the trapdoor at collapse because the size of the initial cavity will grow further due to internal erosion and will create a reverse-funnel shape.
A considerable number of studies have been published on the stability of trapdoors. A study was initiated by Terzaghi (1936), who experimentally investigated the effect of distributed stress in sand. The study categorised the failure as either an active or a passive mode and described active failure as occuring due to overburden pressure and passive failure occurring as an uplifting force such as an anchor.
Through laboratory experiments and field data collection, Broms and Bennermark (1967) stated that the support pressure required to maintain the stability of an opening on a vertical wall should equate to overburden pressures (surcharge and self-weight) and the undrained shear strength of the soil multiplied by a ‘factor’. The stability number (N) was therefore defined in the following equation
where σs is the surface surcharge pressure; σt is the support pressure; H is the depth of the opening; γ represents the soil unit weight; and Su is the undrained shear strength of the soil. Broms and Bennermark (1967) also concluded that the opening would be unstable when the overburden pressure (σs + γH) is six times greater than the undrained shear strength of the soil.
One of the most influential studies of underground stability comes from Davis et al. (1980), who used an analytical approach to study tunnel heading stability. Davis et al. (1980) used the limit analysis theorem to determine upper-bound and lower-bound solutions to the problem. In their approach, unlike the original Broms and Bennermark (1967) stability number approach, the problem was approached differently by using a critical pressure ratio (σs − σt)/Su, which is a function of the strength ratio (γD/Su) and depth ratio (H/W), as indicated in Equation 2. Numerous studies have since been performed using this approach (Augarde et al., 2003; Drumm et al., 2009).
Koutsabeloulis and Griffiths (1989) used the displacement finite-element method to investigate soil displacement in active and passive modes of the trapdoor problem. Martin (2009) introduced a new slip-line solution for a shallow trapdoor. Craig (1990) utilised a centrifuge model to investigate the critical stability of a circular cavity. Using the centrifugal approach, many experimental investigations of trapdoor stability have been carried out by researchers, such as Abdulla and Goodings (1996) and Jacobsz (2016). Recently, Keawsawasvong and Ukritchon (2017) studied active trapdoor problems with a linear increase in undrained shear strength with depth using finite-element limit analysis (FELA).
Although extensive research has been carried out on the stability of trapdoors in the past, most of the studies have predominately focused on the use of the critical pressure ratio ((σs − σt)/Su). Very few studies have used the original stability number approach (Broms and Bennermark, 1967) to study soil stability and further explore the relationship between the stability number and the factor of safety (FOS). In this paper, the shear-strength-reduction method (SSRM) is used with the finite-difference method (FDM) to obtain the FOS for a wide range of stability numbers (N) and depth ratios (H/W). This study also investigates the extent of sinkhole collapse on the ground surface. The results are validated by using FELA and other previous published studies. These FOS results are used to produce comprehensive design charts for the problem of trapdoor stability.
Statement of the problem and modelling technique
The development of cover-collapse sinkholes is a complex procedure due to the continuous expansion of the cavity size over the time. To simplify the problem, it is assumed that the cavity is in the critical stage where the failure is imminent. Figure 1 shows the problem definition of an idealised horizontal trapdoor underlying a homogeneous layer of cohesive soil. The undrained soil is modelled as uniform Mohr–Coulomb material with a zero soil internal friction angle (Φ = 0). Su is the undrained shear strength, and γ is the soil unit weight. The trapdoor opening width is W, and the depth from the surface to the trapdoor opening is notated as H.
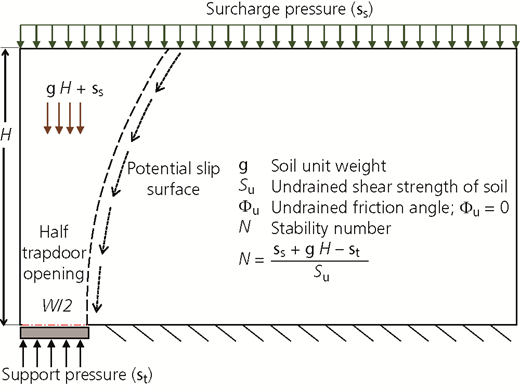
Note that the combination of surcharge pressure (σs), overburden pressure (γH) and support pressure (σt) can produce failure in either a collapse or a blowout. For undrained clay without volume loss during plastic shearing, stability results are independent of loading directions, and Broms and Bennermark’s original undrained stability number is a suitable design parameter (Shiau and Al-Asadi, 2018). For drained soils, the original stability number is not applicable.
A broad range of stability numbers (N = −15–15) and depth ratios (H/W = 1–10) have been chosen to cover all possible investigations of collapse and blowout. Note that the actual values of σs, σt, γ, Su, H, and W used in the analyses are insignificant and are not to be reported here due to the nature of the dimensionless definition. The SSRM is adopted to solve the FOS, which is a function of the stability number N and the depth ratio H/W, as shown in the following equation
Due to the lack of previous literature on implementing the FOS approach as well as correlating the stability number N to the FOS, it is important to use two techniques for the comparison of results. For this reason, both the FDM and FELA were used to analyse the problem in this paper.
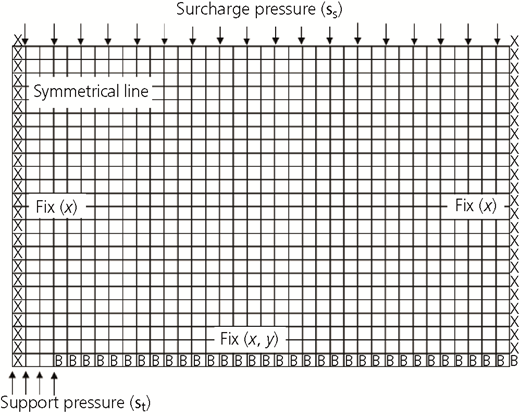
The FDM is one of the oldest techniques used in numerical studies and is a powerful method for analysing complex geotechnical stability problems involving non-linear solutions (Itasca, 2003). A typical grid for simulating the trapdoor stability problem in the FDM is shown in Figure 2. To improve the computational efficiency, a symmetrical condition is considered. This symmetrical condition is particularly important for deep cases that normally require more central processing unit time. An effective domain should be such that it is large enough to present the entire velocity field. Both the left and the right boundaries of the mesh were fixed in the x-direction, allowing the soil to move in a vertical direction. The lower boundary of the mesh was restrained in both the x- and y-directions except where the trapdoor opening is positioned. The trapdoor opening was not restrained so the soil body can freely move downwards into the cavity. A Fish script was developed to assist in auto mesh generation and problem solving of the trapdoor problem using SSRM (Shiau and Sams, 2019; Shiau et al., 2018). The Fish development was a particularly important tool in this study, as it allows parametric study to be conducted efficiently.
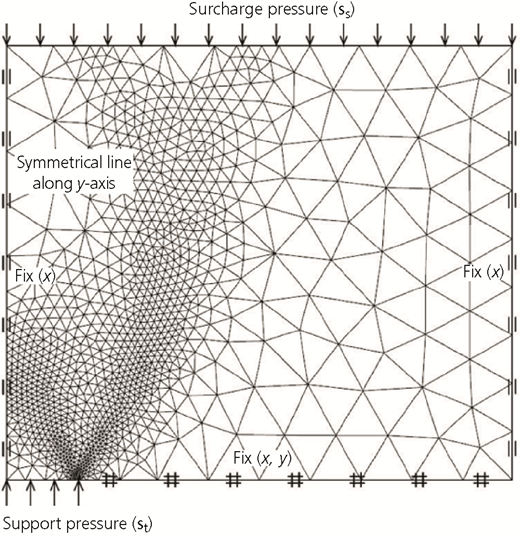
The numerical process of the FELA and SSRM is based on the limit theorems of classical plasticity, which were described by Lyamin and Sloan (2002a, 2002b) and Sloan (2013). The details of the formulation will not be repeated here. It is worth noting that the new technique utilises the finite-element discretisation to deal with complicated geometry and loading conditions and the plastic bounding theorems to bracket the true limit load using upper- and lower-bound solutions. Figure 3 shows the mesh used in the paper. The domain sizes of the models were carefully chosen by observing the non-zero velocity fields, so as to minimise boundary effects. Note that the symmetrical faces are fixed only in the normal direction (i.e. x-direction) to allow vertical movement, so as the outer face boundary. Similar to the FDM mesh, the lower face is restrained in the x- and y-directions and the top face is free to displace in all directions. The solutions are then triggered by involving the shear-strength-reduction technique stated in the paper by Krabbenhoft and Lyamin (2015).
The SSRM was utilised as early as 1975 by Zienkiewicz et al. (1975) and many other researchers to investigate various geotechnical engineering problems (Griffiths and Lane, 1999; Krabbenhoft and Lyamin, 2015; Matsui and San, 1992; Michalowski, 2002; Ugai and Leshchinsky, 1995; Yang and Drumm, 2002). Although the SSRM provides a straightforward solution to many geotechnical problems, such as slopes and retaining walls, this method has seldom been used in the analysis of underground stability problems (Shiau et al., 2017, 2018). In this study, the SSRM and FOS approach is adopted to analyse the stability of the trapdoor in collapse and blowout conditions. A total of 690 trapdoor cases are studied using the FDM, upper-bound FELA (FELA UB) and lower-bound FELA (FELA LB). Numerical results of the extensive investigation are presented in the form of design charts and equations.
Results and discussions
Comprehensive findings of this study are presented in Tables 1–3 for a broad range of stability numbers (N = −15–15) and depth ratios (H/W = 1–10). Using the data in the tables, Figure 4 plots the FOS results of collapse and blowout from the analyses of lower bound, upper bound and finite differences for the depth ratio of H/W = 3. The results show that the curves are in hyperbolic form where FOS and N are the vertical and horizontal asymptotes, respectively. The general equation of the curve is presented as follows
Equation 4 suggests that for a given depth ratio (H/W = 3), any combination of FOS and N on the curve yields a unique value. This unique value is the critical stability number (Nc), which corresponds to an FOS of 1. By drawing an FOS = 1 horizontal line in Figure 4, the two intersection points give an NC value of 4·925 for the collapse and −4·930 for the blowout.
FOS for various N and H/W values (FDM)
| N | H/W | |||||||||
|---|---|---|---|---|---|---|---|---|---|---|
| 1 | 2 | 3 | 4 | 5 | 6 | 7 | 8 | 9 | 10 | |
| −15·00 | 0·14 | 0·26 | 0·33 | 0·38 | 0·42 | 0·44 | 0·47 | 0·49 | 0·51 | 0·53 |
| −12·50 | 0·17 | 0·31 | 0·39 | 0·45 | 0·50 | 0·53 | 0·56 | 0·59 | 0·62 | 0·63 |
| −10·00 | 0·22 | 0·39 | 0·49 | 0·56 | 0·62 | 0·67 | 0·71 | 0·74 | 0·77 | 0·79 |
| −7·50 | 0·29 | 0·52 | 0·66 | 0·76 | 0·83 | 0·89 | 0·94 | 0·99 | 1·02 | 1·06 |
| −5·00 | 0·43 | 0·78 | 0·99 | 1·13 | 1·24 | 1·33 | 1·41 | 1·49 | 1·53 | 1·59 |
| −3·00 | 0·72 | 1·30 | 1·65 | 1·89 | 2·08 | 2·23 | 2·35 | 2·46 | 2·56 | 2·65 |
| −2·00 | 1·08 | 1·95 | 2·47 | 2·83 | 3·11 | 3·34 | 3·53 | 3·70 | 3·83 | 3·98 |
| −1·00 | 2·16 | 3·90 | 4·94 | 5·67 | 6·24 | 6·70 | 7·09 | 7·42 | 7·67 | 7·98 |
| −0·75 | 2·88 | 5·20 | 6·59 | 7·57 | 8·32 | 8·94 | 9·46 | 9·90 | 10·24 | 10·66 |
| −0·50 | 4·32 | 7·80 | 9·89 | 11·35 | 12·49 | 13·40 | 14·17 | 14·83 | 15·42 | 15·95 |
| −0·25 | 8·64 | 15·60 | 19·77 | 22·74 | 25·04 | 26·93 | 28·52 | 29·91 | 31·16 | 31·90 |
| 0·00 | Infinity | Infinity | Infinity | Infinity | Infinity | Infinity | Infinity | Infinity | Infinity | Infinity |
| 0·25 | 8·63 | 15·59 | 19·74 | 22·65 | 24·92 | 26·73 | 28·26 | 29·58 | 30·90 | 31·50 |
| 0·50 | 4·31 | 7·79 | 9·86 | 11·32 | 12·43 | 13·34 | 14·10 | 14·75 | 15·38 | 15·95 |
| 0·75 | 2·88 | 5·19 | 6·57 | 7·54 | 8·29 | 8·89 | 9·39 | 9·83 | 10·23 | 10·58 |
| 1·00 | 2·16 | 3·89 | 4·93 | 5·65 | 6·21 | 6·66 | 7·04 | 7·37 | 7·66 | 7·91 |
| 2·00 | 1·08 | 1·95 | 2·46 | 2·82 | 3·10 | 3·33 | 3·52 | 3·68 | 3·83 | 3·95 |
| 3·00 | 0·72 | 1·30 | 1·64 | 1·88 | 2·07 | 2·22 | 2·34 | 2·45 | 2·55 | 2·62 |
| 5·00 | 0·43 | 0·78 | 0·99 | 1·13 | 1·24 | 1·33 | 1·40 | 1·47 | 1·53 | 1·58 |
| 7·50 | 0·29 | 0·52 | 0·66 | 0·75 | 0·83 | 0·89 | 0·94 | 0·98 | 1·02 | 1·05 |
| 10·00 | 0·22 | 0·39 | 0·49 | 0·56 | 0·62 | 0·67 | 0·71 | 0·74 | 0·76 | 0·79 |
| 12·50 | 0·17 | 0·31 | 0·39 | 0·45 | 0·50 | 0·53 | 0·56 | 0·59 | 0·61 | 0·63 |
| 15·00 | 0·14 | 0·26 | 0·33 | 0·38 | 0·41 | 0·44 | 0·47 | 0·49 | 0·51 | 0·53 |
FOS for various N and H/W values (FELA UB)
| N | H/W | |||||||||
|---|---|---|---|---|---|---|---|---|---|---|
| 1 | 2 | 3 | 4 | 5 | 6 | 7 | 8 | 9 | 10 | |
| −15·00 | 0·13 | 0·25 | 0·32 | 0·37 | 0·41 | 0·44 | 0·46 | 0·48 | 0·50 | 0·52 |
| −12·50 | 0·16 | 0·30 | 0·38 | 0·44 | 0·49 | 0·52 | 0·55 | 0·58 | 0·60 | 0·62 |
| −10·00 | 0·20 | 0·37 | 0·48 | 0·55 | 0·61 | 0·65 | 0·69 | 0·73 | 0·75 | 0·78 |
| −7·50 | 0·26 | 0·50 | 0·64 | 0·74 | 0·81 | 0·87 | 0·92 | 0·97 | 1·01 | 1·04 |
| −5·00 | 0·40 | 0·74 | 0·96 | 1·10 | 1·22 | 1·31 | 1·38 | 1·45 | 1·51 | 1·56 |
| −3·00 | 0·66 | 1·24 | 1·59 | 1·84 | 2·03 | 2·18 | 2·31 | 2·42 | 2·51 | 2·60 |
| −2·00 | 0·99 | 1·85 | 2·38 | 2·76 | 3·04 | 3·27 | 3·46 | 3·62 | 3·78 | 3·90 |
| −1·00 | 1·98 | 3·70 | 4·77 | 5·51 | 6·11 | 6·53 | 6·93 | 7·24 | 7·55 | 7·80 |
| −0·75 | 2·64 | 4·95 | 6·34 | 7·36 | 8·11 | 8·72 | 9·22 | 9·66 | 10·06 | 10·40 |
| −0·50 | 3·96 | 7·39 | 9·53 | 11·03 | 12·21 | 13·07 | 13·85 | 14·50 | 15·11 | 15·60 |
| −0·25 | 7·92 | 14·79 | 19·06 | 22·05 | 24·30 | 26·13 | 27·71 | 28·99 | 30·22 | 31·20 |
| 0·00 | Infinity | Infinity | Infinity | Infinity | Infinity | Infinity | Infinity | Infinity | Infinity | Infinity |
| 0·25 | 7·92 | 14·79 | 19·06 | 22·05 | 24·32 | 26·13 | 27·71 | 28·99 | 30·22 | 31·20 |
| 0·50 | 3·96 | 7·42 | 9·53 | 11·03 | 12·16 | 13·07 | 13·85 | 14·50 | 15·11 | 15·60 |
| 0·75 | 2·64 | 4·95 | 6·34 | 7·36 | 8·11 | 8·72 | 9·22 | 9·67 | 10·06 | 10·40 |
| 1·00 | 1·98 | 3·70 | 4·77 | 5·51 | 6·08 | 6·53 | 6·93 | 7·25 | 7·55 | 7·80 |
| 2·00 | 0·99 | 1·85 | 2·38 | 2·76 | 3·04 | 3·27 | 3·46 | 3·62 | 3·78 | 3·90 |
| 3·00 | 0·66 | 1·24 | 1·59 | 1·84 | 2·03 | 2·18 | 2·31 | 2·42 | 2·51 | 2·60 |
| 5·00 | 0·40 | 0·74 | 0·96 | 1·10 | 1·22 | 1·31 | 1·38 | 1·45 | 1·51 | 1·56 |
| 7·50 | 0·26 | 0·50 | 0·64 | 0·74 | 0·81 | 0·87 | 0·92 | 0·97 | 1·01 | 1·04 |
| 10·00 | 0·20 | 0·37 | 0·48 | 0·74 | 0·61 | 0·65 | 0·69 | 0·73 | 0·75 | 0·78 |
| 12·50 | 0·16 | 0·30 | 0·38 | 0·44 | 0·49 | 0·52 | 0·55 | 0·58 | 0·60 | 0·63 |
| 15·00 | 0·13 | 0·25 | 0·37 | 0·37 | 0·41 | 0·44 | 0·46 | 0·48 | 0·50 | 0·52 |
FOS for various N and H/W values (FELA LB)
| N | H/W | |||||||||
|---|---|---|---|---|---|---|---|---|---|---|
| 1 | 2 | 3 | 4 | 5 | 6 | 7 | 8 | 9 | 10 | |
| −15·00 | 0·13 | 0·24 | 0·31 | 0·36 | 0·39 | 0·42 | 0·45 | 0·47 | 0·49 | 0·50 |
| −12·50 | 0·16 | 0·29 | 0·37 | 0·43 | 0·47 | 0·51 | 0·54 | 0·56 | 0·58 | 0·60 |
| −10·00 | 0·20 | 0·36 | 0·46 | 0·54 | 0·59 | 0·64 | 0·67 | 0·70 | 0·73 | 0·75 |
| −7·50 | 0·26 | 0·48 | 0·61 | 0·72 | 0·79 | 0·85 | 0·90 | 0·94 | 0·97 | 0·75 |
| −5·00 | 0·39 | 0·72 | 0·93 | 1·08 | 1·18 | 1·27 | 1·34 | 1·40 | 1·46 | 1·51 |
| −3·00 | 0·65 | 1·20 | 1·54 | 1·78 | 1·97 | 2·12 | 2·24 | 2·35 | 2·43 | 2·51 |
| −2·00 | 0·97 | 1·79 | 2·32 | 2·68 | 2·95 | 3·18 | 3·37 | 3·52 | 3·65 | 3·79 |
| −1·00 | 1·94 | 3·58 | 4·65 | 5·36 | 5·92 | 6·34 | 6·74 | 7·03 | 7·30 | 7·57 |
| −0·75 | 2·59 | 4·79 | 6·20 | 7·17 | 7·90 | 8·46 | 8·95 | 9·39 | 9·76 | 10·03 |
| −0·50 | 3·89 | 7·21 | 9·28 | 10·73 | 11·77 | 12·72 | 13·49 | 14·05 | 14·60 | 15·10 |
| −0·25 | 7·72 | 14·41 | 18·59 | 21·45 | 23·54 | 25·44 | 26·97 | 28·10 | 29·21 | 30·10 |
| 0·00 | Infinity | Infinity | Infinity | Infinity | Infinity | Infinity | Infinity | Infinity | Infinity | Infinity |
| 0·25 | 7·78 | 14·32 | 18·53 | 21·47 | 23·61 | 25·44 | 26·95 | 28·10 | 29·21 | 30·29 |
| 0·50 | 3·86 | 7·21 | 9·21 | 10·73 | 11·80 | 12·72 | 13·48 | 14·05 | 14·60 | 15·15 |
| 0·75 | 2·59 | 4·76 | 6·20 | 7·15 | 7·87 | 8·46 | 8·98 | 9·39 | 9·78 | 10·10 |
| 1·00 | 1·95 | 3·58 | 4·65 | 5·37 | 5·90 | 6·34 | 6·74 | 7·03 | 7·30 | 7·57 |
| 2·00 | 0·97 | 1·80 | 2·32 | 2·68 | 2·97 | 3·18 | 3·37 | 3·51 | 3·65 | 3·76 |
| 3·00 | 0·65 | 1·20 | 1·54 | 1·79 | 1·98 | 2·12 | 2·24 | 2·35 | 2·43 | 2·51 |
| 5·00 | 0·39 | 0·72 | 0·93 | 1·07 | 1·18 | 1·27 | 1·35 | 1·41 | 1·46 | 1·51 |
| 7·50 | 0·26 | 0·48 | 0·62 | 0·72 | 0·79 | 0·85 | 0·90 | 0·94 | 0·97 | 1·01 |
| 10·00 | 0·20 | 0·36 | 0·46 | 0·54 | 0·59 | 0·64 | 0·67 | 0·70 | 0·73 | 0·75 |
| 12·50 | 0·16 | 0·29 | 0·37 | 0·43 | 0·47 | 0·51 | 0·54 | 0·56 | 0·58 | 0·60 |
| 15·00 | 0·13 | 0·24 | 0·31 | 0·36 | 0·40 | 0·42 | 0·45 | 0·47 | 0·49 | 0·50 |
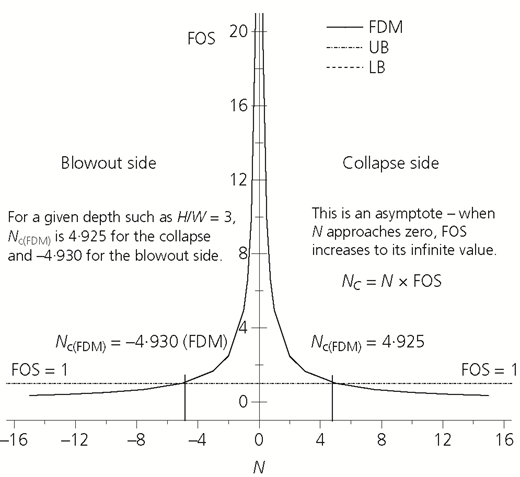
When the supporting pressure ratio (SPR, σt/Su) is greater than the overburden pressure ratio (OPR ((σs + γH)/Su)), the negative value of N represents a blowout movement. Contrary to this, a positive value of N indicates that the soil moves in the collapse condition. This occurs when the overburden pressure ratio ((σs + γH)/Su)) is greater than the supporting pressure ratio (σt/Su). As N further increases, an incipient collapse is reached where FOS = 1 and the corresponding N is the critical Nc. When the supporting pressure ratio (σt/Su) is equal to the overburden pressure ratio ((σs + γH)/Su)), N is equal to zero and FOS is at a maximum (infinite) where a ‘stressless’ scenario exists on the asymptote line.
Broms and Bennermark’s original Equation 1 can be rearranged into a form that is more amenable to analysis, as shown in the following equation
Using Equation 5, a critical supporting pressure σt (when FOS = 1) can be determined as long as Nc is known. Note that there is only one unique Nc (±) for a particular depth ratio and Nc is a function of the depth ratio H/W regardless of the undrained shear strength of the soil. It is therefore important to study the effect of H/W on the critical stability number Nc. Figure 5 shows such a relationship between Nc and H/W. Note that the critical stability number (Nc) increases non-linearly as H/W increases, and the gradient of the curve decreases for large values of Nc. The area bounded by the collapse and the blowout curves represents the safe zone where FOS > 1. As the stability number (N) approaches zero (OPR = SPR), the FOS becomes infinite. Also, see the asymptote in Figure 4.
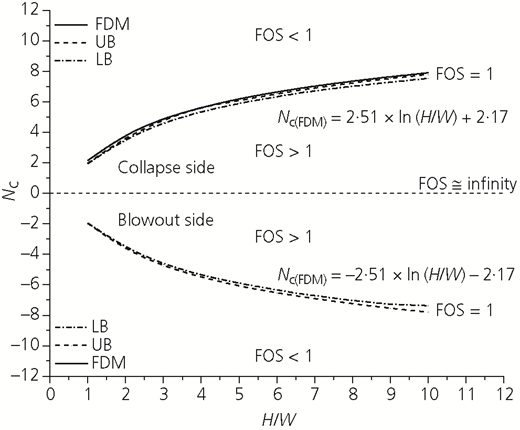
Note that the critical stability number (Nc) represents the ‘design’ N value when FOS = 1. This is the failure envelope for FOS = 1. Also, note that FOS ˃ 1 when a design N value is located within the failure envelope and FOS < 1 when a design N value is located outside the failure envelope.
The finite-difference results of Nc were chosen for the regression analysis. These are presented in Equations 6 and 7 for collapse and blowout, respectively, with a correlation coefficient r2 = 0·998.
Using Equations 1 and 4, the FOS can be determined with the following equation
Substituting Equations 6 and 7 into Equation 8, Equation 9 can be used to determine the FOS for known design parameters (σs, σt, γ, H, W and Su).
Equation 9 is also presented graphically in Figure 6. The design contour map of FOS was constructed based on the FDM numerical solutions.
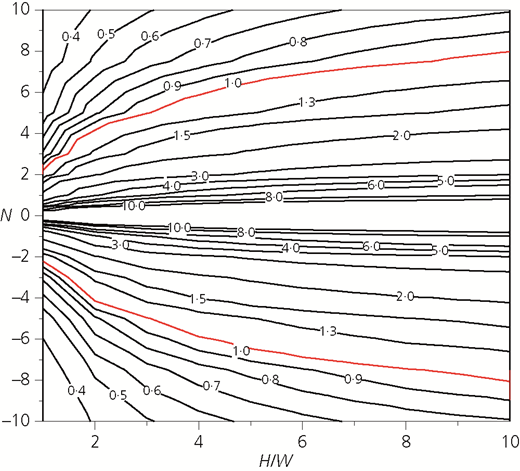
By rearranging Equation 8, one can determine the required support pressure σt for a given FOS using the following equation
Comparison
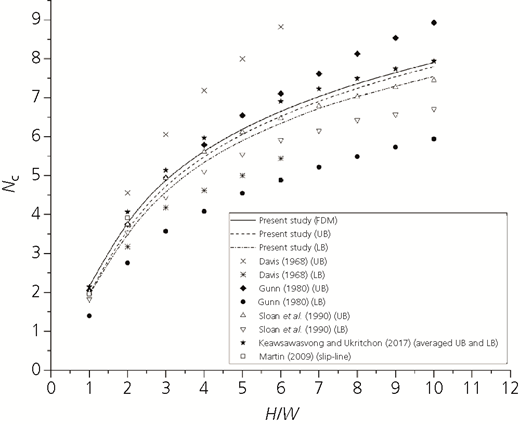
Figure 7 and Table 4 compare the N c values obtained in this paper with those in the published literature. The comparison shows that the FDM results of N c are considerably lower than the analytical upper-bound solutions of Davis (1968) for large H/W. Although Davis’s investigation had been improved by Gunn (1980) by using the three rigid block parameters, the analytical upper-bound solutions of Gunn (1980) are still 4·0–12·9% larger than the current FDM.
Comparison of N c values
| H/W | Present study | Davis (1968) | Gunn (1980) | Sloan et al. (1990) | Keawsawasvong and Ukritchon (2017) | Martin (2009) | |||||
|---|---|---|---|---|---|---|---|---|---|---|---|
| FDM | LB | UB | LB | UB | LB | UB | LB | UB | Average (LB and UB) | Slip-line | |
| 1 | 2·16 | 1·94 | 1·98 | 2·00 | 2·00 | 1·40 | 2·05 | 1·83 | 2·00 | 2·14 | 1·96 |
| 2 | 3·90 | 3·59 | 3·71 | 3·17 | 4·56 | 2·76 | 3·75 | 3·54 | 3·75 | 4·07 | 3·91 |
| 3 | 4·93 | 4·63 | 4·78 | 4·18 | 6·06 | 3·57 | 4·94 | 4·45 | 4·93 | 5·14 | — |
| 4 | 5·65 | 5·37 | 5·51 | 4·62 | 7·19 | 4·08 | 5·79 | 5·11 | 5·61 | 5·97 | — |
| 5 | 6·21 | 5·92 | 6·08 | 5·00 | 8·00 | 4·55 | 6·55 | 5·55 | 6·12 | 6·54 | — |
| 6 | 6·66 | 6·35 | 6·53 | 5·44 | 8·82 | 4·88 | 7·11 | 5·92 | 6·47 | 6·90 | — |
| 7 | 7·04 | 6·74 | 6·92 | — | — | 5·22 | 7·62 | 6·16 | 6·78 | 7·23 | — |
| 8 | 7·37 | 7·03 | 7·25 | — | — | 5·49 | 8·13 | 6·43 | 7·02 | 7·50 | — |
| 9 | 7·65 | 7·30 | 7·55 | — | — | 5·73 | 8·54 | 6·57 | 7·27 | 7·74 | — |
| 10 | 7·91 | 7·55 | 7·80 | — | — | 5·94 | 8·93 | 6·72 | 7·44 | 7·94 | — |
The comparison in Figure 7 also shows some 0·65–15·00% difference between the FDM results and the results by Sloan et al. (1990) for the range of depth ratios (H/W = 1–10) studied. Although Sloan et al. (1990) carried out extensive research on trapdoor stability, the use of linear programming was a major drawback on the solution accuracy. In particular, the lower bound shows a large variation in comparison with FDM. The slip-line solutions of Martin (2009) were limited to shallow depth ratios up to H/W = 2. Martin’s results agree well with the current FDM solutions of H/W = 1 and 2. Keawsawasvong and Ukritchon (2017) presented averaged upper- and lower-bound solutions for a wide range of depth ratios (H/W) for homogeneous and non-homogeneous clays. In general, their results of homogeneous clay agree well with the FDM results. Overall, the predicted trend of FDM results shows a good agreement with the FELA LB and UB solutions.
Failure extent
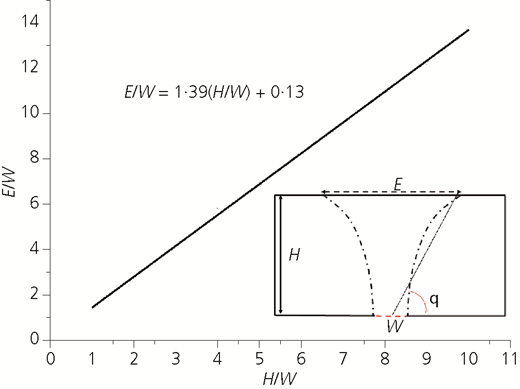
Results of the failure extent investigation are shown in Figure 8. The distance of failure extent was determined by inspection of the velocity vector plots produced in the program. Figure 8 suggests that the failure extent ratio (E/W) is linearly proportional to the depth ratio (H/W). The linear relationship is presented in the following equation
A practical conclusion can be drawn from Table 5, showing that an approximately 55° line can be drawn from the centre of the trapdoor to the outer boundary of the failure surface to estimate the failure extent. Note that this investigation is valid for all values of stability numbers (N).
Determination of failure extent
| Depth ratio, H/W | Actual depth, H: m | Measured surface half-failure extent, E/2: m | Angle, θ = tan−1[H/(E/2)]: ° | Ratio of failure extent to trapdoor width, E/W |
|---|---|---|---|---|
| 1 | 6 | 4·50 | 53·1 | 1·50 |
| 2 | 12 | 8·50 | 54·7 | 2·83 |
| 3 | 18 | 12·5 | 55·2 | 4·17 |
| 4 | 24 | 17·5 | 53·9 | 5·83 |
| 5 | 30 | 20·5 | 55·7 | 6·83 |
| 6 | 36 | 25·5 | 54·7 | 8·50 |
| 7 | 42 | 30·5 | 54·0 | 10·17 |
| 8 | 48 | 35·0 | 53·9 | 11·67 |
| 9 | 54 | 36·5 | 55·9 | 12·17 |
| 10 | 60 | 41·5 | 55·3 | 13·83 |
Half-cavity size (W/2) = 3 m
Work examples
Determine the FOS
An old vertical mining shaft has no internal pressure and no surcharge pressure. For the given parameters (Su = 154 kPa, γ = 18 kN/m3, H = 36 m and W = 6 m), determine the FOS.
Since there is no internal pressure, only the collapse failure should be considered.
The stability number is N = γH/Su = 4·21.
Using H/W = 6 and N = 4·21, Equation 9 gives an FOS of 1·58 for the collapse.
Using H/W = 6 and N = 4·21, Figure 6 gives an approximate FOS of 1·6.
An actual computer analysis of this case gives an FOS of 1·63.
What is the critical support pressure σt when FOS = 1?
Using Equation 6, Nc = 3·45 for collapse.
From Equation 10, σt = σs + γH − (Nc × Su/FOS) = 100 + (18 × 10) − (3·45 × 30/1) = 176·5 kPa.
Estimate the depth of a sinkhole (H)
An existing sinkhole has a diameter of 10 m. Estimate the depth of the sinkhole using the following parameters for cohesive soil: Su = 54 kPa and γ = 19 kN/m3.
Note that Equation 11 is independent of the design parameter N. The only needed information is E.
From Equation 11, 10/W = 1·39 × (H/W) + 0·13.
By ignoring the small value of (0·13W), the depth (H) is found to be 7·19 m.
Design of a supported cavity (σt)
An FOS of 4 is required for the design of an underground military bunker where the surcharge pressure is given as σs = 50 kPa. The following parameters are known: Su = 25 kPa, γ = 18 kN/m3, H = 40 m and W = 30 m.
Using Equation 6, the critical stability number is Nc = 2·89. Note that Figure 5 can also be used to find the Nc value.
Substitute the Nc value into Equation 10, σt = σs + γH − (Nc × Su/FOS) = 50 + (18 × 40) − (2·9 × 25/4) = 752 kPa.
The required pressure to support the cavity for an FOS of 4 is 752 kPa.
Conclusion
This study successfully investigated the stability of trapdoor problems using Broms and Bennermark’s original stability number. Numerical results of this study were obtained by utilising the SSRM. Three numerical techniques were used – namely, the FDM, FELA UB and FELA LB.
The FOS was found to be a function of the depth ratio (H/W) and stability number (N). The numerical results suggest that the FOS increases when the stability number (N) decreases. The FOS becomes very large when the stability N is very small. Further investigation on failure mechanisms indicates a linear relationship between the failure extent ratio (E/W) and the depth ratio (H/W). The failure angle (θ) measured from the centre of the opening (W) to the outer boundary of the failure surface is approximately equal to 55° for all depth ratios (H/W).
This investigation has improved the understanding of trapdoor stability and associated surface failure extent. Further study is needed for a more realistic three-dimensional analysis of sinkhole failure.

