


Ordinary and reinforced granular columns were both tested in a laboratory to study the effect of internal reinforcement using plastic fibres that were generated through the recycling of post-consumer polyethylene terephthalate bottles. A series of vertical compression tests was undertaken to understand the impact of varying the moisture content of the silt bed and the fibre concentration. The prepared samples were vertically loaded up to a maximum compression of 50 mm, and the load–vertical deformation characteristics were electronically recorded. Post-testing, the deformation behaviour of the column was physically modelled using a paste of plaster of Paris to obtain the maximum bulging diameter. In general, reinforcing the granular columns enhanced the load-carrying capacity, although the degree of improvement was dependent on the testing conditions. For experiments conducted on the softer silt beds, an increase in fibre content resulted in higher loading strengths. The largest enhancement was recorded in the test with wetter silt and with a fibre concentration of 0.1%. This was equivalent to 3.5 times that which was recorded when an ordinary granular column was installed. In terms of lateral deformation, the smallest bulge was obtained in the test with the wetter silt and a fibre content of 0.025%.
Notation
Introduction
Soils with weak geotechnical engineering properties were previously categorised as economically and technically unfeasible for development. While previously engineers had to either replace the in situ soil or abandon the proposed site for construction, today the numerous available ground improvement techniques have assisted engineers in enhancing the existing soil properties to accommodate the desired use (Sobhee-Beetul, 2019). Out of the many technologies, the granular column method is a very old approach used to improve the engineering characteristics of certain grounds (Arman et al., 2009; Hughes and Withers, 1974). Al-Obaidy (2017) in fact reported the use of these columns in Iraq as early as the second or third century BCE. Granular columns are rather popular for their cost-effectiveness, versatility and environmental friendliness (Etezad et al., 2015; Isaac and Madhavan, 2009; Madun et al., 2018; McKelvey et al., 2004; Sobhee-Beetul, 2012). Zukri and Nazir (2018) further claimed that the resulting treated ground is possibly the most natural and ecologically neutral foundation system that engineers can generate. They additionally explained that the materials used for the columns typically exist in nature, although a relatively low amount of energy is sometimes necessary to source the required material. This conclusion was drawn based on the comparison made with other methods of ground improvement, as well as with structural solutions such as bored cast-in-situ piling (Chawla et al., 2010).
Granular columns are essentially formed by creating an opening in the ground, which is subsequently filled with a compacted granular material that is generally sand or stone. The columns are primarily used for improving the bearing capacity, reducing settlement, enhancing drainage and mitigating liquefaction in soft soils. Their inclusion densifies the ground while also allowing the quick dissipation of generated excess pore pressures. Additionally, the shear strength of the ground increases due to the presence of the strong and stiff elements. When installed, the coarse particles of the columns are not bound to form a single element, and thus the strength of a typical column is primarily derived from the confining stresses generated by the surrounding soil onto it (Barksdale and Bachus, 1983a, 1983b; Greenwood, 1970). Therefore, it is rather evident that the columns will have significantly low load-carrying capacities in soft soils due to the low lateral confinement. As such, the column may undergo excessive bulging, particularly in the upper section (Shivashankar et al., 2011). Since bulging has been reported as one of the different modes of failure in granular columns under compressive loadings (Ambily and Gandhi, 2007), it is desirable to minimise the lateral deformation. Several researchers have thus proposed and successfully demonstrated reinforcement of the columns to reduce bulging; the reinforced columns are also able to carry higher loads owing to the increase in their stiffness and strength (Al-Refeai, 1992; Ayadat et al., 2008; Rao and Nayak, 1995; Sharma et al., 2004; Sobhee-Beetul, 2019; Wu and Hong, 2008).
To reinforce the columns, different materials and approaches have been adopted in both experimental and analytical studies such that the placement of the reinforcement may be either internal or external (Afshar and Ghazavi, 2014; Ali, 2014; Malarvizhi and Ilamparuthi, 2004; Murugesan and Rajagopal, 2008; Rao et al., 1992; Tallapragada et al., 2011; Tandel et al., 2014). The most common types of materials used in these research works included poly(vinyl chloride) tubes, perforated metal discs, wire meshes (made of plastic, steel and aluminium materials) and geosynthetics such as geotextiles.
External reinforcement basically involves encasing the column by means of a relatively large and strong material. However, when the columns are internally reinforced, it is more of a soil reinforcement scenario whereby different types and sizes of materials may be incorporated into the column to form a composite. Soil reinforcement is an area in which intensive research work has been undertaken thus far (Chebet and Kalumba, 2014; Das et al., 2017; Dave and Thaker, 2017; Dutta and Sarda, 2007; Laskar and Pal, 2013; Vidal, 1966; Zornberg et al., 2004). As such, the existing knowledge provides sufficient details to understand how different materials generally behave when used for reinforcing. Fibres were identified as one of the materials used in previous soil reinforcement research works; the fibres were either of natural or synthetic origin (Purushothama Raj, 2005). Irrespective of their nature, fibres have regularly demonstrated good performance in improving the geotechnical properties of soils (Al-Adili et al., 2012; Consoli et al., 2002; Marandi et al., 2008). Hence, it was proposed that granular columns be reinforced with fibres in this study. Synthetic fibres were selected since they were locally sourced from recycled polyethylene terephthalate (rPET) bottles. A material obtained from waste was preferred to generate a technology whereby solid waste can be recycled and used in the construction industry while potentially contributing to the reduction of waste destined for landfills. Moreover, several studies have been undertaken in the past that indicate the efficacy of using waste materials for reinforcing soils (Benson and Khire, 1993; Bhattarai et al., 2013; Edil and Bosscher, 1994; Sobhee-Beetul and Kalumba, 2011).
The aim of the study was to investigate the effect of reinforcing granular columns with rPET fibres on the following: load–vertical deformation behaviour of the improved base silt and lateral deformation characteristics of each tested column. It was hypothesised that reinforcing the columns would improve their loading strength while also reducing their deformation laterally. A laboratory experimental programme was drawn up whereby each test involved a single granular column installed in a cylindrical steel tank. The subsequent sections present the methodology, results, analysis and conclusions, which were extracted from the thesis by Sobhee-Beetul (2019). Although granular columns derive their strength principally from the surrounding confining stresses, other factors such as column length, column diameter and type of column material also have a significant impact on the performance of the columns. However, in this study, the investigation was limited to the column material, which was a composite of varying sand–fibre ratios. Columns extending to the base of the testing tank were installed to represent similar ones reaching the firm stratum in field scenarios.
Experimental investigation
Overview
In this research, single columns were installed in beds of silt; each column was reinforced with rPET fibres, except for the control experiments. The test sample was then subjected to a vertical compressive load, and the load–vertical deformation characteristics of each test were captured. The aim was to understand the effect of varying the fibre concentration on the loading response when columns were installed in silt beds at two different moisture contents – namely, optimum moisture content (OMC) and liquid limit (LL). After each test, the deformation of the column was physically modelled to locate the maximum lateral bulging and its corresponding position along the column.
Test set-up
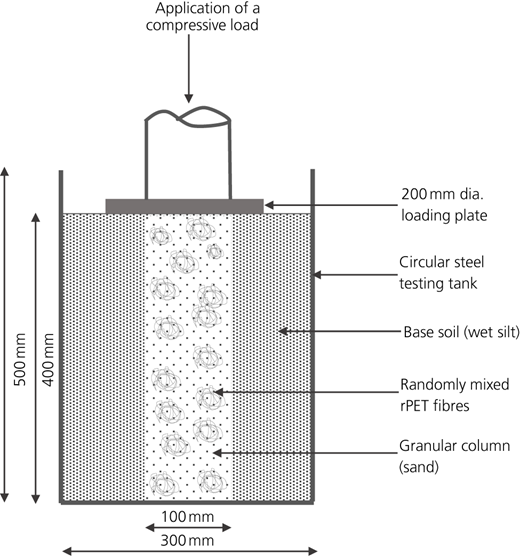
From an analysis of several previous studies, it was noted that laboratory tests were generally conducted in fabricated tanks that were mostly circular with diameters ranging between 100 and 835 mm, while the heights varied between 200 and 720 mm. With regard to the columns, it appeared that a diameter of 100 mm was commonly used in previous tests, while the heights typically ranged between 150 and 540 mm (Afshar and Ghazavi, 2014; Ali, 2014; Al-Waily, 2012; Ambily and Gandhi, 2007; Ayadat et al., 2008; Isaac and Madhavan, 2009; McKelvey et al., 2004; Murugesan and Rajagopal, 2008). Therefore, in this investigation, the diameter and length of each test column were kept constant at 100 and 400 mm, respectively. The specific dimensions were selected based on findings from the aforementioned research, while also considering the explanation presented by Mitra and Chattopadhyay (1999) to obtain the required size of the tank. According to the latter, the length-to-diameter ratio of the column must be approximately 4.5 to allow for full limiting axial stress to be developed on the column; Hughes and Withers (1974) stated that this ratio can be as low as 4. Based on the selected column dimensions, the length-to-diameter ratio in this study was 4. Since the tank dimensions were dependent on those of each column, the diameter and height of the testing tank were preferred to be 300 and 500 mm, respectively, to create rather similar conditions as in previous research works and to allow for workable conditions. These proportions were considered adequate based on the recommendation by Greenwood (1970) of a column spacing-to-diameter ratio of between 2.5 and 4. The selected column and testing tank sizes resulted in a ratio of 3 in this study, assuming that the smallest column spacing may only be 300 mm should another testing tank with a column be placed immediately next to this tank. A typical test set-up is shown in Figure 1. Each sample was vertically loaded through a 25 mm thick loading plate of 200 mm diameter.
Properties of materials
Three main materials were utilised in this study – namely, clayey silt, sand and rPET fibres; they are subsequently described. All characterisation and properties tests conducted on the silt and sand were according to the respective following British standards: BS 1377-2:1990 (BSI, 1990a), BS 1377-4:1990 (BSI, 1990b) and BS 1377-7:1990 (BSI, 1990c).
Clayey silt (referred to as silt hereafter) was used as the base material. A fine yellow soil, with a natural moisture content of 16.8%, was chosen from a local quarry to represent the weak base soil that needed improvement to sustain heavier loads. The material was selected based on availability and accessibility. From the results obtained through a wet sieve analysis, a hydrometer test and Atterberg’s limit tests, the material was classified as a low-plasticity silt with an LL and a plasticity index of 37 and 6.4%, respectively. The particle size distribution of the silt is presented in Figure 2. Unconsolidated undrained triaxial tests were carried out to obtain the shear strength properties of the silt at OMC and at LL. The results from these tests showed that the corresponding friction angle and the cohesion were 15.2° and 3.98 kN/m2 at OMC, respectively, while at LL, the respective values were 0° and 6.42 kN/m2. The other properties of the silt were specific gravity of 2.71, OMC of 17.7% and maximum dry density of 1.7 Mg/m3.
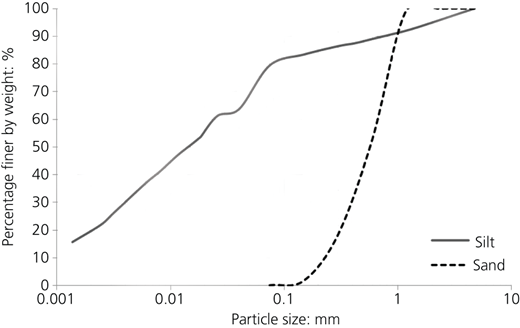
Particle size distribution of the base material (silt) and the column material (sand)
Particle size distribution of the base material (silt) and the column material (sand)
Sand was used as the granular column material. The light grey sand was sourced locally due to the high availability and the rather minimal cost, which was an important factor in the design of this technology. A dry sieve analysis on a sand sample revealed the following: 98.9% of the sand was smaller than 1.18 mm; the respective values for D 10, D 30 and D 60 were 0.24, 0.40 and 0.68 mm. The particle size distribution of the sand is shown in Figure 2.
Brown (1977) established a system whereby the suitability of a backfill material for vibro-replacement columns was confirmed through a rating system, which required a suitability number (S N); this system was developed based on Brown’s project experience and the settling rate of soil particles. The suitability number, which is calculated using Equation 1, is dependent on the D 10, D 20 and D 50 values.
Specific ranges of the suitability number corresponded to different ratings – namely, excellent (0–10), good (10–20), fair (20–30), poor (30–40) and unsuitable (>50). In accordance with this rating system, the sand selected for this study had a suitability number of 10.2 and was considered a ‘good’ backfill material for the column. Direct shear tests were conducted on the dry sand samples, and the results generated a friction angle of 36° and cohesion of 5 kN/m2. Other properties obtained through laboratory tests were as follows: specific gravity of 2.70 Mg/m3, OMC of 12.5% and maximum dry density of 1.796 Mg/m3.
White rPET fibres were utilised as a reinforcement material to improve further the strength of the granular column. The fibres were a product of the recycling process of polyethylene terephthalate (PET) bottles in South Africa. These fibres are typically used to manufacture many products, including non-woven geotextiles, which are a product commonly used in the geotechnical engineering industry. From an environmental point of view, the fibres were preferred since they would require less energy to be utilised in manufacturing and evidently keep the cost of the reinforcement lower (Sobhee-Beetul, 2019). For this research, the remarkably light fibres, which resembled candyfloss, were white in colour, and they were sourced from a local geotextile manufacturing company. The manufacturer reported the properties of these rPET fibre with a round cross-section as follows: density of 1.38 g/cm3, melting point of 254°C, fibre fineness varying between 4.8 and 5.2, fibre length between 97 and 103 mm, fibre tenacity at break of more than 30 cN/Tex, fibre tenacity at 10% elongation ranging between 12 and 25 cN/Tex, elongation at break of more than 35% and crimp between 2.8 and 3.2 c/cm. Under microscopic view, the average diameter of the fibres was found to be 24.6 μm. Three different concentrations (0.025, 0.05 and 0.1%) of fibres were preferred for the investigation. The selection of the fibre contents was based on previous studies related to the use of different types of plastic for reinforcing soils (Benson and Khire, 1993; Choudhary et al., 2010; Dutta and Sarda, 2007; Sobhee-Beetul and Kalumba, 2011). Since most of the studies used a plastic concentration of less than 1%, similar percentages were initially chosen. However, through a few trials of sample preparation, the use of fibres at 1% was not practical since the volume that the fibres occupied was large, although they were lightweight. The large volumes of the fibres interfered with the random mixing process. Hence, smaller fibre contents were opted for since they were easy to work with. Figure 3 presents the fibre that was used for reinforcing the granular columns.
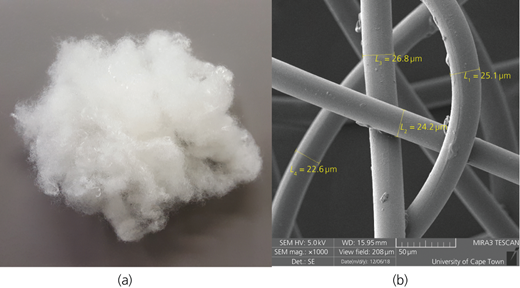
rPET fibre used for reinforcing the granular columns: (a) photographic representation; (b) microscopic view (sourced from the Electron Microscope Unit at the University of Cape Town)
rPET fibre used for reinforcing the granular columns: (a) photographic representation; (b) microscopic view (sourced from the Electron Microscope Unit at the University of Cape Town)
Preparation of test samples
The initial stage involved the preparation of the materials required. Both the silts and the sands were inspected for the presence of any foreign elements such as stones, leaves or roots. The materials contained practically none of these since they were sourced in a clean condition from the quarry. After the screening process, they were oven-dried at 105°C for 24 h. Thereafter, both materials were allowed to cool down in a closed oven room. Once cooled, the silt was sieved through a 4.25 mm sieve and each material was stored in large, sealed plastic containers. To understand better the behaviour of the columns under extreme wet and dry conditions, the base material was prepared at two different moisture contents (OMC and LL) such that two series of tests were generated. These degrees of wetness were adopted based on the studies by McKelvey et al. (2004), Ambily and Gandhi (2007) and Sobhee-Beetul and Kalumba (2015). With regard to the reinforcement material, it tends to form an entangled mass that is also compressed under its own weight when stored. Hence, the sample for each test was prepared just before being used.
Dry silt was mixed with water in a mechanical mixer to obtain a wet mass of desired water content. The process was repeated until enough sample was obtained to set up a test specimen. The wet silt was stored in an airtight container for 24 h, to allow for homogeneous permeation of water through the prepared material. After 1 day, the inner surface of the cylindrical steel tank was smeared with a thin coating of thick motor oil. The tank, which was fitted on a trolley, was filled to a height of 400 mm with uniformly compacted silt. Filling was done in layers of 50 mm such that the required density of the base material was achieved. When preparing the base soils mixed at OMC, each layer was compacted by dropping a weight of 2.5 kg 15 times through a height of 180 mm. For silt beds made at LL, compaction was not necessary since the rapid dropping of weight on the saturated soil would have resulted in high interparticle forces, which would have prevented further compaction. Therefore, the wet silt was manually compressed in small batches to expel maximum air pockets present within the sample so as to obtain a rather homogeneous bed.
The column installation technique adopted was primarily derived from the studies by Ambily and Gandhi (2007) and Sobhee-Beetul and Kalumba (2015) such that all columns in this study were installed by a replacement method. To form ordinary granular columns (OGCs), a hollow steel pipe with an external diameter of 100 mm and a sharp end was lightly oiled and pushed down centrally in the silt tank. The inner diameter of 98 mm of the thin pipe was specifically chosen so as to minimise disturbance to the surrounding soil. Using a helical auger, the silt within the pipe was cut out in stages; the inner surface was then cleaned before pouring in the sand in compacted layers of 50 mm. After each layer, the pipe was retracted to allow for the column to be compacted into the silt. Each sand layer was compacted by dropping a 2.3 kg weight 12 times through a height of 180 mm. The process was repeated until eight layers were attained, and an additional small mass was poured to level the column with the surrounding silt.
For reinforced granular columns (RGCs), the concentration of fibre (as a percentage of the mass of sand per column layer) to be used per layer was measured, and the mass of fibres was pulled apart manually to obtain loose and small 2 g lumps of fibres that were not compressed. Owing to the fineness and intertwined nature of the fibres, it was not feasible to separate them into individual lengths. Hence, they were randomly mixed into the premeasured mass of sand in the form of small, loosened lumps for the respective test. The loosening step was necessary to allow for better interlocking of the sand particles around the fibres. Thereafter, it was poured into the pipe similarly to the procedure followed for the formation of OGCs. In general, the top layer in both OGCs and RGCs was not compacted since it resulted in excessive bulging of the column prior to testing.
Experimental procedure
Once a test specimen was prepared, it was subjected to a compression load through an electronic loading machine, the Zwick universal testing machine. A displacement-controlled load was applied through a 200 mm dia. loading plate at a rate of 1.2 mm/min, to allow for undrained conditions (Murugesan and Rajagopal, 2008; Sobhee-Beetul, 2012), up to a vertical compression of 50 mm. The maximum allowable compression was based on Eurocode 7, which suggests similar values for settlement of normal structures (BSI, 2004).
On completion of the experiment, the testing tank was unloaded from the machine to prepare for the physical modelling of the deformation of the column. This was achieved by emptying the column material carefully using a vacuum cleaner at the lowest speed. For tests at OMC, an insignificant amount of sand particles was trapped on the silt surface of the opening. However, for LL tests, the stuck sand particles were more visible due to the abundance of water in the silt. To ensure that an accurate representation of the column deformation was obtained, the sand particles on the silt surface were lightly cleaned using a soft nylon brush without disturbing the shape carved into the base. Subsequently, a flowing mixture of plaster of Paris and sand was prepared and immediately poured into the opening. The process of vacuuming and casting was done rapidly so as to avoid any potential collapse of the inner surface of the silt once the column material was vacuumed out. After a curing time of 2 h, the surrounding wet silt was manually removed, and the modelled column was obtained. Visual observations and measurements were made from the model to understand the column behaviour in each test. More specifically, the maximum bulging diameter and the position at which it occurred for each column were recorded using a measuring tape. Significant irregularities were also recorded. This experimental procedure was followed for all experiments, irrespective of the moisture content of the base silt. Throughout the investigation, a high-quality control plan was followed to ensure the repeatability of results. More information may be obtained from the thesis of Sobhee-Beetul (2019): repeatability tests were undertaken, regarding both the load–vertical deformation behaviour of the improved base silt and the deformation characteristics of the columns, to ensure the reliability of the testing procedure being followed. The repeatability relative standard deviation (RSDr) was less than 5%, which was considered acceptable for this research.
Test programme and data
The testing programme involved a total of ten experiments. Out of these, four were control tests: two on unimproved base soil and two on base soil improved with OGC. The latter were conducted for base soils at both OMC and LL. These were necessary to understand and compare the changes that were obtained as a result of the varying characteristics of each test. M1 and M2 were base soils at OMC and LL, respectively. Details of all the tests undertaken are presented in Table 1. In the test code, ‘S’ represents the presence of a sand column; ‘RF’ indicates that random fibres were used to reinforce the columns; and the percentage indicates the content per unit weight of the fibre. The following were the main output from each experiment: maximum vertical applied stress at a vertical compression of 50 mm; maximum bulging diameter (D B) of the column and the position where it occurred along the column; and the length span (L B) over which the maximum bulging diameter was present. While the detailed results for each of them are presented in the section headed ‘Analysis of results’, a summary of these data is provided in Tables 1 and 2. The average position of the maximum bulging diameter in Table 2 was measured from the base of the column.
Maximum vertical applied stress at the end of each test (vertical compression of 50 mm)
| Moisture content | Test specimen | Test code | Mass of sand: g | Mass of reinforcement: g | Maximum vertical applied stress: kPa |
|---|---|---|---|---|---|
| OMC | Silt | M1 | — | — | 203 |
| Silt–sand | M1-S | 6756 | 0 | 413 | |
| Silt–sand–fibre | M1-S-RF0.025% | 6300 | 1.61 | 465 | |
| M1-S-RF0.05% | 6035 | 3.05 | 453 | ||
| M1-S-RF0.1% | 6266 | 6 | 429 | ||
| LL | Silt | M2 | — | — | 30 |
| Silt–sand | M2-S | 7453 | 0 | 52 | |
| Silt–sand–fibre | M2-S-RF0.025% | 7605 | 1.9 | 59 | |
| M2-S-RF0.05% | 7428 | 3.7 | 80 | ||
| M2-S-RF0.1% | 7361 | 7.4 | 104 |
Summary of the deformation characteristics of each column (vertical compression of 50 mm)
| Moisture content | Test specimen | Test code | D B: mm | Position of D B: mm | L B: mm |
|---|---|---|---|---|---|
| OMC | Silt | M1 | — | — | — |
| Silt–sand | M1-S | 128 | 235–275 | 40 | |
| Silt–sand–fibre | M1-S-RF0.025% | 130 | 240–275 | 35 | |
| M1-S-RF0.05% | 128 | 248–273 | 25 | ||
| M1-S-RF0.1% | 126 | 230–260 | 30 | ||
| LL | Silt | M2 | — | — | — |
| Silt–sand | M2-S | 150 | 250–300 | 50 | |
| Silt–sand–fibre | M2-S-RF0.025% | 140 | 295–305 | 10 | |
| M2-S-RF0.05% | 148 | 295–305 | 10 | ||
| M2-S-RF0.1% | 144 | 300–310 | 10 |
Analysis of results
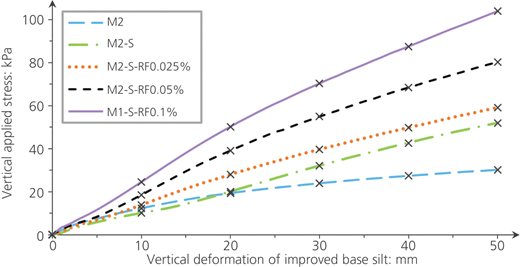
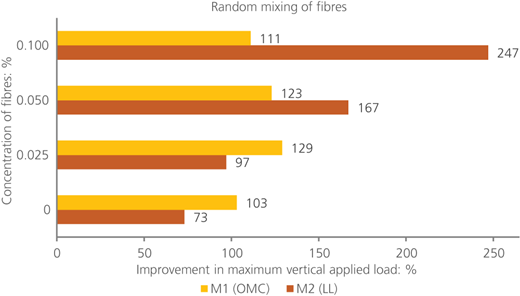
The results obtained for each experiment were analysed and are presented in terms of the load–vertical deformation of the improved base silt, the percentage reduction in the vertical deformation of the improved base silt and the column deformation characteristics. These are shown in Figures 4–8. The results of tests conducted on base soils at OMC and LL are presented independently to allow for a better comparison of the effects of varying the concentration of the reinforcement in the column while maintaining similar testing conditions. For example, in Figure 4, the only variable was the reinforcement concentration. All figures include the results of the control tests to understand the difference in the behaviour attained in the respective experiments.
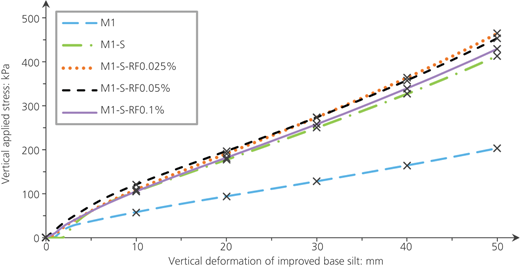
Load–vertical deformation characteristics for tests conducted on silts at OMC
Load–vertical deformation characteristics for tests conducted on silts at OMC
Percentage reduction in vertical deformation of improved base silt for each experiment
Percentage reduction in vertical deformation of improved base silt for each experiment
Lateral deformation characteristics of columns tested in silts at OMC: (a) graphical representation; (b) pictorial representation
Lateral deformation characteristics of columns tested in silts at OMC: (a) graphical representation; (b) pictorial representation
Load–vertical deformation relationship
Figure 4 shows the load–vertical deformation relationships obtained in tests conducted on a sample with a silt bed at OMC; all tests were terminated at a vertical compression of 50 mm. The trends observed in the tests on silts at OMC were approximately linear, implying that the compression of the column was almost linear elastic. The slight deviation from being exactly linear may be explained by the initial compaction of the sand particles and the fibres since the topmost layer of the column was not compacted during installation. Compaction was omitted for the top layer since the regular dropping of the compactor caused the column material to move laterally into the surrounding soil. This continuous migration of the column mix into the silt hindered the complete formation of the column since there was continuously an empty space in the top layer of the latter. Repeated filling and compaction of this top opening resulted in a much larger diameter of the column within that portion. This column enlargement resulted in a bulged top surface of the silt. To avoid this irregularity, the top layer was preferred to be non-compacted. From the graphs, it is evident that the installation of a granular column generally improves the vertical stress that the silt bed can sustain. It was further noted that the inclusion of the fibres within the columns resulted in an additional increase in the final vertical applied stress, with the lowest fibre concentration of 0.025% sustaining the highest vertical stress of 465 kPa. This stress equated to more than twice that of an unimproved silt bed. It was also higher, by approximately 25%, than the vertical stress for the test with the OGC, which was recorded as 413 kPa.
In Figure 5, the load–vertical deformation relationships obtained in tests conducted on base soils at LL are presented. The trends observed for this series of experiments differed slightly from those in Figure 4 since they displayed some non-linearity when the columns were loaded. This can be explained by the soft nature of the surrounding wetter silt, which encouraged higher lateral deformation of the columns. As the particles of the sand and fibres were compacted under vertical loading, the latter possibly favoured some initial bulging of the column simultaneously. Under these testing conditions, it was evident that the inclusion of any granular column allowed the silt bed to support higher vertical loads. The observations were more profound in tests where fibres were used to reinforce the columns. In effect, it was distinctly noted that the vertical applied stress drastically increased as the fibre concentration was raised. The most significant improvement in the vertical applied stress was attained when a concentration of 0.1% fibre was utilised. This largest enhancement in loading strength was about 3.5 times that of the stress recorded when the OGC was installed.
Figure 6 provides the percentage improvement in vertical applied stress achieved in each test, which was determined in relation to that of an unimproved silt bed. For tests conducted at OMC, the highest improvement of 129% was obtained when the column was reinforced with a fibre concentration of 0.025%. This represents an additional increase of 26% in load-carrying strength when compared with an OGC. In tests undertaken at LL, the degree of enhancement in loading strength was more profound. It was generally noted that the sustained load increased with an augmentation in fibre content within the column. The largest improvement of 247% was attained at a fibre concentration of 0.1%. This is equivalent to 3.4 times that obtained for an OGC. Overall, it appeared that the inclusion of fibres in the column generally improved the loading performance of the column. This observation can be explained by the soil reinforcement theory of Vidal (1966), who explained that the interlocking of the soil particles around the reinforcement yields a form of pseudo-cohesion. On increasing the vertical applied load, frictional forces were generated along the soil–reinforcement interface, which resulted in tensile stresses within the fibres. Owing to the length and entangling nature of the fibres, slippage was minimised at the interface. Hence, the composite column material was able to sustain higher loads.
Reduction in the vertical deformation of the improved base silt
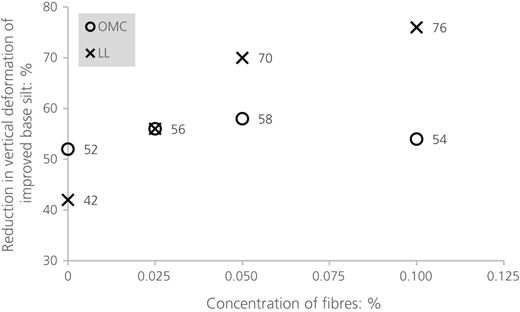
One of the main functions of using granular columns is to reduce the level of settlement in the ground. This reduction principally results from the higher stiffness of the column in comparison with that of the surrounding soil. From the load–vertical deformation data obtained during the laboratory experiments, the percentage reduction in vertical deformation of the improved base silt was calculated. In the control experiments – that is, tests M1 and M2 (unimproved base soils) – the respective maximum loading strength was noted at the highest vertical compression of 50 mm. The vertical compression corresponding to this loading strength was then recorded for each experiment. These vertical deformation values were then used to calculate the percentage reduction in each test. Table 3 summarises these percentages, and Figure 7 shows the trends obtained.
Percentage reduction in vertical deformation for each experiment
| Moisture content | Test code | Vertical deformation corresponding to maximum vertical stress for compression of 50 mm in the control experiments: mm | Reduction in vertical deformation compared to the control tests: % |
|---|---|---|---|
| OMC | M1 (control – max. stress of 203 kPa) | — | — |
| M1-S | 24 | 52 | |
| M1-S-RF0.025% | 22 | 56 | |
| M1-S-RF0.05% | 21 | 58 | |
| M1-S-RF0.1% | 23 | 54 | |
| LL | M2 (control – max. stress of 30 kPa)) | — | — |
| M2-S | 29 | 42 | |
| M2-S-RF0.025% | 22 | 56 | |
| M2-S-RF0.05% | 15 | 70 | |
| M2-S-RF0.1% | 12 | 76 |
In Figure 7, the trends observed in the reduction of vertical deformation with increase in fibre concentration are shown for tests conducted on base soils at both OMC and LL. From the figure, it is rather evident that any type of column inclusion in this study resulted in a reduction in the vertical compression of the base soil. For experiments undertaken on samples at OMC, the percentage reduction in vertical deformation differed negligibly with variation in the concentration of fibres. However, for samples tested at LL, vertical deformation significantly reduced with the presence of the fibres. In fact, the degree of compression of the composite ground decreased as the content of fibres was raised in the columns. The largest reduction in vertical deformation of 76% was recorded when the column was reinforced with the highest fibre concentration of 0.1%. This observation effectively confirms that rPET fibres are valuable materials for reinforcing granular columns. Reinforcing of the columns generally results in their enhanced stiffness, which consequently reduces the deformation of the ground when subjected to compressive loads. While granular columns derive their main strength from the surrounding soil, the strength of the columnar material is equally important. In this research, the use of the fibres had created a sand–reinforcement composite such that the sand particles were interlocked around the fibres, thus reducing the void ratio in the column. The formation of the denser column reduced its bulging, which in turn diminished vertical deformation. The distinct difference in the reduction of the vertical deformation for samples tested at OMC and LL was anticipated due to the soft nature of the wetter base soil. In general, this softness tends to encourage bulging of the columns; however, lateral deformation is restrained with the inclusion of a stiffer column. As such, vertical deformation was drastically reduced in soils tested at LL.
Lateral deformation characteristics
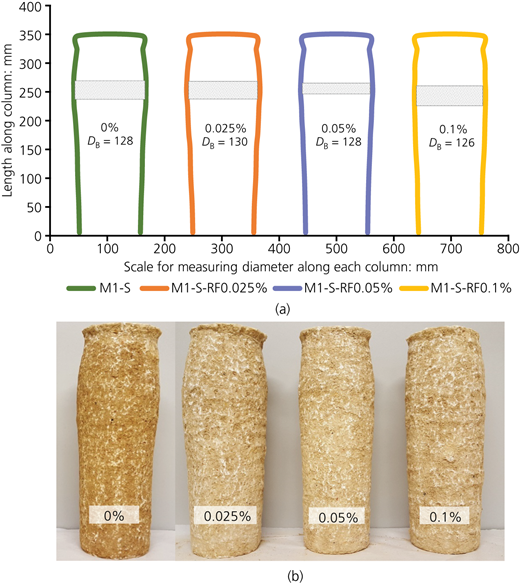
Figures 8 and 9 show the lateral deformation characteristics obtained when the columns were physically modelled after each test, for tests conducted on silts at the respective moisture contents of OMC and LL. The pictorial representations in these figures confirmed that the deformation of the columns was generally not symmetrical. Nevertheless, the diameter of the column at different locations along its length remained the same. Hence, for accurately establishing each maximum lateral bulge and the length over which it occurred, a symmetrical deformation was assumed. The measurements taken for each column were used in the Excel software program to plot their respective graphical deformation.
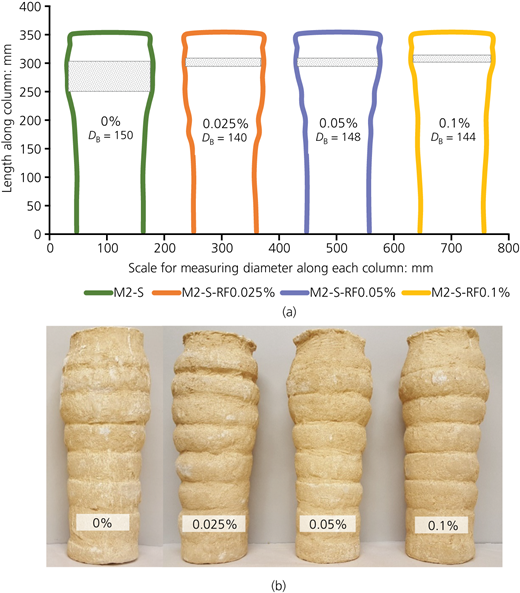
Lateral deformation characteristics of columns tested in silts at LL: (a) graphical representation; (b) pictorial representation
Lateral deformation characteristics of columns tested in silts at LL: (a) graphical representation; (b) pictorial representation
For tests conducted on silts at OMC, it was rather evident that the deformation of the columns was generally consistent with the maximum bulging diameter ranging between 126 and 130 mm. Therefore, it can be said that the inclusion of the fibres did not have a significant effect on the lateral deformation, although the length extent through which it occurred appeared to be more impacted. This observation is rather evident for the column with a fibre concentration of 0.05%, where the degree to which the largest bulge occurred was small compared with that of the other columns.
For tests conducted at LL, the deformation shape changed significantly. Compared with the OGC, the RGCs experienced lower bulging with the smallest bulge occurring in the column reinforced by a fibre concentration of 0.025%. It is also noted that the span along the column over which the maximum lateral deformation occurred was remarkably smaller compared with that in the OGC. Furthermore, as the fibre content was augmented, the columns appeared to be generally more slender although the largest bulge was not necessarily smaller. The maximum bulge was also located at a much higher position along the column.
Granular columns normally undergo lateral deformation when they are loaded. This is because the particles are not bounded into a single unit. This deformation is more prominent when the surrounding soil is soft and at a high moisture content since the confining stress provided by the host soil is low. Therefore, the loading strength of the column reduces while simultaneously being more susceptible to compression. Hence, the larger bulges obtained in this study were observed in tests conducted at LL. Basu (2009) claimed that bulging of granular columns can be reduced by internally reinforcing them; similar views were also expressed by Ali (2014) and Tandel et al. (2014). In this investigation, the results clearly showed that the inclusion of the fibres reduced bulging, except in the test where the silt was prepared at OMC and the column was reinforced with a fibre concentration of 0.025%. The reduction in diameter can be explained by the interlocking of the particles around the reinforcement, which in turn filled in a large portion of the voids to create a much stiffer column. However, when the column was gradually loaded, it reached a stage where the internal stress exceeded the confining stress, thus favouring migration of the columnar material into the host soil. Previous research on soil reinforcement by Consoli et al. (2002) showed that soil reinforcement with PET fibres increased the shear strength of the soil. Therefore, the inclusion of the fibres probably resulted in enhanced shear strength of the column, which in turn reduced lateral deformation.
Relevance of the study
Several works have been undertaken by researchers in the area of RGCs (Afshar and Ghazavi, 2014; Ali, 2014; Al-Obaidy, 2017; Malarvizhi and Ilamparuthi, 2004; Murugesan and Rajagopal, 2008). Research on soil reinforcement using plastic waste is also rather popular among geotechnical engineering researchers (Benson and Khire, 1993; Consoli et al., 2002; Das et al., 2017; Dave and Thaker, 2017; Dutta and Sarda, 2007; Neopaney et al., 2012; Sivakumar et al., 2010; Sobhee-Beetul and Kalumba, 2011). However, the reinforcement material proposed in this study to improve the performance of the traditional granular column method is a new approach that is necessary in present times where not only reusing or recycling of waste materials is necessary, but innovative ground improvement techniques are also needed to assist in meeting high construction demands.
Potential practical field challenges
Although the process of preparing the respective materials and installing the columns is rather simple, there are certain precautionary measures to follow. For instance, the mixing of fibres with sand must take place on-site to avoid the separation of the fibres and sand during transportation. This is because of the substantial difference in the density of these materials. The lumpy nature of the fibre further encourages this separation. It is, therefore, advisable to pour down the column mix gently as opposed to dropping it from a significant height. If care is not taken while pouring down the column material, the sand will fall faster than the fibre, thus resulting in the fibres being placed predominantly at the top part of any layer of sand. Under this condition, the sand–fibre composite may not be considered as being randomly mixed and consequently may result in different column properties as opposed to the anticipated ones.
Conclusions
This work investigated the effect of internally reinforcing granular columns using rPET fibres generated from post-consumer PET bottles. More specifically, the load–vertical deformation relationship of improved base silts and the deformation characteristics of RGCs were studied. Laboratory experiments were undertaken on single columns that were installed in a bespoke circular steel tank. A different concentration of fibres was used in each test to understand their effect on the performance of the column. The test samples were compressively loaded through a loading plate equivalent to twice the diameter of the column, and the load–vertical deformation relationship for each test was electronically recorded. After each test, the column material was vacuumed out and the empty hole was filled with plaster of Paris, which was subsequently allowed to set so as to obtain the physical model of the deformation of the column. Measurements of each column allowed for establishing the largest bulge and the position where it occurred along the length of the column. From the results, several observations were made, and conclusions were drawn. The key ones are as follows.
Overall, reinforcement of granular columns resulted in an enhanced load-carrying capacity when compared with OGCs.
For RGCs installed in silt beds at LL, it was evident that the loading strength increased as the fibre content was augmented.
The gain in loading strength was more prominent when the columns were installed in a softer base soil. The largest improvement in vertical applied stress was recorded in the test where the silt was prepared at LL and with a fibre concentration of 0.1%, which was actually the highest fibre content utilised in this study. The loading strength of the improved ground, under these testing conditions, was approximately 3.5 times that recorded when the OGC was installed.
Bulging was generally larger in tests conducted on silts at LL. In fact, it was evident from the study that the inclusion of fibres did not have a significant effect on lateral deformation in tests performed at OMC. In tests at LL, the smallest bulge of 140 mm was observed in the column with a fibre content of 0.025%.
The inclusion of fibres appeared to have remarkably reduced the length span along the column over which maximum bulging occurred.
Since the concept of incorporating plastic waste in granular columns is fairly new, it is recommended that further studies be undertaken in this area of research to establish certain information, potentially such as the following: stress development within the surrounding base soil during loading, shear strength properties of the RGCs, scale effect when tested on pilot scale, effect on drainage with the inclusion of the reinforcements, environmental effect of using the waste materials in the ground and physical and chemical degradation of the fibres.


Acknowledgements
The authors would like to acknowledge the Geotechnical Engineering Research Group at the University of Cape Town for funding this research. A special word of appreciation is also extended to the workshop manager for fabricating the testing tank and the trolley and to the laboratory staff for assisting in sample preparation and testing.

