Big data analytics has emerged as one of the most used keywords in the digital world. The hype surrounding the buzz has led everyone to believe that big data analytics is the panacea for all evils. As the insights into this new field are growing and the world is discovering novel ways to apply big data, the need for caution has become increasingly important. The purpose of this paper is to conduct a literature review in the field of big data application for humanitarian relief and highlight the challenges of using big data for humanitarian relief missions.
This paper conducts a review of the literature of the application of big data in disaster relief operations. The methodology of literature review adopted in the paper was proposed by Mayring (2004) and is conducted in four steps, namely, material collection, descriptive analysis, category selection and material evaluation.
This paper summarizes the challenges that can affect the humanitarian logistical missions in case of over dependence on the big data tools. The paper emphasizes the need to exercise caution in applying digital humanitarianism for relief operations.
Most published research is focused on the benefits of big data describing the ways it will change the humanitarian relief horizon. This is an original paper that puts together the wisdom of the numerous published works about the negative effects of big data in humanitarian missions.
1. Introduction
Big data has been identified by the researchers as “the next big thing in innovation” (Gobble, 2013) and the “new paradigm of knowledge assets” (Hagstrom, 2012). Companies are changing their business models and are thereby influencing routine decision-making processes as a result of emergence of extensive data analysis (Waller and Fawcett, 2013). The literature is abound with the benefits that big data can accrue (Manyika et al., 2013; Davenport and Harris, 2007; Mishra et al., 2013; Accenture, 2014). It is an agreed fact that “the long-term benefits provided by big data to create competitive advantage are vast” (Terziovski, 2010). Schoenherr and Speier-Pero (2015) have presented the results of a survey that highlights the perceived benefits of using big data in supply chains. Fawcett and Waller (2014) described big data and predictive analytics as possible “game changers” that represent potential supply chain design inflection point.
One realm in which the role of big and user-generated data has produced massive amounts of attention has been disaster response (Goodchild and Glennon, 2010). Swaminathan (2018) postulated that big data can lead to rapid, impactful, sustained and efficient humanitarian operations. Watson et al. (2017) further stated that big data has a role to play in all stages of the crisis, including preparation and pre-crisis. Most scholars agree that earthquake in Haiti in 2010 saw first formal use of big data in humanitarian operations, called as digital humanitarianism (Munro, 2013; Heinzelman and Waters, 2010; Sandvik et al., 2014; Crowley and Chan, 2011; Hester et al., 2010). A dedicated short messaging service (SMS) number 4636 was used for people to send requests for help, hence the name Mission 4636. The platform called Ushahidi, which was earlier used to report violence in Kenya, South Africa and other African countries since 2007, was used to conduct processing, geo-referencing and mapping of this data stream (Liu et al., 2010; Meier and Munro, 2010). Grassroots volunteers employed the workforce across the globe to resolve the common challenges using new tools and techniques (Jones et al., 2012). Researchers believe that the extensive application of mobile technologies in Haiti earthquake relief is a harbinger of a greater change in humanitarian relief landscape. Sandvik et al. (2014) concluded that these developments are bringing sweeping changes in the way prevention, response and resource mobilization is conducted by the humanitarian actors and is influencing affected communities. Digital humanitarianism has since been widely talked about. It has been termed as the “game changer” that has “revolutionized” (Meier, 2012) the traditional humanitarianism. Letouzé (2012) and Chandran and Thow (2013) have appreciated the great work done by digital humanitarians. Burns (2014) defines digital humanitarianism as the “enacting of social and institutional networks, technologies, and practices that enable large, unrestricted numbers of remote and on-the-ground individuals to collaborate on humanitarian management through digital technologies.” Researchers believe that traditional humanitarian community can work wonders when assisted by the new digital generation of humanitarian volunteers (Olafsson, 2012). Big data and predictive analytics as an organizational capability may be used for improving visibility in a humanitarian supply chain and coordination among actors under the contingent effect of swift trust (Dubey et al., 2018). The advances in technology in computing power and speed, and ability to analyze and communicate big data means that the response to disasters is at an inflection point (Qadir et al., 2016). It is believed that big data will impact all the stages of the disaster management cycle. New age digital volunteers have become involved in activities such as crowdsourcing, internet-based funding efforts and the development of “disaster drones” (Vinck, 2013).
Scholarly articles and After-Action Reports about the application of digital humanitarianism bring out both the positive outcomes and challenges faced in the use of big data for humanitarian missions. In light of this, is there a need for this paper? There is, for one reason. Anything that promises to be a miracle which can disrupt the norm must be scrutinized most stringently. Tall claims, if not true, can cause lasting damage to persons and organizations involved in something sensitive like humanitarian relief. This paper, through an extensive review of the published literature, will bring out the challenges that influence implementation of big data technologies into humanitarian missions. The idea of this paper is not to be a naysayer, only to sound caution because of the utmost importance of humanitarian work for scores of people affected by the disasters. The authors feel that the current academic literature covers only one side of the argument, the good side of using big data for humanitarian missions. The idea of working on this paper was not merely “gap spotting” (Alvesson and Sandberg, 2011) or to fill this spotted gap, but to put forth the arguments from the other side of the spectrum which has been largely ignored in the published work. The process involved identifying the relevant literature and testing the assumptions against the published work.
The remainder of the paper is arranged as follows. In Section 2, role of digital humanitarians in humanitarian missions is discussed. In Section 3, the process of literature review has been explained in detail along with major findings. In Section 4, various challenges of big data in application to humanitarian operations are listed and critically examined. Finally, the paper is concluded in Section 5.
2. How are digital humanitarians contributing to the humanitarian missions?
Big data for development is about converting complex and unstructured data into actionable information (Letouzé, 2012). Big data refers to extremely large data sets that may be analyzed computationally to reveal patterns, trends and associations. These data sets are big in volume, variety and velocity. The data come from disparate sources: social media, machine data and transactional data. Some of this big data is structured; most of it is unstructured. Digital humanitarians use social media and mobile data (call data records and SMS) for crisis mapping. These crisis maps are used as an aid by the traditional humanitarian organizations to deliver the relief to the affected populace. In this research too, big data refers to the social media and the mobile data only. These data contain some information in the message, as well as some geographical information is also generated about the location of the sender. This information is called as Volunteered Geographic Information (VGI), although true VGI in the strictest sense is information that is explicitly volunteered and explicitly geographic (Craglia et al., 2012). However, in the current times, implicit VGI in a social media post is being increasingly used (Senaratne et al., 2017). VGI represents unprecedented shifts in the content, characteristics and modes of geographic information creation, sharing and use (Haworth, 2017).
Digital humanitarians are people who produce and process crowdsourced and social media data for crisis mapping and decision making for providing assistance to traditional humanitarians through remote volunteer contributions (Burns, 2014). Crowdsourcing is defined as a method of creating a limited, functional data set by filtering and processing existing shared, verbalized information and by creating new data from previously private knowledge (Mulder et al., 2016). These data differ from the traditional data sets in the way of it being user generated and not created by any organization (Kaplan and Haenlein, 2010).
A traditional humanitarian agency seeks the help of a digital humanitarian organization, many of which are associated with coordinating organizations like Digital Humanitarian Network. Ideally, a large number of people contribute a large amount of data through social media and internet which is processed, visualized and analyzed by a large number of volunteers that can be located anywhere on the earth who, in turn, provide actionable information to the traditional humanitarians that are close to the scene of the disaster. However, practically, it has become a connection between those who need help and those who can provide it. Ziemke (2012) contends that the aim of digital humanitarianism should be to provide the requisite information to the traditional humanitarian organizations in order for them to function more efficiently. Digital humanitarians contribute to the humanitarian efforts in three distinct ways: improving the situational awareness, collection of unmediated reports of people’s experiences and distributed workforce that can contribute 24×7 (Burns, 2015). Vinck (2013) also highlights the use of human sensors to increase situational awareness during humanitarian disasters. Digital humanitarians conceptualize their role as anticipating and pre-emptively fulfilling the conceived needs of the traditional humanitarians (Burns, 2015).
3. Methodology
Social media and mobile data have been extensively used in assisting the humanitarian relief organizations in the recent past. The work of these digital humanitarians has found plenty of coverage in the academic papers also. This paper conducts a review of the literature of the application of big data in disaster relief operations. The methodology of literature review adopted in the paper was proposed by Mayring (2004) and was applied in numerous fields, inter alia, operations management (Shukla and Jharkharia, 2013), big data in supply chain management (Arunachalam et al., 2018), sustainable supply chain management (Gao et al., 2017; Seuring and Müller, 2008) and reverse logistics (Govindan et al., 2015). Mayring (2004) described this literature review process comprising of four steps, which were followed in this research and are presented in Section 3.2. The review of the literature was conducted with the aim of answering the following two research questions:
Are there any recorded negative impacts in the literature of using big data analytics in humanitarian relief missions?
If yes, what are these negative impacts and what caution must be exercised by the digital humanitarians to minimize the effect of it?
3.1 Existing literature reviews: big data in disaster management
There have been two literature reviews in the field of application of big data for disaster management. Akter and Wamba (2017) studied 76 journal papers through a systematic literature review. The review paper examined and presented the main contributions, gaps, challenges and future research agenda of big data in disaster management. The paper classifies and analyzes the research papers in terms of year of publishing, journal wise distribution and number of citations. The paper identifies the trends and the impact of published research in the DM context.
Gupta et al. (2017) reviewed 28 journal papers. The review paper classifies the papers into the basic scientific fields and year of publication. The review paper also categorized the papers into two classes, namely, theory building and application-based research. In the theory building category, the focus was on identifying papers that contribute to the existing organizational theories by either supporting, extending or even criticizing the same. In the application-based research segment, papers were considered as cases where industry-focused research had been conducted. The paper identifies organizational theories that are the sources of research questions in these 28 papers.
3.2 Adopted literature review methodology
The literature review process adopted in this research was proposed by Mayring (2004). The four-step process followed in the research is explained in detail in the succeeding paragraphs.
Step 1: material collection
The process of material collection commenced with setting of unit of analysis and boundary conditions for the selection of papers. The unit of analysis was decided as valid publications. Sandercock (2012) describes a valid publication as published in the right place, like in a peer-reviewed journal or in a top-ranked conference. The conditions for selection of the papers were set as follows:
Only peer-reviewed journals and conference papers were selected for the search of relevant papers.
No period was specified in the search criteria. The papers published up to January 2018 were selected.
Papers related to use of big data/VGI/social media/mobile technologies in humanitarian/disaster relief were searched.
Papers published only in English language were selected.
The search was conducted in multiple phases. The search keywords were used in research databases such as Google Scholar, Emerald, Elsevier, Springer and Wiley. In addition, a secondary search was also conducted by identifying relevant papers from the bibliography of previously selected papers. The webpages of specific journals that deal with humanitarian/disaster mitigation and relief were examined in detail to identify any relevant publication. It was decided to remove the conference papers from the review process. This decision was based on two observations. First a large part of the conference papers was getting repeated as journal papers. Therefore, to reduce the repetition and to enhance the reliability, papers published in peer-reviewed journals only were considered. Similar observation was noticed by Shukla and Jharkharia (2013). Second, the publication outlet nowadays heavily relies on the field of research, for instance, in computer science, papers in proceedings of some of the top-ranked conferences are equally or even more prestigious than articles in highly ranked journals, while in the natural sciences, conference publications have little to no value in the track record (Derntl, 2014). After this exclusion step, the completed search phase of the research resulted in 45 journal papers for further review. An important observation here is that there were only three papers that made the final list which were from the journals dedicated to humanitarian logistics field. This may be due to the nascent development status of the field. Remaining publications were from wide variety of journals, ranging from geography, computers, behavioral science to social sciences.
Step 2: descriptive analysis
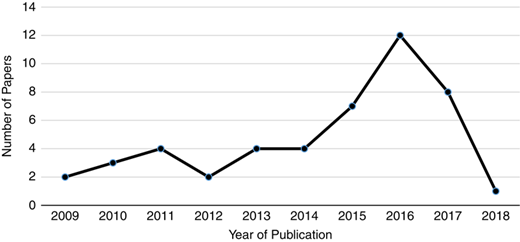
This step of the research included segregating the papers based on descriptive criteria like year of publication, country affiliation of authors, the disaster covered by the paper and the source of data points used in the paper. The number of papers published according to the year of publication is presented in Figure 1.
The academic research in the field of big data in humanitarian logistics started getting published around the year 2009. The field is showing a progressive increase in the number of papers getting published in peer-reviewed journals. The number of publications is likely to rise further as papers only up to January 2018 have been considered in this review. Although conference papers are not a part of this paper, they saw a major uptrend in the year 2010 following the Haiti earthquake.
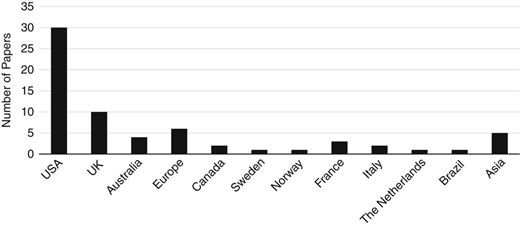
Most of the research in this field is concentrated in the Global North. An overwhelmingly large number of authors belong to the USA. Figure 2 presents the country-wise affiliation of the authors. The presented figure has much larger number of authors than the total number of papers being reviewed because most of the papers have more than one author.
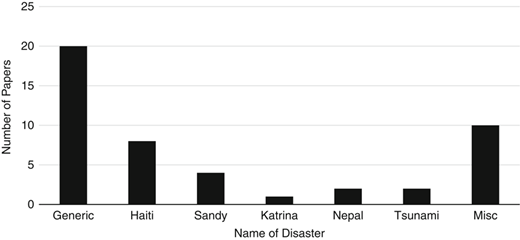
The next descriptive statistic is the classification of the papers based on the disaster that was discussed in each of them. Not surprisingly, Haiti earthquake was the most represented disaster in these papers. The biggest share of the papers did not discuss any specific disaster but were generic in the description. In addition, some of the disasters which are clubbed as miscellaneous were those with only one paper written on them, e.g. Hurricane Gustav and Ike 2008, Germany Floods 2013, Colorado floods 2013, etc. A connection between large number of US authors can be made with the large number of papers that discuss the disasters that happened in the USA or close to it (Haiti earthquake and Hurricanes Sandy and Katrina). The data are presented in Figure 3.
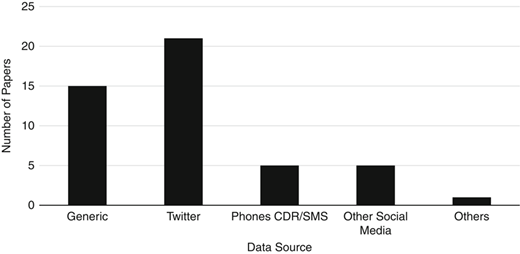
Another categorization of the papers was done on the basis of the data source of these 45 papers. Although the largest number of papers belonged to “generic” category, Twitter was the single most preferred data source for the authors. This finding is in consonance with some other academic papers like Tufekci (2014). The statistic is presented in Figure 4.
Step 3: category selection
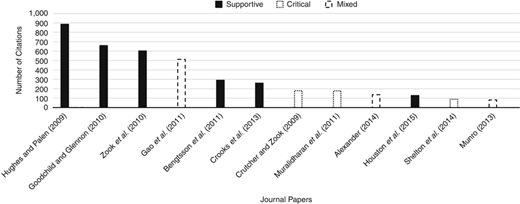
The main purpose of this paper is to identify the challenges that adversely affect the implementation of big data in humanitarian relief missions. This led to the decision to analyze the contents of the selected papers with premise of whether the paper is critical of the use of big data or is supportive of the use. A third category was also formed that contained journal papers that presented both the positives and the negatives of using big data in humanitarian missions. These papers were then analyzed based on the number of citations that they have received. This statistic reveals the massive “popularity” of the papers that support the implementation of big data in this field. This further validates the point of writing this review paper, i.e., to bring to fore the challenges of such an implementation. Figure 5 presents the top 12 cited papers and the number of citations received by them. The papers are also classified as supportive, critical or mixed based on the inclination of the included text of the papers.
Step 4: material evaluation
A detailed evaluation of the selected papers was conducted in this step. The highlights of each of the paper were recorded and specific observations were compiled. A large number of challenges were reported by many authors in the publications. The papers that were critical of the use of big data are summarized in Table I. The papers are listed in the chronological order as per the year of publication. The list also summarizes those papers that have a mix of both supportive as well as critical content for the use of big data in humanitarianism.
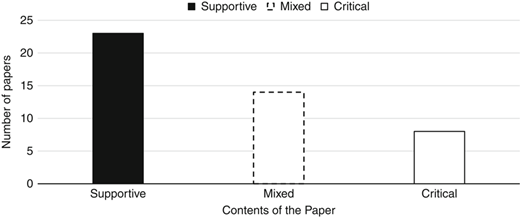
Figure 6 represents a summary of the papers based on the content. It is evident that most number of papers are either supportive of the use of big data or present both the advantages as well as the challenges of such an application.
4. Challenges of applying big data analytics to traditional humanitarianism
A fundamental misconception of both its strongest advocates and fiercest skeptics is that big data is expected to be – or contain – the answer to all human problems (Letouzé, 2012). The hype surrounding the buzz has led everyone to believe that big data analytics is the panacea for all evils. There has been an avalanche of “tech-optimistic” scholarly work, premised on the belief that adding technology will change things for the better (Crowley and Chan, 2011). Larger data sets and quantification are being considered as the magic bullet for all problems, which can only be termed as naive. At worst, this view can devolve into the “end of theory” (Burns and Thatcher, 2015). A large part of the published research is focused on bringing out the transformations that digital humanitarians have already produced and how the future humanitarianism will be completely changed because of the big crisis data. Many of the researchers have claimed that Mission 4636 and Haiti has disrupted the traditional humanitarian response. However, Munro (2013) pointed out that these are incorrect reports from some technical NGOs that are trying to market their own technology. The author has highlighted through his work that any success in Haiti was a result of the use of the existing technologies – and not due to any new technology being developed. The only innovation that happened with Mission 4636 was the use of real time micro-tasking translation. Ziemke (2012) also highlighted that the continuing importance of local media, ham radio, conventional radio, and paper and pen is apparent, and dialogue and best practices continue around the importance of keeping low-tech solutions a key part of the practice. Technology alone cannot fix broader, long-standing problems, such as ineffectual information management, which can lead good data to go unused (Sandvik, 2016). Such dissenting voices need to be heard with greater attention before any conclusion about the great powers of this new trend of digital humanitarianism is adopted wholeheartedly. There are a lot of issues in successful implementation of the strategies for humanitarian missions incorporating big data. The reasons why we must be extremely cautious while advocating the use of big crisis data in humanitarian missions are presented in the following sections.
4.1 Digital divide among the population
Technologies have a tendency of reinforcing extant power dynamics and social inequalities rather than disrupting them to create equality (Burns, 2015). To further compound the issue, the decisions regarding the way new technologies will be developed are also taken by those who are already a part of the “Global North” (Graham, 2008). Similar criticism has been alleged upon humanitarianism, which is often seen as a social relation that favors the more affluent (Hyndman, 2009). Digital humanitarianism also suffers from the same critique because the access to technology lies more with the rich and the literate. Big data has its own particular blind spots regarding populations that are overlooked by it (Lerman, 2013). Digital data do not necessarily reflect the on-the-ground conditions, but instead are a representational negotiation rooted in spatial inequalities (Burns, 2018). The rise of digital humanitarianism has meant that the communities with limited or non-existent access to connectivity and digital technologies – risk becoming an invisible part of the humanitarian space (Sandvik et al., 2014). A report by World Bank (2013) highlights the inequalities that exist in the technology usage in the world. In 2011, mobile subscriptions reached 114 percent of the population in high-income countries with only 42 percent in low-income countries. The report also highlights that internet users range from 76 percent in the developed countries to a meager 6 percent in the low-income countries. Most individuals in the low-income countries are not experienced in using mobile phones for anything beyond basic voice calls (Vinck, 2013). Generic literacy issues may further restrict users’ ability to read text messages or on-screen instructions (Knoche et al., 2010).
Digital inequality is strongly correlated with economic inequality, physical location (e.g. rural vs urban) and socially constituted identity markers, such as caste and gender (Mulder et al., 2016). Crutcher and Zook (2009) took the argument further to illustrate that the cyberspace is divided also based on race. The authors illustrated that race still remains relevant to the way people use (or do not use) the internet and internet-based services. Google Earth mapping services in the post-Katrina context reflect the racial distance between the communities and have arguably reinforced and recreated racialized cyberscapes. Crawford and Finn (2015) called this a “signal problem,” as some communities may not be producing any signal. Even in the urbanized areas, the coverage will not be uniform – temporally, geographically or socio-demographically (Carley et al., 2016). Hilbert (2011) defined this digital divide as unequal distribution of technology in the world. This divide is a result not only of the unequal technological infrastructure or the financial capabilities of the population, but also the data savviness of the users.
Crisis mapping done solely based on digital inputs received through crowdsourcing will invariably reflect that the more affluent localities are worst hit because of the disaster which may well be in total contradiction with the reality on ground. Crisis maps produced by volunteered social media information sometimes will end up reflecting, in part, the density of people who were able to participate online by region, rather than the severity of needs (Mulder et al., 2016). Significant portions of populations at risk, especially marginalized or vulnerable groups, may not be regular users of new technologies. This may make them harder to reach while they are, typically, the most vulnerable (Vinck, 2013). It would be unwise to consider spatial concentrations of social media activity in disaster situations as being equivalent to areas in need of relief. It may, in fact, promote inequality by ignoring areas with no online activity which may be due to lack of access to the appropriate technologies or conditions like power outages preventing the use of such tools (Shelton et al., 2014; Crawford, 2013). The very fact is that the big crisis data are being produced, analyzed, funded and initiated by the people and organizations in the Global North render it difficult to believe that technology is empowering or liberating (Read et al., 2016).
4.2 Imperfections in the data collection technology
Twitter and SMS have emerged as the two main data input modes that feed situational events into disaster mapping platforms. In fact, Twitter research has overshadowed all other social media platforms. Twitter has received almost 500 times as much attention as it deserves, relative to SMS and e-mail (Munro and Manning, 2012). This preponderance of Twitter studies is mostly due to easy availability of large number of data points, tools and ease of analysis (Tufekci, 2014). On the other hand, larger social media networks like Facebook do not make the data available as easily. More than 50 percent of all Facebook accounts are “private,” whereas only 10 percent of Twitter accounts are “private.” Twitter profiles have simpler privacy settings with the accounts being either “all public” or “all private” in contrast to other social media platforms that have more complicated settings. Twitter also has only a few functions like retweet, mention and hashtags (Tufekci, 2014). Although Twitter makes it easy to collect and analyze the data, there are some issues in using Twitter data because of the way this social media platform works.
Twitter has a set mode of working where some tweets from certain accounts are promoted. The selection of these accounts is based on the number of followers, its social network and other heuristics that are confidential (Gillespie, 2010). These increased tweets from some particular accounts can create an artificial localized tragedy within the disaster. Similarly, it cannot be assumed that accounts and users are equivalent. Some users have multiple accounts, while some accounts are used by multiple people (Boyd and Crawford, 2012).
Software applications called web robots or bots have the task of running scripts over the internet (Dunham and Melnick, 2009). Twitterbots and Facebook bots are commonly used on the social media applications. These bots work faster than the humans and send regular updates while masquerading as humans (Crawford and Finn, 2015). Twitterbots tweet, retweet, like, follow and unfollow other accounts and tweets. A bot can perform most human tasks by calling Twitter APIs. The network gets even more complex because the bots are friending other bots. More interestingly, in the middle between humans and bots have emerged cyborgs, which refer to either bot-assisted humans or human-assisted bots. Cyborgs too have become common on Twitter. Chu et al. (2012) calculated that there were 36.2 percent cyborgs and 10.5 percent bots among 200m total users. Such large number of automated users can create confusions for the digital humanitarians.
Twitter does not provide the complete data when a keyword is searched. There are three levels of access to Twitter data. “Firehose” provides access to all the tweets but is available to only a select few at a hefty price. “Gardenhose” provides 10 percent of the tweets in exchange for a price. Most research works are based on a “spritzer” which represents only 1 percent of the total tweets (Boyd and Crawford, 2012; Landwehr et al., 2016). It is obvious that any analysis based on such a small sample cannot be considered as accurate. There are also linguistic challenges; most of the infrastructure for analyzing Twitter, including thesauri of keywords and sentiment dictionaries, are designed around English and not in other local or national languages (Landwehr et al., 2016). In case of Haiti, the aid community used Twitter and crisis-affected community primarily used SMS. Because of the differences, systems built on Twitter alone cannot be extrapolated to large scale projects that engage the crisis-affected population (Munro and Manning, 2012).
There is a strong dilemma as to whether the communication between the affected people and the humanitarians should be unidirectional or bidirectional. During the first known formal use of technology in disaster relief in the Haiti earthquake, people were disappointed with the SMS service 4636 because there was no response from anyone in return (Clemenzo, 2011). This sometimes can increase the sense of desperation among the affected people – that no one is listening. On the other hand, microblogs and crisis maps also do not provide a mechanism for apportioning response resources, so multiple organizations might respond to an individual request at the same time (Gao et al., 2011). In Haiti, nonprofits and media organizations used information dissemination and disclosure effectively, but failed to capitalize on the innate two-way communication nature of social media (Muralidharan et al., 2011). This, though, may have been intentional owing to a lack of resources to respond to the individual messages.
Then there are problems of two-way communication too. It may raise expectations and frustration if any acknowledgment or response is not given back to the affected population (Vinck, 2013). A Red Cross survey in this field revealed that 76 percent of the Americans want the help to reach them within 3 h of sending a request on social media platforms, a rise of 8 percent in one year (American Red Cross, 2012).
4.3 Challenges because of the nature of big data
Big data is characterized by the data that are “big” in terms of volume, variety, velocity and veracity. This high dimensionality of data brings some inherent problems along with it (Campos et al., 2016). There are numerous extant challenges to the use of citizen observers, namely, issues of reliability, quantification of performance, deception, focus of attention and effective translation of reported observations/inferences (Tapia et al., 2011).
Large volume of data may not always be a good thing to happen when the time to react is short, as is the case with most humanitarian actions during a disaster. This overflow of information in the big crisis data can hamper the crisis response (Qadir et al., 2016). In time-constrained situations, decision makers can only process a certain amount of information, and in situations where there is limited understanding of the nature of a problem, the search for more data can obscure the need for more analysis (Chandran and Thow, 2013).
Big crisis data has a large variety. The data come from social media platforms like Twitter and Facebook, data exhaust including call data records, aerial imagery from satellite, UAV and drones, crowdsourced data, information from the affected population, newsfeeds, journalists, etc. These data are both structured and unstructured. On top of that, the information is in different languages (Qadir et al., 2016).
There is a serious issue of verifying the correctness of the data. Most crisis data are collected from crowdsourcing and twitter. Trust and credibility play a critical role when the organizations decide to use big crisis data. Crowdsourced data are usually without metadata or any guarantee about their quality (Shanley et al., 2013). The incorrectness in the data may be through the acts of commission or omission. It is a big challenge to ensure that “humanitarian efforts are not derailed through the spreading of incorrect or stale information” (Qadir et al., 2016). Such false inputs dilute the signal to noise ratio thereby making it extremely difficult to make sense of the analysis. The problems of noise in the crowdsourced data are graver as it is easy to intentionally inject inaccuracies. Noise accumulation effect is especially severe in high dimensions and may even dominate the true signals (Fan et al., 2014). Messages or surveys sent out by the government or humanitarian organizations should be transmitted in a way that somehow verifies the authenticity of the sender (Pétursdóttir, 2013). Tapia et al. (2011) found that the data produced through microblogging was untrustworthy. In addition, while the speed of gathering data was mentioned, it was not to be achieved at the cost of veracity. Humanitarian actors prefer to use their own field personnel to collect information on needs and damage since they can treat their own channels as reliable (Meier and Munro, 2010).
Mulder et al. (2016) highlight the problems associated with the method by which the crisis data are collected and used for humanitarian missions. The data need to be in the correct format, otherwise, the risk of it not actually being used is high. The steps involved in the big crisis data analysis process are interfacing of different distinct worlds. Local explicit and tacit knowledge is converted into spoken words or written message or tweet. This may cause misunderstandings as it is not possible to correctly identify the context and the circumstances behind the short, written message. It is also an incorrect step to append or amend a primary source that is digitally collected. The real significance of the data can only be made if individual unfiltered information packets are allowed to cross-pollinate and make sense in context (Burns, 2015). Mulder et al. (2016) call it as the first mutation in the datafication process. As in most of the times, this first input is in the local language, a second mutation of the message occurs when it is converted into English such that the global volunteers can understand it. The next stage is the data processing in which substantial mutation takes place because the information is “morphed to fit a pre-existing data structure, requiring data processing volunteers to make numerous judgements about categorization, labelling and filing” (Mulder et al., 2016). The experts are then required to analyze these data and provide the decision makers with advice about the future course of action.
4.4 Volunteer issues
Most digital humanitarians are volunteers situated all around the globe who contribute toward the mission purely based on their inherent goodness to help people in distress. These volunteers are involved in crowdsourcing and calls for funding on the internet. It may seem that there are a large number of such volunteers available, but in reality, “enormous efforts are required to attract and sustain those inflows of volunteers, and to maintain the social and psychological well-being of ongoing volunteers” (Burns, 2015). The humanitarian volunteers have a high turnover rate (Kovács and Tatham, 2009). These volunteers are “a fragile and finite resource, frequently subject to burnout” (Vinck, 2013). Trauma and fatigue remain a concern for these volunteers, though they may be thousands of miles from the crisis (Ziemke, 2012). Munro (2013) reported that maintaining the volunteer initiative is the hardest part. Meier and Munro (2010) also found out that motivating an unpaid workforce after one month is a difficult task even among the most dedicated volunteers. Another problem with the remote volunteers is that they may suffer from post-traumatic stress disorder at higher rates than their on-the-ground counter-parts akin to the findings of Chelala (2010) about the military personnel. It is suggested that one reason for this is the sudden mental shift that the remote worker has to make between sometimes traumatic work and their home lives, with the disconnect between the two meaning that they lose the benefits of socialization (Munro, 2013). The volunteers eventually dropout of the humanitarian mission in case of such a burnout or simply when the focus of media gets shifted from the disaster to something more saleable. This sudden withdrawal of volunteers makes them unreliable and the trust levels between the traditional humanitarians and these volunteers may suffer in the long run. Some researchers like Capelo et al. (2012) have brought out that the reliability and predictability of volunteers is suspect and volunteers have sometimes not delivered the desired results.
Incentivizing the volunteers too is a debatable issue. The incentives range from motivational and e-mail of thanks to free mobile airtime or prizes (Vinck, 2013). Simple and small incentives, such as mobile airtime, are a mechanism for rewarding people for their time (Pétursdóttir, 2013). Such monetary incentives can also become a reason for misreporting (Chandran and Thow, 2013). There is a need to ensure that the compensations are commensurate to the time and effort of the volunteers and do not become the only reason for participation (Vinck, 2013).
The continuing incidences of natural disasters and complex emergencies and their associated challenges including the requirement to build relationships with diverse stakeholders have increased the demand for humanitarian logisticians (Tatham et al., 2010). UN General Assembly (1991) lays down humanitarian principles as humanity, neutrality, impartiality and operational independence. Humanitarian values based on these principles are instilled in the humanitarian organizations through training, motivation and teachings. However, there are no contractual agreements between the traditional humanitarian organizations and the digital humanitarians. Digital humanitarians who have no formal training in the humanitarian relief operations may not fully fathom the gravity of these principles, resulting in violations of the basic tenets. Vinck (2013) points out that the volunteers engaged in digital humanitarianism may not have enough contextual understanding to assess effectively the impact of their own work in relation to the “do no harm” principle (Anderson, 1999). Individual volunteers participating in such initiatives are often less equipped than traditional humanitarian actors to deal with the ethical, privacy and security issues surrounding their activities (Sandvik et al., 2014). Traditional humanitarian organizations have evolved over decades of practical experiences that are often documented as Standard Operating Procedures (SOPs). These SOPs are essential as they help chalk out plan of action in the critical initial days of a disaster (Tapia et al., 2011). Volunteer digital humanitarians are not trained to follow these SOPs, and this could be a big barrier to collaboration. In addition, traditional humanitarian organizations have hierarchical structures, whereas the digital humanitarians have flat, non-hierarchical horizontal structures. This results in a difference of speed between the two and hence major coordination issues (Van Gorp, 2014). Despite the great potential and many positive effects of technological innovation, it can also compromise the core principles of humanitarian action and obscure issues of accountability of humanitarian actors toward beneficiaries (Sandvik et al., 2014). There are no clear indications to know the extent to which these digital humanitarians consider themselves as engaged in humanitarian operations and therefore, “as accountable according to the standards and principles of the humanitarian enterprise.” Burns (2015) presents the apprehension of traditional humanitarian workers that big data represents too significant a departure from established and tested humanitarian and emergency management practices to take root.
Similar problems are likely to be encountered when the decision making is automated based on algorithms that may or may not be based on “sufficiently contextualized indicators or in accordance with humanitarian law and standards of practice” (Vinck, 2013). It is even more difficult to know whether set standards are being followed or not.
4.5 Ethical and data security issues
Digital humanitarianism – like all modern applications of technology – also raises serious ethical and security issues. Larger volume of data stored centrally has an amplified technical impact and other privacy-related issues (ISACA, 2014). Data exhaust is one such avenue where unintentional leakage of sensitive information can take place. Data exhaust refers to the data generated as “trails or information by-products resulting from all digital or online activities.” These consist of storable choices, actions and preferences such as log files, cookies and temporary files. These data can be extremely personal and revealing about the user. Network connectivity leads to development but it also threatens larger surveillance, behavioral change and interdiction in the hands of states, corporations and security agencies (Duffield, 2016). In many cases, the users of services and devices generating data are unaware that they are doing so (Letouzé, 2012). In a crisis situation, people reveal location data, whether intentionally or unwittingly through the sharing of photos or requests for help that reveal highly sensitive personally identifying information (Crawford and Finn, 2015). The affected individuals may be pressed to accept things in emergency, which may later make them easy targets for private companies’ interests (Sandvik et al., 2014). Ioannidis (2013) argues that even in such cases, consent is absolutely required. This is true even for data where their current importance is unclear, the perception may change in the future. It has now become possible to “de-anonymize” previously anonymized data sets (Narayanan and Shmatikov, 2008). The result is “data sets that can be overly intrusive, collect personally identifying information without informed consent, and may have serious unintended consequences, particularly when brought together with other kinds of personally identifying data” (Crawford et al., 2013). While the organizations are looking at better situational awareness and ease of business through the use of big data, they must consider potential harms that data, gathered and stored in digital forms, pose to the affected communities especially those who are already marginalized and are more risk-prone (FitzGibbon, 2017).
This collection of data entails risks of abuse and misuse. With big crisis data, there is always the “danger of the wrong people getting hold of sensitive data – something that can easily lead to disastrous consequences” (Qadir et al., 2016). Such security issues are commonly seen in disturbed areas like Pakistan, Sudan, etc., where the humanitarian actors are often perceived as favoring the other side. Revealing of information like travel details and locations of the stakeholders can prove dangerous if the information gets transmitted to armed state/non state actors (Chandran and Thow, 2013). Humanitarian organizations may suffer a loss of credibility if they are seen as favoring one or the other side in situations where they are used as “force multipliers” in order to control precarious situations (Collinson et al., 2010). This new technology is a double edged weapon as it enables the governments or armed groups to communicate and organize against the humanitarian organizations that are seen to be on the other side of the fence (Bott et al., 2014). These new technologies can also create new threats, where the governments can have stricter surveillance and can manipulate the data to suit their own motives (Chandran and Thow, 2013). During Haiti earthquake response, the messages sent by affected persons had sensitive personal information which was susceptible to security breach. Crowdsourcing by the volunteers suffers hugely from this drawback in which security of the data is at greater risk. It would be inappropriate to use such unsafe method of collecting and transmitting information by the volunteers in setting where the risk is greater like in conflicts or when there is an oppressing regime in power (Munro, 2013). Additionally, many governments, corporations and organizations have not developed data policies, so humanitarians must navigate within undeveloped frameworks and face security issues with accessing data (Whipkey and Verity, 2015).
Bad news is often good news for 24×7 electronic media. It helps increase the viewership when people watch the coverage of such events. However, some media houses often use the disasters to increase their viewership and readership by sensationalizing the most dramatic images (Vis, 2013). Such information can lead to errors in judgment by the humanitarian logisticians. Media exposure has another disadvantage too. The digital humanitarian efforts at Tufts University Boston were closely monitored by the media. Post-disaster analysis conducted by Munro (2013) proves that the output of that center was very low. Camera crews and journalists often resulted in loss of focus by the volunteers. Another disadvantage is that the media loses interest in the disaster long before the actual needs of the affected persons are completely met.
Satellite imagery is also adding to the vast amount of data that can be analyzed in times of disaster. Most of this imagery is freely available. But there are big commercial organizations that produce and own these images. These organizations control what we see and how we perceive the world when we look through these images (Dodge and Perkins, 2009).
4.6 High initial costs
Implementation of new technology solutions is very costly in terms of capital money as well as skills required from the workforce. Small humanitarian organizations do not have the ability to bear these costs. Vulnerable populations also face similar constraints that prohibit them from fully utilizing the benefits of these new technologies. Smaller humanitarian organizations suffer this divide a little more and hence are deprived from using technology effectively (Vinck, 2013).
Data analysis costs money. The collection of data may be cheap because of the voluntary nature of crowdsourcing, but the analysis is not. Analysis of the data is the job of experts. It costs money to hire good experts who can convert these raw data into actionable inputs. This cost of analysis can become a large proportion of the total scarce budget (Chandran and Thow, 2013).
4.7 Cultural and language induced errors
People tweet in a cultural context that can be particularly difficult for geographically distant researchers to parse (Crawford and Finn, 2015). The people affected by the disaster are often culturally very different from the geographically dislocated digital humanitarians. It becomes increasingly difficult to clearly understand the real meaning of the messages in absence of the cultural context. Even for traditional humanitarians, there is a need of understanding about local culture as a part of basic knowledge before any humanitarian missions are deployed (Radianti et al., 2016). Twitter users have their cultural specificities data like age, geographical location, economic status and language. It is extremely complicated to find the differences of how people of different cultures express their feelings (Letouzé, 2012). Social media finds most of its users in urban young population. This means that sub-groups of old and poor people which are often the most vulnerable are likely to be excluded because they are not part of social media platforms like twitter (Crawford and Finn, 2015).
Change of language from local to English is a major reason for loss of meaning in data transformation process. In addition, the big crisis data are in English. Their usage in terms of maps, reports, etc., is also in English. Some groups of local affected people do not find it difficult to contribute or access the crisis data, others lose access at some point during the knowledge transformation process (e.g. through translation) and some are unable to contribute their knowledge at all (Mulder et al., 2016). In case of Haiti, the locals who knew only the Kreyol language and were the key source of information were not able to use the project outputs and hence could not garner the benefits of it. The end product of crowdsourcing platforms is to collect data and process it into information, maybe long after the disaster. This information should become the basis for policy making like allotment of relief funds, rehabilitation planning, etc. (Sutherlin, 2013). Because of the barriers of language, the people who have contributed to this information and who need this information remain devoid of the end product, i.e., the information.
Cybernetics does not pay much heed to the biases of subjective beliefs and motivations (Duffield, 2016). Crowdsourced data get transformed by different actors in the digital humanitarian chain and the crisis knowledge is finally supplied to formal humanitarian aid organizations (Mulder et al., 2016). Because of the contrastive geographies between a locally situated person in need and the distantly located digital humanitarian, the contexts of the information may change (Burns, 2015). The level of knowledge and the motivations to transfer that knowledge by the affected person is quite unique which is often not very apparent in the big data scenario. The knowledge produced through big data technologies data and practices is always partial and reflects the geographical and social contexts of the people producing this knowledge. This is “an important admission because the stakes are so high: if humanitarian organizations’ practices and operations eventually come to be influenced by big data, the way they come to understand on-the-ground conditions will be impacted by these partialities” (Burns, 2015).
4.8 Statistical errors
Social media and the data associated with it will always have sampling bias and it must be considered before making any decisions (Qadir et al., 2016). People in less developed world have an inbuilt lack of trust for technology and are often afraid of fraud (Vinck, 2013). This may create further biases in the data that are difficult to remove. Systemic bias can creep into the data as a deliberate action by people. Different ethnicities in the population will often introduce this bias knowingly or unknowingly. Participation bias is the difference arising due to lack of information generating means for a large section of the population. Twitter feeds from a particular place regarding large number of injuries will reflect the fact that disaster has affected many people in that area. But this also means that people in that area have larger access to twitter. It is incorrect to assume that other areas from where there are no feeds are not affected. This may be attributable to the fact that people in other areas are not able to send tweets because of numerous reasons (Chandran and Thow, 2013). Populations with less access to technology will get underrepresented in data – thus the “need of sound statistical analysis is not obviated due to the large size of data” (Qadir et al., 2016).
Price and Ball (2015) highlight the impact of event size bias which is the variation in the probability that a given event is reported related to the size of the event. The authors argue that big events are likely to be known, small events are less likely to be known. These differences in the likelihood of observing information about an event can skew the available data and hence in faulty decision making.
High dimensionality of big crisis data brings spurious correlation. In high dimensions, there is a large possibility that two unrelated events may have high sample correlation. This can lead to “false scientific discoveries and wrong statistical inferences” (Fan et al., 2014). Letouzé (2012) highlights a case of such spurious correlation when Ushahidi system claimed to have found a relation between damaged buildings and the SMS stream. These two were actually positively correlated with the presence of buildings but had a negative correlation between them. This correlation was negative because often, people will first get to a place of safety away from the damaged building before sending SMS. This wrong assumption that SMS stream was positively correlated with damaged buildings actually resulted in underreporting from the worst affected areas.
5. Discussion
Use of technology in the humanitarian actions is as old as the humanitarianism itself. Application of new technologies and data has been subject to criticism and skepticism historically. With the use of new technologies, similar debates have happened in the past regarding its consequences and implications on the traditional humanitarian operations and its basic ethos (Read et al., 2016). New technologies have been the harbingers of improved humanitarian actions through empowering the populations by making them a voice in post-disaster management. These new technologies have found a place in the traditional humanitarian missions as part of natural evolution process (Vinck, 2013). There is no doubt that the new technologies have the power to transform the humanitarian horizons. New technology and the promise of big data must not be considered as “another tool in the tool box, but as a potentially substantial transformation of practices around data procuring, analyzing, and sharing. Accordingly, its future utility in humanitarianism is neither inevitable nor value-free” (Burns, 2015).
Keeping with the prime focus of this paper, this adoption of big data into humanitarian missions must be very cautious. There is a need to carryout evaluation of the risks and rewards that this transformation encompasses. Complete reliance on technology can prove catastrophic because disasters often lead to collapse of technological infrastructures (Vinck, 2013; Hosein and Nyst, 2013). This may have an impact on both the affected populace as well as the humanitarian actors. The destruction of the technical infrastructure is often uneven. Ironically, the worst affected areas suffer the most; and therefore, they are unable to register themselves on the digital map. Language barriers, cultural biases, digital divide and other reasons adversely affect the understanding of the actual disaster by the digital humanitarians who are situated far away from ground zero.
Researchers feel that the biggest negative impact of digital humanitarianism will be the pulling back of the traditional humanitarians to “safer” areas. This would mean that there will be lesser control on the aid that is extended to the affected communities. Independent, non-biased traditional humanitarians will have to depend on the local representatives (who may themselves be the affected party) for information. By handing over the control of relief missions to the affected communities, “cyber-humanitarianism side-steps the moral and political tenants of liberal humanism: neutrality, autonomy, impartiality, protection and witness” (Hopgood, 2013). Digitalization of the humanitarian information must not become an alternative to real personal contact of humanitarians with the affected populace and it is simply not a “digital recoupment of the consequent loss of face-to-face contact” (Duffield, 2014). There is a need to be extremely careful in order to avoid a situation where technology simultaneously allows access to remote areas and populations but may also facilitate the “retreat of aid workers from the physical site of disaster” (Garman, 2015). Collinson et al. (2013) termed this retreat as the “bunkerization of humanitarian actors,” which involves a progressive withdrawal of many international aid personnel into fortified aid compounds, secure offices and residential complexes, alongside restrictive security and travel protocols. Healy and Tiller (2014) acknowledged that this widespread retreat or physical circumscription of an international ground presence in challenging or politically difficult environments affects international aid agencies. While this has helped the workers to work safely, remote management has compounded the problem of physical segregation by decreasing transparency, as the organizational layers separating HQ policy intent from on-the-ground completion have multiplied (Duffield, 2013). Shelton et al. (2014) drew the inference that while such participatory, user-driven and technology-centric efforts have the capability to accentuate the aid missions, these have biases in terms of participation and assistance, and should therefore, not be considered as a replacement for more coordinated “on-the-ground” relief efforts. In the end, through the paper, it must be underscored that traditional human-centric and face-to-face information gathering and sharing must continue to play the most crucial role in humanitarian responses.
6. Conclusion
Big data is changing the landscapes of the fields where it is being applied. It has found large acceptance in medical applications like health parameters monitoring and transmission of data (Hsieh et al., 2013; ISACA, 2014), economics and finance (Fan et al., 2014), predicting stock market (Bollen et al., 2011), to name a few. The pertinent question for the traditional humanitarians is whether they should go ahead and embrace this new trend, or should they stay away from it because of the inherent challenges and risks? Like in most dilemmas that we face, the answer in this case too lies somewhere in the gray zone. The advocates of digitalization of humanitarianism must realize that by virtue of being situated within the global emergency zone, where things continually fall apart, are destroyed or malfunction, the humanitarian cyberspace is characterized by gaps and shadows – and, importantly, is subject to local context and historical events (Sandvik, 2016).
In this paper, an attempt has been made to present the counter arguments about the use of technology into the humanitarian relief operations. The paper is intended at raising the awareness about the adverse impacts that distancing of the humanitarian actors from the site of disaster may have on the relief mission. The humanitarian practitioners must be wary of the alleged “neutrality” of data. The humanitarian efforts must remain alert to the fact that data do not represent the exact ground reality. Sometimes, it obscures more than what it reveals. Humanitarian aid agencies cannot withdraw from a person-to-person engagement on the ground and depend on distant sensing through the means of big data. Aid agencies must continue to brave risks and friction on the horizontal plane rather than retreating to a more secure and distant vertical plane.