This paper aims to address a location-distribution-routing problem for distributing relief commodities during a disaster under uncertainty by creating a multi-stage model that can consider information updates during the disaster. This model aims to create a relief network that chooses distribution centers with the highest value while maximizing equity and minimizing response time.
A hybrid algorithm of adaptive large neighborhood search (ALNS) and multi-dimensional local search (MDLS) is introduced to solve the problem. Its results are compared to ALNS and an augmented epsilon constraint (AUGMECON) method.
The results show that the hybrid algorithm can obtain high-quality solutions within reasonable computation time compared to the exact solution. However, while it yields better solutions compared to ALNS, the solution is obtained in a little longer amount of time.
In this paper, the uncertain nature of some key features of the relief operations problem is not discussed. Moreover, some assumptions assumed to simplify the proposed model should be verified in future studies.
In order to verify the effectiveness of the designed model, a case study of the Sarpol Zahab earthquake in 2017 is illustrated and based on the results and the sensitivity analyses, some managerial insights are listed to help disaster managers make better decisions during disasters.
A novel robust multi-stage linear programming model is designed to address the location-distribution-routing problem during a disaster and to solve this model an efficient hybrid meta-heuristic model is developed.
Highlights
Proposing an equitable relief commodities' distribution network for disaster response.
Integrating distribution centers' location and relief commodities allocation-routing problems.
Designing a multi-stage mathematical model that can adjust the relief plan based on new data
Considering distribution center location's characteristics as a maximization objective function.
Developing an efficient ALNSxMDLS Meta-heuristic to solve the model.
1. Introduction and literature review
Natural disasters such as earthquakes, floods, hurricanes and tsunamis have increased dramatically as a result of climate change and the rapid temperature rise. Over the last few years, there have been around 500 destructive disasters, resulting in 75,000 deaths. In 2004, a 9.1–9.3 magnitude earthquake and tsunami struck the Indian Ocean, killing more than 227,000 people in 14 countries. The earthquake in Kashmir the following year, with a magnitude of 7.6, killed over 87,000 people, injured approximately 138,000 residents and displaced over 3.5 million people.
Natural disasters have an impact on people's lives, their mental and physical health, the economy, societies and especially the environment, so they must be effectively managed. Mitigation, preparedness, response and recovery are the four phases of disaster management. The mitigation phase encompasses any action taken to reduce disasters' risk factors and consists of setting hazard mitigation policies, planning, emergency actions and post-disaster reconstructions (Xu et al., 2019). The preparedness phase fosters managers' ability to simultaneously deal with multiple emergencies during and after a disaster (Das, 2018). The response stage's goal is to preserve lives and lessen the effect of a catastrophe by evacuating and rescuing residents, delivering relief supplies and treating the injured promptly. Lastly, the recovery or reconstruction stage refers to activities that assist communities in surviving and, eventually, returning to normalcy (Xu et al., 2019). The response phase is the most significant of these stages since the most important step is to increase the chances of returning to normal life as soon as possible (Behl and Dutta, 2019). Without a well-thought-out crisis reaction, actions would be rushed, cooperation rates would be poor, resources would be wasted and the response would be ineffective. As a result, the goal of this study is to develop a mathematical model that can successfully respond to a crisis and coordinate relief efforts.
1.1 Literature review on relief distribution operations
Because several relief actions must be carried out simultaneously, the focus of studies in disaster management during the reaction phase varies. The majority of articles focus on location (Yilmaz and Kabak, 2016; Paul and Wang, 2019), allocation (Zahedi et al., 2020), or a combination of them with other relief operations (Chen et al., 2017; Ghasemi et al., 2019). In a deterministic environment, Khorsi et al. (2013) suggested a bi-objective mathematical model to tackle routing and allocation problems while considering costs and fair distribution. Another study by Abazari et al. (2021) used a mixed-integer nonlinear programming (MINLP) mathematical model to determine the location of distribution centers before a disaster and then convey relief items based on the results of the first model. They also examined the perishability of relief supplies. In an uncertain environment, Hu et al. (2016) proposed a bi-objective mathematical model, taking into account the demand and commodity distribution cost uncertainty and assuming that demand could not be met entirely. Haghi et al. (2017) developed a model to address location problems of treatment centers and DCs, relief goods allocation problems and injured routing issues. They considered demand and cost uncertainties in their study. In their location-allocation-routing problem, Shiripour and Mahdavi-Amiri (2019) pointed out that the quality of municipal infrastructure influences travel times and demand in each catastrophe area, making them uncertain. Haeri et al. (2020) investigated location-allocation and rescuing problems during predictable disasters. Despite disasters' predictability, their impact cannot be forecasted, and victims' demand cannot be measured and is uncertain. In their study, DCs' locations are determined before the disaster strikes to accelerate relief operations. Then, a bi-level mathematical model is designed to assist disaster victims. Molladavoodi et al. (2020) created a model to route relief supplies while considering DCs, charities, warehouses and shelters, as well as modeling uncertainty of demands and disaster severity rates. In another study, Ghasemi and Khalili-Damghani (2021) designed a multi-period multi-commodity uncertain location-allocation mathematical model that took into account roads' availability and demand uncertainty. In a three-level rescue network of casualty clusters, temporary facilities and general hospitals, Sun et al. (2021) suggested a bi-objective robust optimization model to locate facilities, assign emergency resources and transport casualties simultaneously. While incorporating demand, rescue supplies and transit time uncertainties, their model intended to minimize total expenditures and injury severity score.
Papers on this topic that use a mathematical model can also be classified according to their solution approach. These solution methods differ greatly. While some studies have focused on exact approaches (Khorsi et al., 2013), many have introduced a heuristic or meta-heuristic algorithm (Paul and Wang, 2019) to solve their designed model, particularly those involving multi-objective models, because most developed location-routing problems are considered NP-hard and an exact solution cannot yield an optimal solution in a reasonable amount of time. Some of these introduced meta-heuristic approaches are greedy-search-based multi-objective GA (Chang et al., 2014), multi-objective particle swarm optimization (Ghasemi et al., 2019), a hybrid genetic algorithm (Shavarani, 2019) and a shuffled frog leaping algorithm (Adarang et al., 2020).
1.2 Literature review on equity
Equity is a crucial notion in disaster response. Equity means victims in different disaster areas receive equal aid and relief products. Thus, an equal distribution of relief items considers the victims' feelings and executes the distribution efficiently. If demand nodes (DN) are not satisfied according to their severity rate, it might exacerbate the situation, leading to victims stealing supply. Even the likelihood of conflicts and wars increases (Zhang et al., 2020). Despite its significance, just a few research studies have looked into it in this way. Balcik et al. (2008) addressed the equitable distribution problem, claiming that equity should be prioritized when undertaking relief activities. Huang et al. (2012) addressed the vehicle routing problem during a disaster, and to ensure equity, they considered different service levels for DNs. According to Noyan et al. (2016), equity can be considered in both accessibility and relief item allocation; in accessibility, controlling the worst accessibility scores ensures equity, whereas, in relief item allocation, the weighted unsatisfied demand determines whether or not the allocation is equitable. Considering equity, Noyan and Kahveciŏglu (2018) introduced the last mile relief network design problem with resource reallocation. In an uncertain environment, Ferrer et al. (2018) developed a multi-criteria optimization model for the last-mile distribution of relief commodities. To address equity, they evaluated weighted unsatisfied demand. Zhang et al. (2020) published one of the most current articles on equity. They came up with a three-objective mathematical model that considered robust uncertainties and each DN's severity rate to make a fair relief network.
1.3 Literature review on DC selection
Determining the location of DCs, shelters and rescue centers is another crucial idea in the disaster response phase. The distance between these facilities and the DNs has a considerable impact on the effectiveness and efficiency of the distribution network. However, facilities' locations cannot be determined based on distance alone, and therefore, other factors need to be considered to improve the value of the located facilities. Alberto (2000) introduced seven criteria for selecting a facility location in industrial logistics: environmental factors, affordability, quality of life, local incentives, time reliability, response flexibility and customer integration. In another research, Ozcan et al. (2011) suggested stock holding capacity, unit price, the average distance to suppliers and movement flexibility as factors in warehouse selection. Roh et al. (2013) identified 29 factors divided into five categories: location, logistics, cost, national stability and cooperation in the humanitarian context. However, none of these studies considered the emergency that occurs during disaster relief efforts. To resolve this matter, Trivedi and Singh (2014) stated that when choosing a warehouse for humanitarian relief operations, considerations such as distance from disaster-prone areas, site safety, connectivity with road transport, road condition, building costs and telecommunication infrastructure should be addressed. In another study, He et al. (2017) proposed a decision model for emergency warehouse location based on a novel stochastic multiple-criteria decision analysis (MCDA) method, and other than the factors presented by Trivedi and Singh (2014), they considered traffic conditions, stock holding capacity and the surrounding environment as factors in determining warehouse location.
1.4 Literature review on information update
Because many disasters are unpredictable in terms of intensity and timing, the response plan must be implemented in an uncertain environment. Demand, severity rate, available resources, road conditions and other disaster-related factors can all contribute to this uncertainty. As relief operations must be carried out immediately, there is not enough time to gather more information about the situation to decrease the uncertainties. However, as additional information about the disaster becomes available, it will be necessary to update the relief operations plan to reflect the current situation (Chen et al., 2017). Articles in this field have considered this information and changed the relief operations plan in numerous ways. Lodree and Taskin (2009) built a Bayesian model to integrate supply reverse decisions. Ge (2012) incorporated the proportion of collapsed houses as information about the impacted areas in their Bayesian model, claiming that this variable could be observed several times and thus defined a sequence. Chen et al. (2015) used two-stage robust-stochastic programming and determined the resource allocation amount before and after gathering data. However, Zhu et al. (2019) claimed that algorithms generate all these update processes and data in most research are not based on actual data. Therefore, they used seismic damage from each affected area to update the earthquake intensity map for when earthquakes happen.
In studies like Hu et al. (2019), multi-stage stochastic programming (MSSP) has been used to address information updating. MSSP denotes a decision with potential repercussions. In another investigation, Abdelaziz and Masri (2005) coupled MSSP with fuzzy probability distributions. However, as Zahiri et al. (2017) remarked, both methods have flaws. First, MSSP probabilities are based on the decision-makers' subjective attitudes and, therefore, might not be realistic. Second, there is a potential that the calculated arcs' probability will be perturbed. As for the enhanced MSSP, there is a risk of surpassing and ignoring each probability distribution from its indicated interval, as well as providing a deterministic value for each scenario-dependent parameter. To address these shortcomings, Zahiri et al. (2017) developed a multi-stage possibilistic stochastic programming model (MSPSP), in which scenario-dependent parameters are random fuzzy variables and information is updated as we progress through each stage.
Despite their accuracy and usage, MSSP and MSPSP methods are complex and time-consuming. Therefore, in this study, information update has been considered in a much more simplified manner. In this paper, for each stage, a separate mathematical model has been built and executed, with the previous stage's results and newly obtained data as input data. Thus, it can be ensured that the proposed relief plan is efficient and practical (Xu et al., 2019). Xu et al. (2019) used a multi-stage model to solve rescue centers' location and rescue teams' routing problems in the same way; each stage was a separate mathematical model that determined which rescue centers needed to be established. The sole difference between each stage's model was that the rescue centers built previously should have been taken into consideration in the next stage's model. In another study, Li et al. (2020) designed a two-stage nonlinear mixed-integer mathematical model to distribute and route relief kits to those in need following a disaster. Distribution and routing are carried out in the first stage without enough information, while relief operations are dealt with in the second stage using the information collected in the first stage.
1.5 Research gap and current study's scope
Based on the reviewed literature, despite the vast number of articles on disaster management, there are many directions in this field that need further exploration. In the past, many researchers used to avoid applying multi-objective models because they believed they were harder to solve, and only in recent years have more multi-objective models been developed. Moreover, cross-operations models are limited because they are not computationally efficient. With the development of various novel optimization algorithms, solving larger models that consider multiple relief operations has become less time-consuming. Another research gap is that the main objectives of the reviewed articles are related to responsiveness and cost efficiency because they seem to be the primary concerns. Therefore, objective functions such as minimizing total time, distance cost and total unmet demand over time have been thoroughly investigated. However, this gives rise to other unexplored problems, such as oversupply and increased traffic, communication breakdowns and infrastructure damage. In recent years, a review of the literature on relief operations has revealed that equity has not been properly addressed; Most studies consider victims' satisfaction to model equity by minimizing the total unmet demand. However, in equity, DN's severity rate should be regarded as to plan an effective and fair distribution. Another concern is that performing disaster relief efforts only on the basis of preliminary information leads to high levels of uncertainty and shortages. Therefore, the relief operation will be ineffective and inconvenient. Despite this, the majority of articles have concentrated on single- or multi-period models that do not adjust plans based on the newly gathered information rather than multi-stage models.
Furthermore, despite their accuracy and ability to represent real-time situations, MSSP models and their developed versions are excessively sophisticated, making them less practical. As for uncertainties, despite the many pieces of research that have considered them, there are some key features for which uncertainty is not well explored, such as budget and road availability. Another research gap is regarding choosing the best location for DCs. The overall value of DCs is rarely addressed while locating them, even though this value has a substantial impact on the intended service network. If DCs' safety is not considered, a DC with a poor safety level may be chosen. If a secondary disaster hits, there is a high chance this DC will be destroyed, rendering it unable to respond to node needs, and resulting in a waste of money and resources.
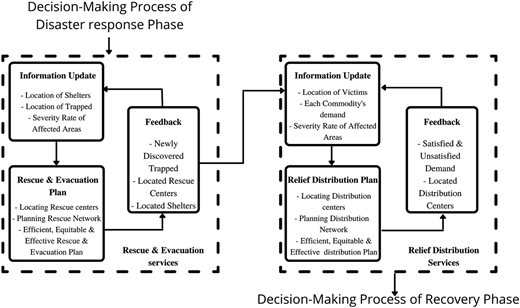
Xu et al. (2019) noted that disaster management and decision-making in any phase is a process that progresses by describing the problem, setting a goal, designing and selecting plans, implementing the plan and modifying feedback. These steps can be simplified as information collection, plan development and feedback. Figure 1 summarizes the disaster management response phase based on these steps. In this figure, the response phase is divided into two projects: rescue and evacuation plan and relief distribution among victims. The rescue and evacuation plan's results are sent for relief distribution planning. In relief distribution, information on victims' whereabouts and each area's severity rate is collected. Accordingly, the relief distribution plan is developed, determining the locations of DCs, met and unsatisfied demand, and the relief network. When no new victims are located, and the demand is completely satisfied, the cycle comes to an end, and decision-makers can move on to the recovery phase. In Section 2, this study looks at how mathematical modeling can be used to make plans for distributing relief goods.
This study presents a multi-objective, robust mixed-integer linear model to address disaster management's research gap. Two objective functions are considered to address equity and DC's overall values. The aim of equity's objective function is to minimize the unsatisfied demand while considering each DN's severity rate; the higher the severity rate, the more needs must be satisfied. The analytic hierarchy process (AHP) technique is used to create the DC's value objective function. This approach is used to weight a list of the most relevant elements of a DC that have a significant impact on its value for disaster operations, and their weighted sum is used to create the value objective function. As it is clear, we aim to maximize this objective. In this study, factors such as distance, capacity, safety, technological capabilities affecting communications, satisfied demand, open roads and costs are considered to calculate each DC's value. The third and last considered objective function is the total travel time, which must be minimized while considering the other two goals. A critical aspect of the proposed model is that the information collected at disaster sites is incorporated to decrease uncertainties over time and boost the results' reliability. To do this, the model is divided into separate stages, with each stage's inputs being the results of the previous stage plus newly collected data. In this model, DCs' location and distribution networks are chosen and designed for the given DNs in each stage; non-emergency demands of DNs and total budget are uncertain and part of an ellipsoidal set to consider a trade-off between worse- and best-case scenarios. After designing the model, it is solved using AUGMECON and a proposed hybrid algorithm of adaptive large neighborhood search (ALNS) and multi-dimensional local search (MDLS). This model is evaluated in a Sarpol Zahab, Iran case study. The arranged model's validity is verified through sensitivity analysis, which includes certain management insights.
Therefore, this study's contributions are as follows:
Developing a multi-objective, multi-commodity, multi-stage model to address the DC's location and disaster relief commodities distribution problems.
Simultaneously addressing equity, DCs' value and travel time objectives.
Addressing equity by considering the disaster severity rates at each DN to distribute relief goods according to the situation at each node.
Introducing an algorithm that is a mix of ALNS and MDLS and comparing its results with those of ALNS and AUGMECON to see if the hybrid algorithm gives better results.
Applying the proposed model to a real-world case study of an earthquake disaster.
The remainder of this paper is organized as follows: The proposed multi-objective mathematical model and its robust counterpart are presented in Section 2; solution approaches are presented in Section 3; Section 4 presents numerical results and checks the validity of the hybrid algorithm; A case study is then presented in Section 5 to demonstrate the model's effectiveness in practice; lastly, conclusions and future study recommendations are summarized in Section 6.
2. Model description and formulation
In this paper, a relief network including DNs and DCs is considered. This network is defined within the reported demand areas where rescued victims are waiting for relief supplies. The distribution plan begins when preliminary information on the situation is acquired. These preliminary data are inconclusive. However, as more people are rescued, the initial information is updated, the uncertainties decrease, and a new relief plan based on these data is required for the following stages. It takes around 7.5 h per area to update disaster information (Zhu et al., 2019). However, in most cases, due to a paucity of cars, the same transportation means and team must usually undertake these rescue missions for multiple areas. Consequently, the information update could take much longer than 7.5 h. So, instead of breaking up the first 72 h into smaller parts, this study looks at them in three 24-h stages.
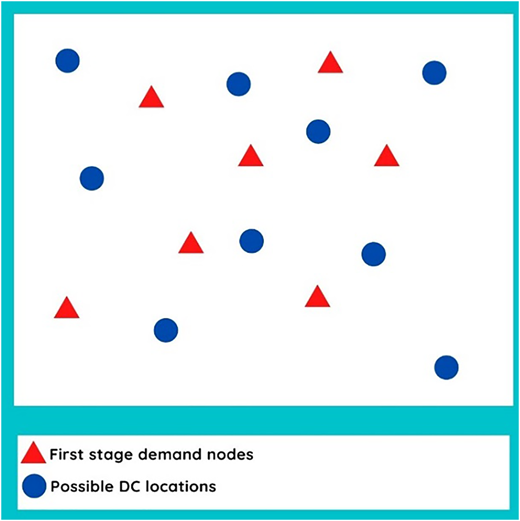
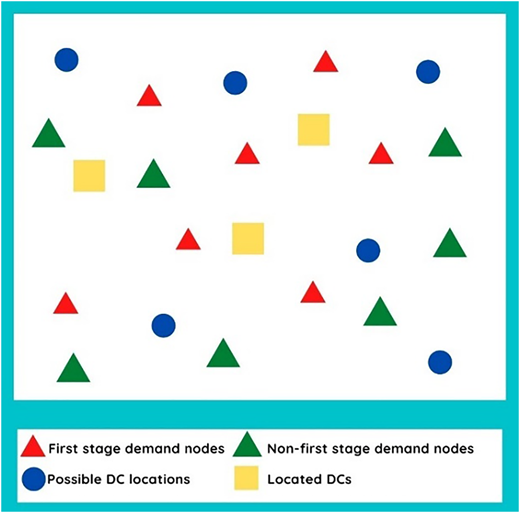
Furthermore, relief products are divided into emergency and non-emergency categories, with emergency supplies having to be fully met and non-emergency goods being distributed fairly. Figures 2 and 3 depict the overall structure of the proposed supply chain model. The blue circle in Figure 2 shows prospective DC locations, while the red triangle represents first-stage DNs. The green triangle in Figure 3 represents the DNs recorded in the non-first stage, while the yellow square represents the DCs found in previous stages. Commodities are sent from DCs to DNs in each stage, and vehicles are returned to DCs to prepare for the next stage. The model in this study consists of three 24-h stages (Xu et al., 2019), with the overall goal of planning for the first 72 h after a disaster, which are known as the “golden hours” because they are crucial in reducing disaster impacts. The designed model of this study attempts to improve the efficiency, effectiveness, value and equity of the relief distribution plan. Efficiency is modeled by minimizing the total travel time; efficacy and value are obtained through maximizing the value of DCs; equity is addressed through minimizing the weighted unsatisfied demand (Zhang et al., 2020) and time windows; if the condition of a DN is severe, its time window is tighter, indicating that it should be visited first.
2.1 Assumptions
The model's assumptions are as follows:
DCs' capacities are limited. Therefore, the allotted vehicles' capacities and DNs' demand must be less than or equal to this capacity.
Nodes with greater crisis severity rates are prioritized for non-emergency goods under DNs circumstances.
Non-emergency relief goods' demand and the available budget are uncertain.
Emergency relief goods' demand must be met, and each DN must be allocated to precisely one DC.
There is no need to employ all vehicles.
Vehicles' speeds are consistent across the network.
All possible paths between two nodes and their travel times are considered using road map application.
2.2 Notations
The model's notations are listed below:
2.3 The analytic hierarchy process (AHP) method
The AHP method organizes and analyzes complex decisions. This method, first developed by Saaty (1980), consists of at least three sections (Russo and Camanho, 2015): The ultimate goal, all viable alternatives, and the criteria used to evaluate these alternatives. AHP assists decision-makers in weighing the pros and drawbacks of a condition and making an informed decision. This strategy examines the importance of components and sub-factors first, then assigns a weight to them. After defining the weights, the choices are evaluated, and the most valuable option is chosen. A benefit function is created to compare the options, which is the weighted sum of the factors' values; the option with the highest benefit function is deemed the best option. After that, the other alternatives are ranked in descending order. In this study, the most critical factors of a DC's location are weighted using AHP, and then an objective function is built based on them to determine each DC's worth. This objective function guarantees that DCs with a higher overall value are chosen. The factors considered in this paper are shown in Table 1 and are based on this field's literature (Trivedi and Singh, 2014; He et al., 2017; Kim et al., 2019).
A questionnaire was completed by twelve professionals in disaster and transportation management to weigh the factors. Pair-wise comparisons were undertaken using the questionnaires; participants were required to compare the aspects using the scale indicated in Table 2.
In this study, the final weights were calculated through the online tool BPMSG, provided by Goepel (2018). The questionnaires' results were first uploaded, and their scientific validity was verified. If a questionnaire's validity rate was below 0.7, it was eliminated due to invalidity. The pair-wise comparisons' results were then utilized to compute each factor's final weight. Absolute weights are given in Table 3.
A benefit function was introduced after calculating weights. To form this function, first whether the factors add value or not should be determined. The further away a DC is from afflicted areas, the longer it takes to send goods to them, which is undesirable for decision-makers. The capacity of a DC indicates how much goods it can hold. Therefore, the bigger the capacity, the more victims the DC can assist. The satisfied demand for non-emergency commodities follows the same rationale. In terms of safety, given the possibility of subsequent disasters, it is preferable to choose DCs with a higher safety rating so that they do not collapse and waste relief supplies. The quantity of roads determines a DC's capability to aid people when some roads are closed due to a disaster (for example, the collapsed constructions). Technological capacity is the factor that impacts a DC's communication with other network components. So, the more developed it is, the easier it is to make contact and receive updated disaster information. Lastly, the cost is one of the factors decision-makers aim to reduce to save finance for the uncertain aftermaths of disasters and other relief operations. Therefore, among the factors, distance and cost are the only two that do not add value and, accordingly, should be deducted from the others. However, normalization is required since each element has a different scale. Equation (2) was used to normalize the benefit function where is one of the alternative's factor i value, and are the minimum and maximum amount of factor i and is that factor's weight. Hence, benefit function (1) changes to (3).
2.4 The mathematical model
The designed model is as below:
The first objective function (4) seeks to maximize DC's overall value. This objective function is the sum of all the alternatives' benefit functions. Therefore, the whole value is multiplied by , which determines whether or not the DC has been constructed.
The second objective function (5) addresses equity by minimizing the weighted sum of unmet non-emergency commodities' demand, with the weights being the severity rates of each DN. Through this objective function, the DNs in the direst situations are met first, and their demands are satisfied.
The third objective function (6) minimizes total travel time, which is an essential aspect of any relief operations plan. It should be noted that this study requires these three objective functions because of their inconsistent behavior and differences in nature. The impacts of these objective functions on the relief plan are substantial separately. By considering them as one objective (for example, by modeling equity and time as costs and viewing them in the DC value objective function), we will not be able to identify their influence and trade-off.
As demonstrated by constraint (7), any vehicle that enters a node in a relief network must leave when its mission is completed.
Each DN is assumed to receive service from only one DC and vehicle in this study. This assumption is expressed in constraint (8).
Through constraint (9), each vehicle is assigned to at most one DC. This constraint also demonstrates that we do not need to allocate all vehicles to DC and use them.
DNs can receive goods from a vehicle when assigned to a DC chosen for relief goods distribution. Therefore, constraints (10) and (11) are introduced into the model.
It is clear that a road can only be traversed if it is available. Therefore, to incorporate this logic into our model, constraint (12) is introduced.
Vehicles and DCs can meet the demand to the extent that their capacity allows. Therefore, the demand of allocated DNs should not exceed this limitation shown through constraints (13)–(15).
Non-emergency commodities' demand of a node consists of both satisfied and unsatisfied demand, issued under constraint (16). However, at least 30% of each node's nominal demand must be met as stated in constraint (17); without this constraint, in cases where non-emergency commodity inventory is small, only the most severe nodes are served, which is unfair.
Constraint (18) ensures that a node will not receive goods from a vehicle if it is not assigned to it.
Time window limits and arrival times are indicated in constraints (19)–(24). For example, in constraints (19) and (20), if node i is served after node j by vehicle v, these two constraints equal each other.
Because each stage lasts no more than 24 h, constraints (25) and (26) ensure that DNs are met before the upper bound of their time window and vehicles are returned to DCs before 24 h.
To make sure that the number of located DCs does not exceed the limitations, constraint (27) is issued. Also, by constraint (28), the total cost cannot exceed the available budget.
Lastly, constraint (29) determines binary and positive variables.
Note that the other stages are also modeled the same way, except that the number of located DCs in the preceding stage must be 1.
2.5 Robust optimization
When a disaster strikes, we cannot predict its exact severity rate. In other words, we cannot estimate the precise value of a disaster's fundamental aspects (Sun et al., 2022). Stochastic optimization (Dantzig, 1955) is a well-known way of dealing with these uncertainties. This optimization method assumes that each uncertainty has a probabilistic description and models uncertainties based on the parameters' statistical distributions. However, as stated by Sun et al. (2022), estimating the probability distribution of uncertain variables is difficult due to the emergency nature of disasters and inadequate historical data.
Moreover, even if we do estimate the probability distributions with this limited data, it may not be suitable for the real world (Sun et al., 2022). The robust optimization method, first introduced by Soyster (1973), is a more recent and widely used approach that assumes the parameters' uncertainty is not stochastic but deterministic and set-based (Bertsimas et al., 2011). It considers uncertain variables as interval values around a nominal value because predicting these interval values is significantly easier than estimating point values and their probability, owing to a lack of data (Sun et al., 2022). Therefore, in robust optimization, the decision-maker constructs a feasible solution for each uncertainty realization in a given set (Bertsimas et al., 2011; Ordóñez, 2014). Consequently, since robust optimization is flexible and computationally tractable, and uncertainty sets are appropriate for parameters' uncertainty, uncertainties have been modeled using robust optimization in this study. Soyster (1973) hypothesized that if the model is feasible when uncertain parameters are at their worst, it is also feasible in reality and can accurately model it. However, the chance of parameters being in their worst state simultaneously is nearly nil. Therefore, numerous researchers addressed this issue to increase the RO model's and reality's conformity by investigating different uncertainty sets. Uncertainty sets affect whether we can efficiently model a robust problem and choosing a too large uncertainty set leads to conservative robust solutions. Consequently, the yielded solutions and the robust optimization lose their quality and the advantage over non-robust optimization. In other words, uncertainty sets assure tractability and give decision-makers freedom in deciding on a trade-off between robustness and performance and determining the corresponding level of probabilistic protection. Ben-Tal and Nemirovski (2000) conducted one study on the subject. Their research assumed that the uncertain data has an ellipsoidal set formation. Ellipsoidal sets have a conservative level that is neither too low nor too high, and consequently, the model's robust counterpart can accurately mimic reality. The conservative rate for the ellipsoidal set is lower because it is based on the idea that all parameters cannot be in their worst, average, or normal state at the same time.
Consider is an uncertain parameter in the range where is the nominal value of the parameter and is the perturbation vector. Consider the following uncertainty vector, which is defined by an ellipsoidal uncertainty set:
where is a safety rate controlling the uncertainty covered by the solution and is chosen by decision-makers depending on the risk level they seek; the greater this parameter, the lower the risk level. The uncertain parameter can then be rewritten as . Now, considering the ellipsoidal uncertainty set, the robust counterpart of constraints containing uncertainties based on Ben-Tal and Nemirovski (2000) and applying Karush-Kuhn-Tucker conditions is shown as follows:
The same approach can be conducted when the right-hand side parameter is uncertain. It can be assumed that the right-hand parameter is the coefficient of a variable that always equals 1 (. Then the robust counterpart of the constraint can be written as,
And since :
2.6 Practical considerations
Budget constraints, accessible commodities, potential uncertainties and building an equitable, efficient and effective assistance network are all challenges in a humanitarian relief chain. These issues should be evaluated alongside characteristics of real-world problems (Aghajani and Torabi, 2020), such as capacity limitations, severity rate and priority of demand areas and response time limitations. The designed multi-stage mixed-integer mathematical model deals with these challenges and features to make it feasible for real-world disasters. Since the proposed model tries to satisfy three objective functions simultaneously, a set of Pareto solutions is obtained. Each considers a different level of trade-off between objective functions, allowing decision-makers to use the solution that best suits their needs in real-world scenarios. However, despite the widespread use of operations research tools, most decision-makers are not skilled in dealing with this mathematical model. In this situation, as Aghajani and Torabi (2020) stated, the designed model can be embedded within a software. This way, managers can link the software to the resource database, input the needed information through the constructed user interface, and then update the input data based on the information collected in each stage to adjust the relief plan.
3. Solution approach
Solving multi-objective models necessitates approaches that examine all objectives simultaneously. In this paper, AUGMECON is utilized as an exact approach to solve minor or medium-sized problems, determined based on DNs. Also, suppose the decision-makers come across a more significant issue since the model is NP-hard and the exact approach cannot find an effective solution in a reasonable time, a hybrid algorithm, ALNSxMDLS, is presented. In Section 4, the validity and functionality of this approach are compared to the exact solution and the ALNS algorithm.
3.1 Augmented Epsilon Constraint
The Epsilon constraint method was first introduced by Yv et al. (1971). In this strategy, to optimize the model, one of the objectives is chosen to be optimized. The other objectives are treated as constraints with an upper or lower bound of for minimization or maximization objectives, respectively. Then, a set of Pareto solutions is created based on constraints. However, these Pareto solutions are frequently ineffective, and there is no guarantee that they are efficient. Therefore, Mavrotas (2009) proposed AUGMECON to compensate for epsilon constraint deficiencies.
In this method, first their lexicographic optimization obtains the payoff table of other objective functions. Then, the lower and upper bounds of objective functions are determined, and based on them, the range () of objective functions is calculated as follows,
where and are the maximum and minimum values of the kth objective function, respectively. In the next step, these ranges are divided into p equal intervals. Therefore, for the lth grid point is calculated as,
The multi-objective model is then changed into a single objective model as,
s.t.
where is the surplus variable, and a weighted sum of them is added to the objective function, is the value of the kth objective function, and is a small number between [10–6,10–3]. Lastly, the model is solved by different to yield Pareto solutions. It should also be noted that this method avoids too many iterations by stopping the algorithm when an infeasible solution is found, which decreases computation time.
3.2 ALNSxMDLS algorithm
MDLS was first presented by Tricoire (2012) to solve multi-objective problems. This solution is a generalized version of the stochastic local search (SLS) submitted by Hoos and Stützle (2005). MDLS generates a set of Pareto solutions, one of which is chosen in each iteration, and a local search is carried out on one of the objective functions. If all the Pareto solutions in the set do not defeat the answer, it is considered one of the Pareto solutions. ALNS was first presented by Ropke and Pisinger (2006) to solve pickup and delivery vehicle routing problems. This algorithm is a generalization of LNS, introduced by Shaw (1997). ALNS explores the initial solution's neighborhood with a set of destroy and repair operators attempting to improve the solution. Therefore, each operator's weight is assigned to reflect its success rate in previous iterations. In each iteration, one repair () and one destroy () approach are chosen according to their weights, and then part of the solution is eliminated by one destroy operator; then it is inserted again through the repair operator.
According to Eshtehadi et al. (2017), ALNSxMDLS performs like ALNS except that each objective function has a set of destroy and repair operators, and in each iteration, one pair from each group is selected to improve the solution randomly chosen from the Pareto set. If the new solution each pair yields is accepted, it is then added to the Pareto set. Like in ALNS, destroy and repair approaches' weights are modified after iterations to reflect their success rate. All operators have the same initial weight of 1. Each operator's selection probability is affected by weight adjustment and calculated as equation (41).
where is the weight of the ith repair or destroy operator.
To adjust the weights, first the number of times h was used in iterations is computed and displayed as . In each iteration, h's success rate, increases as much as where is as follows:
: The new solution is a Pareto solution, dominating at least one other Pareto solution.
: The new solution is a Pareto solution, is not dominated by any Pareto solution, and does not dominate any other Pareto solution.
: The new solution is not a Pareto solution, dominated by all Pareto solutions.
Operator h's weight is determined as follows:
In this equation, is the reflection factor, determining the importance of the operator's success in current and previous iterations. Generally, a number between 0 and 1 is assigned to to consider these successes, and the closer it gets to 1, the more it depends on current successes.
In this study, DCs are situated based on their distance from more severe nodes to generate the initial solution. When the first DC is located, a vehicle with a lower capacity than the DC is assigned. The distribution process then begins. In this step, first, more severe DNs are served so as not to violate their time window constraint. The vehicle returns to the DC once its inventory is completely depleted. If the DC has available stock, another vehicle is assigned to satisfy demand. If there is no available resource, a new DC is located to serve DNs. These steps are repeated until all DNs are met. It should be emphasized that the achieved initial solution is practical because each step considers capacity and time window restrictions.
3.2.1 Destroy operators
Objective functions' destroy operators are as:
The value objective's destroy operator: The DC with the lowest capacity, the lowest growth in value, or just randomly is destroyed in this algorithm. When a DC is destroyed, all DNs assigned to it are destroyed too.
The equity objective's destroy operator: For this objective function, DNs are destroyed at random or based on which ones have the most unmet demand.
The travel time objective's destroy operator: For this objective function, DNs are destroyed either randomly or based on the most increase they cause in travel time, which is the combination of the time it takes to reach those DNs and the time it takes to reach the subsequent node.
Since we cannot destroy DCs located in previous stages in stages two and three, destruction is based on new DCs situated in that stage. The current solution goes through the repair operation without changes if no new DC is located.
3.2.2 Repair operators
Objective functions' repair operators are as follows:
Value objective's repair operator: Repair operators considered in this study for the value objective are as below:
DNs are randomly assigned to DCs and vehicles. If these DCs and vehicles are unable to satisfy all DNs' demands, a new DC should be added at random to distribute goods to unmet DNs.
DNs are first randomly inserted into the model, and then, to satisfy the demand of unmet nodes, a DC with the highest value is located.
DNs are assigned to DCs that can satisfy more non-emergency demands. If unmet nodes remain, a new random DC is established.
DNs are assigned to DCs that can satisfy more non-emergency demands. Then, if an unmet DN remains, a DC that leads to the highest increase in value is chosen.
Equity objective's repair operator: In this objective function, considered repair operators are as below:
Same as the first repair operator of the value objective.
DNs are randomly assigned to available DCs. If an unassigned node remains, the DC with the highest non-emergency commodity capacity is located.
DNs are assigned to DCs that lead to the lowest weighted unmet demand for non-emergency commodities. Then, if a node remains unmet, a new DC is randomly located.
DNs are assigned to DCs that lead to the lowest weighted unmet demand for non-emergency commodities. A new DC with the highest non-emergency goods capacity is located if a node remains unmet.
Travel time objective's repair operator: Two repair operators are introduced for this objective function. In both operators, in the end, for iterations, adjacent nodes' travel times are compared; if changing their location with each other leads to a lower travel time, their location is changed. This means that first, the second node is served and then the first one.
DNs are randomly assigned to DCs. A new random DC must be located if any node remains unmet.
DNs are inserted in locations where the increase in travel time is the lowest. If an unmet DN remains, a new DC is located based on its distance from the remaining nodes. The DC that has the overall lower distance value is chosen and located.
In all introduced repair operators, if a DN with a severe condition is inserted into a relief distribution network and its non-emergency demand cannot be totally satisfied, commodities assigned to nodes with the lowest severity that exceed the 30% demand limitation should be taken to fulfill this node's demand.
3.2.3 Feasibility verification
Based on the constraints of this model, the solution's feasibility should be verified in two aspects: capacity and time window constraints. Since the insertion operation is repeated multiple times until no unmet DN is left, a quick verification procedure must be designed to speed up the hybrid algorithm. Because all repair operators consider capacity constraints when inserting a DN into the solution, feasibility should be checked only for time window constraints. These constraints are more complicated, and if they are violated, other violations may occur. Hence, the approach outlined by Hà et al. (2020) is proposed in this study. The maximum delay allowed at each arc of the current solution is pre-computed in this approach without exceeding the time window constraint. In a partial solution, to consider all possible positions to insert an unmet DN, the maximum delay, which is the time that can be spared after a vehicle serves DN k and before it starts serving DN l, is calculated through a linear programming model (Hà et al., 2020). This model maximizes the weighted maximum delay between two DNs while meeting all DNs' time window constraints. The second DN is served after the first one, considering maximum delays. Each time the model is optimized, the intended arc's weight is set to 1 and the weight of the others to 0. When this delay on an arc is calculated, whether an unmet DN can be inserted in that arc should be checked. First, the arrival time at the unmet DN must be calculated and made sure it does not violate its time window constraint. Then, the feasibility of this insertion needs to be examined; the difference between the time it takes to go from DN i to the inserted node plus the time it takes to go from the inserted node to node j and the time it takes to go from i to j must be less than the maximum delay or equal to it.
3.2.4 Tuning parameters
Adjusting a solution approach's parameters improves its effectiveness. To tune ALNSxMDLS's parameters, Taguchi's method and Minitab software were used in this study. Many researchers have described this strategy in detail (Shavarani and Vizvari, 2018; Abazari et al., 2021). For ALNSxMDLS in this study, six parameters, number of iterations (), number of nodes destroyed in destroy operators (), reflective factor () and operators' scores , and previously described, are tuned to 2000, 4, 0.5, 0.2, 0.5 and 1.5, respectively.
4. The numerical results
To test the model's validity, seven different examples are solved by the solution approaches, and then the results are compared to determine which algorithm works better. These examples are divided into two groups based on the number of DNs, and the location of these DNs is according to different cities in Iran. Medium and large groups contain three and four examples each, where the number of DNs is between [10,50] and [60,200], respectively. It should be noted that the number of DNs for each instance is generated at random within the given ranges. This number is the number of DNs in the final stage, determining which group the example belongs to. The number of nodes found in the non-last stages is between zero and the remaining nodes. The demand of each node is randomly generated and is between [100,1000] commodities per product type. The number of potential DCs, the upper bound of DCs that can be located, and the number of available vehicles are generated based on Noyan et al. (2016). The capacities of DCs and vehicles are random numbers based on the unanticipated demand of disaster nodes; the capacity of DCs is generated between the nodes' lowest demand and the sum of the demands per product type. The vehicle capacity must be lower than the highest developed capacity of DCs and more than the most insufficient demand of nodes so that examples remain feasible. Travel time between two network nodes is estimated depending on their distance and is in the range of [0,2] hours, as even in Iran's largest cities, travel times are rarely greater than two hours. Lastly, in all instances, the three shortest paths between two nodes are considered, with each path's availability being either 1 or 0.
4.1 The robust Solution's reliability
Before solving the examples, the robust solution's reliability must be weighed against the price of robustness. For the examples in this study, a robust instance for various values of Ω is designed. When the matters of and are generated, the algorithm is applied to get a robust solution. As with Caserta and Voß's (2019) procedure, 1,000 uncertainty vector realizations are randomly generated when a robust solution is obtained. Uncertain parameter values have equal probabilities. Then, the viability of the obtained solution is assessed. The results obtained on problem M3's first stage are presented in Table 4. In this table, the first column is dedicated to's value determining how conservative the robust solution is; the second column represents the best value of objective functions; the average price of robustness is presented in the third column, and for each objective function, it is calculated as equation (43).
where is the value of the objective function i when equals 0. Lastly, in the fourth and fifth columns, infeasibility percentage and theoretical probability of failure, which equals , are presented.
Based on the table, when , where uncertain parameters equal their nominal values, in 98% of realizations, the obtained solution is not feasible. As the increases, the instance's feasibility rate and the price of robustness grow, and the objective function's value falls. When equals 3.2, the reliability exceeds 99%, but the price of robustness is 5.5%, implying that the obtained solution is on average 5.5% worse than the nominal solution. Further increasing increases the feasibility percentage, but the price grows too. Therefore, it is best to fix at 3.2.
4.2 Comparing solution approaches
After examining the robust solution's reliability, these seven problems were solved by AUGMECON using Cplex software on a PC with 16 GB of RAM, a Corei7 CPU and 2.21GHZ. As the number of DNs increases, the computation time increases to the extent that, in some instances with more than 70 DNs, AUGMECON cannot find the optimal solution within the 3 h limitation of Cplex. This is while a solution must be generated quickly due to the emergency nature of disaster relief operations. Hence, meta-heuristic algorithms were used to solve these problems to reach a resolution in less time. The results in Tables 5 and 6 demonstrated that in medium problems, both ALNS and ALNSxMDLS could obtain the optimal solution in all examples faster than AUGMECON. This means that the hybrid local search algorithm can yield reasonable global solutions promptly. In large instances like problem L2, AUGMECON fails to find the optimal solution within the time limit, and in some others, this approach fails to obtain any solution at all. In these instances, the two meta-heuristic algorithms are compared based on their best-known solution (BKS). According to the results, in all examples, ALNSxMDLS yields better solutions than ALNS. Therefore, the BKS of L2 to L4 is the results obtained from ALNSxMDLS, shown in italic form in Table 6. Hence, we can posit that ALNSxMDLS solutions are closer to the optimal solution. One crucial point is that, in more significant instances, if the number of DNs in the first stage is low, ALNS can either acquire the BKS or a similar result. Therefore, the second and third stages have a smaller gap as well. In contrast, if the number of DNs in the first stage is large, the gap widens, resulting in a larger gap in the non-first stages.
The hybrid algorithm is compared to ALNS based on its performance indicator to determine its effectiveness and practicality. The performance indicators in this study are medium ideal distance (MID), the number of Pareto solutions (NPS), diversity metric (DM) and total computation time. MID figures out how far Pareto solutions are from the ideal point at the center of the coordinate system. NPS determines how many Pareto solutions there are. DM calculates how many non-dominant solutions there are in the Pareto set.
According to Table 7, in all instances, ALNSxMDLS yields an answer in a longer time than the ALNS because, in each iteration, three sets of destroy and repair operators are used to obtain Pareto solutions. This time is, however, substantially shorter than the exact procedure. Overall, based on MID, NPS, and DM, ALNSxMDLS performs better and is more effective.
5. Case study
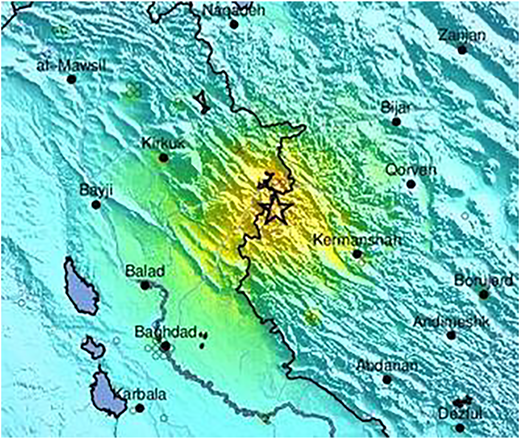
On November 12th, 2017, an earthquake with a moment magnitude of 7.3 struck Iran and Iraq's borderline. This earthquake occurred within a 5 km distance of Ezgeleh, a city in Kermanshah, between Ghasr-Shirin and Sarpol Zahab cities. It destroyed a large portion of Sarpol Zahab and other Kermanshah towns, resulting in more than 700 deaths, 9,000 injuries, and 70,000 displaced people. In this study, Sarpol Zahab is taken as the case study. This city has an estimated population of 85,342 people and covers an area of 1,271 km2. Based on Figure 4, which depicts this earthquake's severity, Sarpol Zahab falls into the yellow zone, which means the quake hit very strongly.
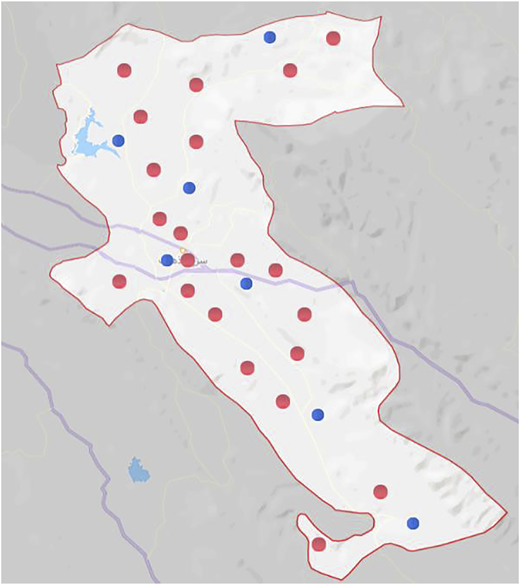
As seen in Figure 5, the Sarpol Zahab city map, twenty-one DNs (red dots) and seven potential DCs (blue dots) are considered in this study. These seven potential DC locations are chosen among schools, universities, gyms and charities. Based on its location and structure, each area has different safety, technological capabilities and capacity estimates. The 21 DNs are facilities where victims are located after being rescued.
The “Balad” application, containing Iran's road maps, is used to estimate the travel time of all possible routes between two points. DNs' condition severity rate is determined by their distance from the epicenter and the surrounding environment. The severity rate of DNs is used to determine the upper bound of the relief operation time window. If a node's severity rate is high, the upper bound must be low in order for it to be prioritized and met before nodes with better conditions. Total demand is estimated to be around 40,000 per item. Lastly, the uncertainty rates for non-emergency demand are thought to be 10, 5 and 2%, respectively, in the first, second and third stages.
5.1 Computation results
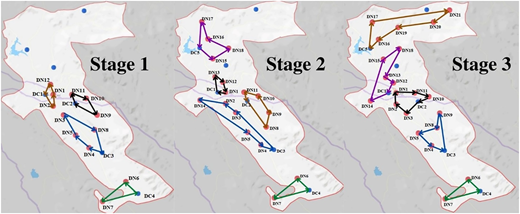
In the first stage, since the earthquake has just occurred and the rescue of the victims is in progress, four DCs are chosen for relief goods distribution: DCs 1, 2, 3 and 4. At this stage, because all possible roads between network nodes are considered, despite the unavailability of the shortest path between DC1 and DN2, another route is taken to reach this DN. Travel time would have increased greatly if the second option had not been considered. Furthermore, since the available non-emergency goods resources are limited, not all nodes' demands are addressed; for example, the needs of DN7 assigned to DC4, which has a lower severity rate, are not fulfilled completely. In stage two, two new earthquakes with moment magnitudes of 4.3 and 4.7 happened, resulting in the discovery of six new DNs. Because the four DCs located in the previous stage were unable to meet the demands of all nodes, a new DC must be used. Thus, DC6 is open to distribute goods. In the last stage, three new DNs are found. The previous five DCs are used in this stage because a new DC cannot be located due to the total number of DCs limit. In stages two and three, the distribution is not 100% fair because the non-emergency relief commodities' demand is not fully met. However, this unmet demand is much less in the last stage since all DNs' demand is low.
It should be noted that an analysis of the budget and total cost of these stages revealed that the allotted budget is much more than required. Thus, the management could use the extra fund to further disaster relief efforts or rehabilitation efforts following the disaster. The results also show that the majority of DCs are located outside of the metropolitan cities, near smaller settlements. These DCs have a larger capacity and are safer, especially since fewer buildings are around them to collapse and affect them. Therefore, this knowledge helps managers to pay more attention to these probable DC locations in the pre-disaster phase and build more reliable DC constructions and roads to pace the distribution operation in times of disaster.
The results indicate that the proposed mathematical model's results are reliable, and managers can use them during disasters. The three objective functions can be modified depending on the scenario, allowing decision-makers to design and implement a solution that prioritizes their most important objective function. Furthermore, since the distribution process is based on the latest information, rescued people are located at specific spots (like shelters) in each area, reducing the time it takes to aid them and assisting managers in planning a timely relief distribution operation.
5.2 Sensitivity analysis and managerial insight
Sensitivity analysis is the process of determining how sensitive the designed model is to changing a parameter. This sensitivity analysis is done by changing this study's uncertainty level and satisfying the non-emergency demand percentage.
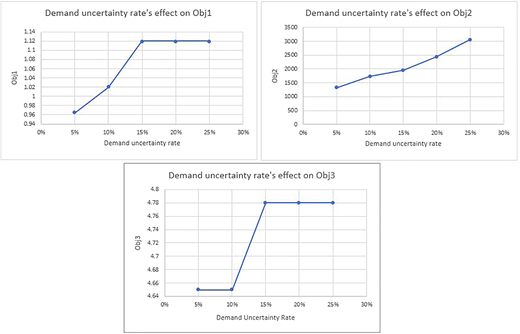
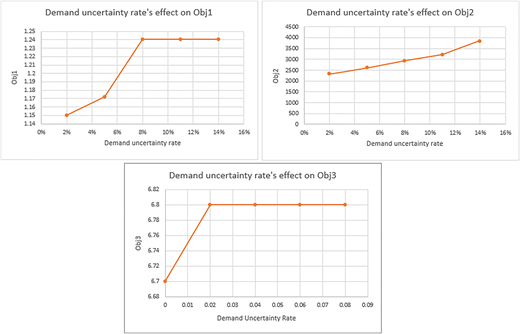
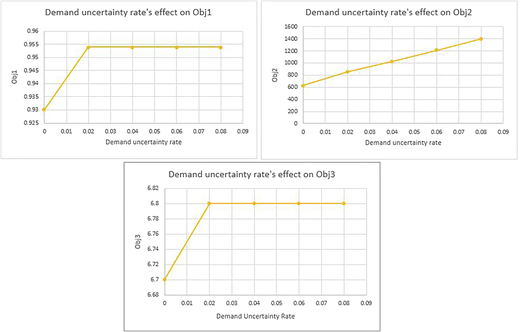
The model's sensitivity to demand uncertainty levels is analyzed using the levels in Table 9.
Results in Figures 7–9 show that as the uncertainty level rises, the second objective increases in all stages because the additional demand cannot be met even by locating a new DC. However, until 15, 8 and 2 uncertainty levels of stages one, two and three, respectively, the model tries to respond to demand by increasing travel times; DCs that are further from a DN send goods there. After these levels, the model cannot respond to demands even by increasing travel time because the inventory is lower, or increasing travel time is not practical. The first objective function increases until the specified uncertainty levels. This objective function does not change after that because the amount of satisfied demand remains constant.
Managers must determine the ideal uncertainty level, especially during stage one. If the chosen level is too high, more non-emergency commodities will be prepared. If the disaster's severity rate is lower than expected, the number of extra resources will rise. According to Stauffer and Kumar (2021), these excess commodities are mainly disposed of or returned to the central warehouse. Because returning them raises the total cost, these items are frequently disposed of locally, either in landfills or through local distribution. Either way, they cannot be used in subsequent operations. Contrarily, if the chosen level is lower than the actual situation, there will be insufficient relief goods to meet demand, resulting in victim discontent, a decreased equity rate, and inescapable mental and physical health consequences. Therefore, demand should be estimated at a safe level that avoids shortages or waste.
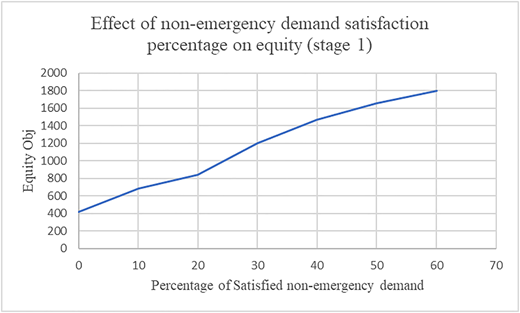
The designed model's constraint (17) was incorporated to ensure that each DN receives at least 30% of its nominal non-emergency demand. The equity objective function's sensitivity to this constraint is calculated at seven different percentage levels. When it is set to 0%, the equity objective function is lowest because, as much as the inventory allows, severe DNs are met first, and since their weight is greater, more weighted demand is satisfied. Non-severe DNs, on the other hand, are not met, making the intended procedure inequitable. The equity function is at its highest value when this percentage equals 60; more demand in lower priority areas and less demand in higher priority areas is satisfied, which is again not equitable. Increasing this amount further makes the model unsustainable due to inventory shortages. Accordingly, managers should consider a trade-off between DNs and determine this percentage based on their description of equity (see Figure 10).
One of this study's assumptions was that DCs located in stage one are used for stages two and three, and if more commodities are needed, more DCs are opened in non-first stages in addition to them. When comparing the results of this model to a model in which managers can choose alternative DCs in each stage, it is clear that the proposed model's assumption lowers the cost but increases total trip time because DCs in stage one were chosen only on the basis of that stage's DNs. Therefore, when the newly discovered DNs are further away, travel time increases. However, locating DCs based on each stage's DNs significantly increases the total cost; because, in addition to the costs of locating new DCs, the surplus inventory of DCs located in the previous stage must be sent to the next stage's DCs to be distributed again, which causes additional costs. Also, transporting commodities back and forth can cause deterioration, resulting in the relief products being squandered. Therefore, managers should decide whether responding sooner or expenses are the priority; if the disaster is severe and enough budget is available, DCs should be located based on each stage's DNs; if the crisis is not too intense or the available funding is insufficient, DCs that were previously opened should be used in the subsequent stages as well.
6. Conclusion
In this study, a robust mixed-integer linear programming model was designed to address the distribution problem during a disaster to increase equity and DCs' value while decreasing travel times, as the number of disasters occurring each year and their impacts have grown over the last decade. In addition, the available budget and non-emergency commodity demand were considered uncertain under an ellipsoidal set. The proposed model can help decision-makers plan a fair, timely and valuable relief network system by considering these aspects and ensuring relief commodities are distributed fairly. To examine its validity, this model was also applied to a case study, the Sarpol Zahab earthquake of 2017. The findings indicated that this model could provide practical solutions.
The designed model was solved using AUGMECON and ALNSxMDLS. According to the results, in most cases where DNs are fewer than 70, the exact approach AUGMECON can attain the optimum answer. However, as the number of DNs increases, it cannot yield this solution within the time limitations. Therefore, the introduced meta-heuristic algorithm was utilized to obtain answers in a shorter time. When the results and performance of this algorithm and ALNS were compared, it was clear that ALNSxMDLS produced better results, while ALNS obtained solutions faster.
For future studies, some avenues need to be explored; in our case study, gathering information on each DN was done using road vehicles, and therefore, each inspection took almost 7.5 h, which is a lot in times of emergency. In future studies, it is suggested to use drones to collect this information to reduce its time and, subsequently, consider more stages that last less than 24 h, allowing the emergency distribution plan to be carried out more effectively. Moreover, our study assumed that all vehicles have the same equipment. However, medical commodities such as medications and blood require unique settings to minimize spoilage. Therefore, future studies should incorporate these vehicles with the risk of perishability into the mathematical model. In this study, the travel time objective aimed to lower the total travel time. Future studies can assume that the longest travel time must be minimized and analyze how this objective function influences the distribution network.