


This study, a practice forum article, aims to presents the lessons learned and the development of a discrete event simulation model to support the funerary system management of São Paulo City, Brazil, during the COVID-19 pandemic.
A discrete event simulation model was developed by the authors as soon as the pandemic affected the city of São Paulo, Brazil. Based on the model, several scenarios with varying minimum, median and peak demands (i.e. the number of deaths) were tested and evaluated. The lessons learned from the scenario analysis and implementation of the decision-making of the city government of São Paulo are discussed in this article.
The lessons learned about the coordination, inventory management and other operational characteristics in funerary logistics during the pandemic are shared with a model, which quantifies the demand for vehicles, coffins, graves and teams in the cemeteries in different simulated scenarios.
The São Paulo State Civil Defense used this information during the pandemic to prepare the funerary system of the municipality.
The study presents methods to mitigate the sanitary, environmental and psychosocial problems related to the funerary system.
Studies on funerary systems are scarce. This study presents the results that supported the dimensioning of the funerary system during the pandemic and operational lessons about the logistics to support decision-making in future events.
Plain language summary
We share the lessons learned and quantify the logistical resources for operating a funeral system during the COVID-19 pandemic through a simulation of scenarios by discrete events.
Introduction
In 2020, humanity faced the global health crisis of COVID-19, which was caused by the severe acute respiratory syndrome coronavirus 2 (SARS-CoV-2) (Brasil, 2020). The focus of the problem was on medical science, especially epidemiology and virology. However, the disease was not only a medical issue; various socioeconomic, psychosocial, governance and technological implications emerged. Other issues linked to the pandemic require a more comprehensive discussion, such as public management and decision-making related to the risks in the pandemic (Zhang and Shaw, 2020).
Among the effects of the pandemic were health, sanitary and psychosocial problems. News from different locations presented difficulties in the management of funerary and burial systems by companies, operators and governments. In Guayaquil, Ecuador, bodies were left on the streets, families waited up to five days for the deceased to be collected, people without adequate personal protective equipment (PPE) handled coffins in private vehicles (Gallón, 2020) and cardboard coffins were used for burial (Phillips and Moncada, 2020). In Northern Italy, where the deaths were six times higher than in normal times, army teams and vehicles were required to perform burials. In Iran, the impossibility of performing Islamic washing rituals generated complaints from the population (Amante et al., 2020). In Spain, older people were left dead in their beds, and an ice rink was used as a morgue (BBC, 2020). In New York, USA, containers were used to temporarily store corpses, and burials in collective gravesites were performed for people who were unable to pay the funeral costs (Exame, 2020). In Manaus, Brazil, air transportation was necessary to restock coffins (Oliveira, 2020).
The increase in deaths overworked the funerary systems and caused waiting queues for the treatment of corpses at various stages of the process (Vidua et al., 2020). It appeared that there was no adequate preparation or preliminary analysis of the funerary processes in these places.
As an alternative to address these problems, the simulation uses computational techniques to emulate real scenarios. Based on mathematical models, the simulation enables experiments to be conducted to understand the behaviors and evaluate the action strategies (Nogueira Ramos Neto and Ricardo Pinto, 2004). Among the modeling methods, discrete event simulation (DES) is based on a stochastic approach. Thus, DES considers the variability in time between arrivals, the processing of activities and the exits of a system. DES is widely used to model operations where entities flow through queues and activities over time. Such models are suitable for determining the impact of resource availability on the waiting times, number of entities waiting in queues or entities that pass through the system (Currie et al., 2020).
This practice forum article presents a DES model to simulate scenarios to quantify the necessary resources and operate the funeral system of São Paulo City during the COVID-19 pandemic, and it discusses operational lessons learned about these logistics systems. The study comprises processes from the occurrence of death to burial in a chain that includes the activation of the service by the family, dispatch of a vehicle, placement in the funerary urn, transportation, wake, burial and requirement for coffins and graves. Thus, this analysis can mitigate the sanitary, environmental and biosafety problems related to the handling of cadavers (Cardoso et al., 2012; WHO, 2020).
Academic studies on funerary system logistics are scarce. Although DES models are commonly used in industrial activities and in providing services, their application in funeral systems has not been addressed in the literature. Thus, the simulations contribute to the improvement and increase in capability and maturity of processes (Gonzalez-Feliu et al., 2020) such as disaster preparedness and responses, especially for pandemics. An application in São Paulo (Brazil) was performed by analyzing what-if (what would happen if) scenarios to provide support for resource dimensioning.
Analysis and development of the model
São Paulo is a megacity with approximately 12 million inhabitants. A quarantine was decreed in the city on March 22, 2020, due to COVID-19. Funeral services are fully managed by a state-owned company of the municipality, and there are several points distributed throughout the city, where the relatives of the dead hire funeral services. The operation occurs from two distribution centers, where funeral supplies and vehicles are located, from which the services are dispatched. Supplies for this service occur through contracts (coffins, protective cloaks, bags and accessories), which are annually negotiated with suppliers.
At the beginning of the pandemic, shortly after the quarantine decree, the news showed funerary problems in several cities around the world. A multidisciplinary committee coordinated by the state government and composed of focal points from different areas such as funerary services (operations and contract management), health, police, army, civil defense, media and academics, was established. The goal of the group was to assess the capacity of the funerary system in the city of São Paulo (Brazil) and prepare it for an eventual increase in the number of deaths.
Considering the complexity of the funerary systems, especially queuing problems, and the use of DES to solve similar problems, the multidisciplinary group selected this methodology to perform a simulation to support sizing and decision-making.
The waiting time was a key issue in the modeling process. In this sense, variables with effect on the waiting time were considered more important in the simulation. Therefore, the model was developed to estimate the necessary amount of resources (vehicles, workforce, number of coffins and graves) to minimize the waiting time.
DES is a widely accepted approach for the detailed analysis of systems where waiting queues occur depending on available resources (Lopes et al., 2017). DES is commonly used in logistics systems. However, a structured search in the literature, which combined the keywords simula*, optimization, and Arena with the words (by the connector AND) funera* and burial in Scopus, Taylor and Francis, PubMed, Web of Science, Sage, Springer and Open Access Journals, identified no academic articles to dimension or optimize funerary systems.
The DES methodology in this study has the following steps (Shapiro, 2007): (1) directed prospecting: consulting people who dominate the process and detailing the characteristics of the system under analysis and the parameters that delimit it; (2) specific tooling analysis: the simulation model was described in the software, data were collected and the criteria used for implementation were inserted; (3) critical analysis: evaluating the simulation results and projected scenarios and implementing the improvements.
The input data on the funerary system in São Paulo were obtained from databases, statistical information and interviews with funerary service workers who performed the activities and dominated the processes.
Scenario simulation model
Discussion with the team that works in the funerary system resulted in a process flowchart containing the sequence of events from the occurrence of death to burial (Figure 1). During this flowchart elaboration, some processes were evidently improved even before the simulation model was ready. One example was the elimination of transportation steps. The cemeteries in the city of São Paulo have adjoining rooms to be used for the wake. Before the pandemic, funerals could be held in different places around the city, and burial occurred in any cemetery. During the pandemic period, it was established that when a wake occurred (for COVID-19 deaths, a wake was not allowed), it could only be held in the adjoining room of the burial cemetery. This simple measure reduced one transportation step.
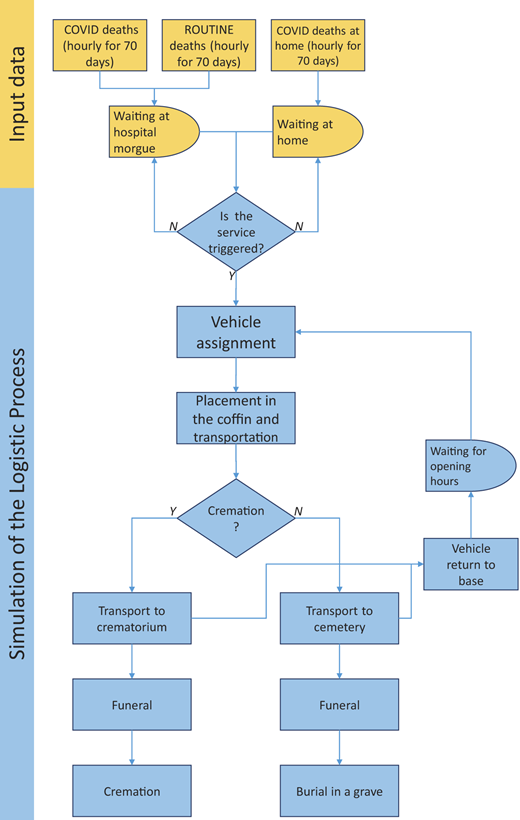
Improved flowchart of the funerary system of São Paulo City, Brazil
Improved flowchart of the funerary system of São Paulo City, Brazil
The total deaths considered in the simulation covered the sum of two components: expected mortality of the population and deaths of victims of the pandemic. The expected mortality (called routine) can be obtained based on a history of information on the corresponding months in previous years or even through the crude mortality rate of the corresponding location.
In the case of São Paulo, information on the deaths in 2018 and 2019 is available in funerary service databases. Regarding the deaths of the victims of the pandemic, at the beginning of the simulation process, no available data or historical data could provide a reliable analysis or forecast. Available forecasts estimated a horizon of at most 15 days, and there were differences among the models. Therefore, the data and behavior of the death curve of places with a greater history of information were initially adopted and adjusted to the established scenarios.
Official and academic data from Italy, Germany, France and the USA were available. The city of New York was selected as an initial reference because it is a megacity with similar characteristics to the city of São Paulo, such as the use of public transportation and a high population density. Thus, the number of deaths and behavior of the New York City curve (New York City, 2020) were adopted to preliminarily estimate the number of deaths and provide support for the initial dimensioning of resources. Later, when there were more accurate data for the city of São Paulo, based on the concept of real-time learning in biological disasters (Gerstein, 2020), preliminary results were reviewed because the death curves had different behaviors. In New York, there was a rapid increase that reached a peak with a subsequent decrease; in São Paulo, the increase was not so abrupt, a plateau was formed and the decrease slowly occurred. Figure 2 presents the behavior of deaths in New York and São Paulo from the first death in these places.
Behavior of deaths in New York and São Paulo, updated till July 21, 2020
Behavior of deaths in New York and São Paulo, updated till July 21, 2020
Tool analysis and model description
The simulation model developed for the funeral and burial system of São Paulo City was created using the software ARENA version 16. Due to the nature of the theme in this study, no figures or animation resources were used.
The funeral and burial system of São Paulo City can be simulated as a set of processes and activities that represent this system in a 70-day planning horizon. Above this horizon, the uncertainty is high. The model processes were split into two groups: the deaths' generator process and the logistic process. The entire process consists of the following activities (the values are presented in Appendix):
Arrival process of COVID-19 deaths (started with the dataset): There are three arrival methods: victims might die of COVID-19 in hospitals or their residences, and victims of other issues might die in hospitals. For each arrival, there is a probability density function that corresponds to the number of victims per day. The number of victims per hour was considered uniform during the day. The probabilities of a new death occurring at a starting point were considered proportional to the number of vacancies and intensive care unit (ICU) beds in hospitals and the registered number of deaths in residences.
Wait time in the morgue or residency: The waiting time varies according to the hospital capacity. From this process, entities that represent the victims are generated.
Logistic process: This process receives victims from the arrival process and uses information concerning the victims who will be buried or cremated and their final destination. The process is composed of the following steps:
Service triggering: Once a professional prepares a death declaration, the family or social service begins the funeral and burial service. This service can be paid or free. At this time, it is determined whether the victim will be buried or cremated, and the destination of the victim is decided.
Vehicle assignment: A hearse with a coffin and equipment to prepare the body is assigned to this activity. There are restrictions due to the opening hours of the cemetery and crematorium and vehicle scheduling.
Placement in the coffin: The victim's body is placed in the coffin, prepared and identified. If the victim died with COVID-19, specific health legislation may be followed (São Paulo, 2020).
Final destination location: This location may be a cemetery or crematorium according to what was determined in the service triggering process.
Transportation: The victim's body is transported from the funeral and burial service points to the cemetery or crematorium. The number of vehicles to address the entire transportation demand is part of the simulation result.
Funeral or wake: During the pandemic, wakes were not permitted for COVID-19 victims according to the specific health legislation (São Paulo, 2020). The wakes of other victims may occur in the cemetery or crematorium where the body will be buried or cremated.
Burial or cremation: This is the last process of the simulation. If the victim is buried, the burial occurs according to a probability density function based on historic data. The number of teams to perform the burial process is part of the simulation result. If the victim is cremated, the family or social service determines when and where this will occur. The crematorium is capacitated; if the capacity is reached, queuing occurs.
Process time
The time of the processes was obtained through interviews with professionals who performed the activities of the process and had experience with it. The interviews were conducted to obtain the minimum, maximum and most likely values; with these values, triangular functions were built. This distribution function is indicated for disaster occurrences, especially when data are not available (Banomyong and Sopadang, 2010). The triangular functions for each step of the simulation are described in Appendix.
The process time distributions in this simulation model were the waiting time in the morgue or residence, transportation to collect the victim's body, preparation of the corpse, transportation time to the cemetery or crematory, cremation and burial (from arrival at the cemetery to completion of the burial and release of the burial team).
Scenario analysis
The model was evaluated and validated with a team that works in funeral and burial processes. In this situation, the data from the situation before the pandemic were simulated, and the results were compared. After validation, we established the scenarios.
Scenario planning is a widely used method to support the decision-making process by simulating future situations to evaluate the main uncertainties (van der Hijden, 2005) and key indicators of the adopted strategies (Montibeller et al., 2006). The scenarios were established with the what-if strategy (Golfarelli and Rizzi, 2009) to evaluate how the changes in quantity and shape of the distribution of new victims modified the necessary number of resources to support the entire process. Several scenarios were prepared (Table 1). The scenario strategy is dynamic and designed to ready the system for a given situation, and the next scenario is prepared. If the situation changes, the operation of the prepared scenario begins, and the successive scenario is prepared.
70-day simulation results according to the scenarios
| Model inputs | Model outputs | |||||
|---|---|---|---|---|---|---|
| Ref | Scenario | Deaths/day | Operational characteristic | Vehicles | Cemetery teams | Graves and coffins |
| Based on NY data | 2x | 600 | All cemeteries 24 h | 124 | 101 | 28,633 |
| 2x | 600 | 3 cemeteries 24 h | 124 | 81 | 28,633 | |
| NY | 850 | All cemeteries 24 h | 164 | 128 | 36,971 | |
| NY | 850 | 3 cemeteries 24 h | 164 | 95 | 36,971 | |
| 4x | 1120 | All cemeteries 24 h | 213 | 146 | 43,729 | |
| 4x | 1120 | 3 cemeteries 24 h | 213 | 106 | 43,729 | |
| São Paulo data | Pl500 | 500 | 3 cemeteries 24 h | 115 | 80 | 33,655 |
| Pl600 | 600 | 3 cemeteries 24 h | 126 | 86 | 40,434 | |
Note(s): Due to the stochastic nature of the model and its variation, the outputs are slightly different from that generated by a deterministic input. The italics lines highlight the decisions initially taken and after the knowledge of the new information
The future situation was defined according to historical data on death during the periods before the pandemic. It was assumed that the funeral and burial system operated as before the pandemic. Moreover, routine values were included as the first components. From the routine values, the number of deaths was included as the second component, which varied according to the scenario.
We established three scenarios for the number of deaths, for which the maximum number of deaths was two, three and four times the routine value. These scenarios were called 2x, NY and 4x. All of these scenarios follow the distribution functions of deaths in New York City. For each scenario, there are two operational situations: the current opening hours or 24-h opening of the major cemeteries of São Paulo City (Vila Formosa, Nova Cachoeirinha and São Luiz).
From the point at which the historical data were available, two new scenarios were created with 500 and 600 deaths (called Pl500 and Pl600, respectively). The differences in peak and shape of New York City's distribution and São Paulo City's distribution determined the need for this change. In these new scenarios, the daily deaths were considered constant during the plateau, following the shape observed in São Paulo, as presented in Figure 2.
Implementation in practice
Setting the operation according the model results
The model to simulate the funerary and burial system of the city of São Paulo was built using the ARENA v16 software with 64-bit Windows 10 Pro and an Intel Core i7 4510 2 GHz processor. The processing time was 67 s for a 70-day simulation horizon. Twenty replications were performed for each scenario (initially 100, but due to the time to solve and no relevant differences in results, this number was reduced to 20). The warm-up period was not considered because the model represents a nonterminal system that was considered initially empty combined with infinite capacity for dimensioning purposes.
The input data were the distribution of deaths according to the scenarios ( Appendix). Based on the daily deaths, the distribution over a day was considered linear, and the origin (hospital or residence) was based on the capacity of the hospitals and historical data of the percentage of deaths in residences. Destination cemeteries were considered according to historical data. For the funerary process, there was no difference between confirmed or suspected COVID-19 death.
The results were presented through a Microsoft Power BI interface, which provides the graphical interaction and analysis of the minimum, average and maximum values observed for the parameters. Due to the nature of the service that we study, maximum values should be used to ensure that the needs are satisfied. Table 1 shows the results of the maximum values according to the simulated scenarios.
At the beginning of the pandemic, the results presented by the scenario 2x (two times the routine value) – 3 cemeteries 24 h (Table 1) were used to dimension and prepare the funerary system in São Paulo. When the real data in Figure 2 were obtained, the system was readjusted for the Pl500 scenario. If there is an increase in the number of deaths, the scenarios that consider these values can be adopted for preparedness.
As shown in Table 1, the model can estimate the number of vehicles, cemetery teams, graves and coffins for the funerary system in São Paulo. Thus, the simulations can predict critical situations and prepare public management to act appropriately in potential scenarios to minimize waiting time in the process. Comparing the availability of resources with the simulation results, for the São Paulo case, the bottleneck was vehicles and transportation. Based on the simulation results, 220 additional burial workers were hired, and 20 hearses, lighting systems and six refrigerated containers for the three largest cemeteries were rented (São Paulo, 2020). To reduce the number of teams in the cemeteries, 24-h operations were considered in the three São Paulo major cemeteries (Vila Formosa, Nova Cachoeirinha and São Luiz). In these scenarios, for the same waiting times, the required workforce is lower compared to scenarios where all cemeteries have 24-h operation.
Because crematoriums have operations with limited capacity (30 cremations per day), the capacity was identical regardless of the studied scenario. In this situation, the crematorium requires managerial effort to control the number of corpses to be cremated.
Lessons learned
The simulation modeling process and monitoring of funeral operations during the pandemic provide insights into the problem that can contribute to future operations in addition to the results for dimensioning. Many of these insights appear obvious in business logistics operations; nevertheless, they were observed in funerary logistics during the pandemic.
During the development of the model and directed prospecting, the process provides results such as the positioning of refrigerated containers or the use of temporary warehouses at intermediary points. This operational alternative (used in Spain and New York) was shown to be unfeasible in São Paulo because it requires an additional transportation step, and vehicles were a critical resource. In case of necessity, refrigerated tractor-trailers or containers should be positioned at the beginning (morgues) or end (cemetery or crematorium) points and should avoid being parked in public places or near the population and additional transportation step (Cherelus and Ochs, n.d.; Hennigan and Keyssar, 2020). The development of the model with the voluntarily technical support of the software supplier in Brazil quickly made this development and enabled the team members to focus on process improvements.
In all scenarios, the funerary system should operate 24 h per day. Lighting equipment and teams must be provided for this operation. The simulation shows that vehicles were parked and idle at night due to operational impossibility in the scenarios without 24-h operation.
Regarding coordination, an Integrated Command and Control Center was established. The multidisciplinary team constantly monitored the number of deaths, inventories, queues and observed operational difficulties. Difficulties were quickly discussed (using online meeting tools) by focal points, and solutions were proposed. This proximity to focal points of the areas in the diverse subjects made solving the problems easier. The raised problems and results of the taken actions were monitored daily by the group. At the beginning of the pandemic, the entire group formally met (in person or online) twice a week for discussion and general alignment of the situation.
Inventory management mainly involved coffins and specific materials for the burial of COVID-19 victims. These supplies have annual contracts that were negotiated with suppliers before the COVID-19 pandemic. Weekly meetings were held to provide feedback to the coffin suppliers and update the demand forecast. Other suppliers such as the suppliers of PPE, body bags and mortuary accessories were also periodically contacted, and quantities were adjusted.
Regarding the training of teams, the increase in demand caused temporary workforce hiring, mainly burial workers. This issue required training in the operation and use of the PPE, and new workers were inserted into teams with experienced professionals. In case of a greater increase in number of deaths, training for armed forces and police teams was also prepared.
Grave digging must occur at least one day in advance. Using mini excavators with specific buckets to dig graves is recommended (Rochabrun, 2020). Digging graves in a different cemetery zone from those where the burials are occurring is a good practice to avoid crowds near the place where graves are being dug.
The times of the wakes were reduced from 24 h to 1 h (wakes were not allowed for COVID-19 deaths) and only in rooms adjoining the cemeteries. During the pandemic, the funerary system had to rapidly expand its capacity. In some processes, this expansion could not be accomplished, such as in crematoriums. These fixed-capacity services require management capacity and control of the number of corpses in the service.
Conclusions
This practical forum paper presented lessons learned about resource management during the pandemic and a model that gathered expert knowledge and scenario simulation, which was developed to support decision-making for the complex logistic system associated with the funeral service in São Paulo. The rapid establishment of a multidisciplinary group to analyze the processes and develop a decision support model provided the preparedness measures, which were accomplished within a compatible period with the requirements during a pandemic. This process analysis and the results can emulate critical situations, provide an effective tool to support public management and contribute to solving real logistics problems. The main input of the model is the number of casualties, so the methodology can be used to plan for outbreaks of diseases and other humanitarian emergencies by only changing the input parameters and adjusting the model according to the process. Through an analysis based on the dynamic behavior, logistics funerary processes were quantified. The model results show the need for funerary vehicles, burial teams, quantities of coffins and graves. Therefore, the study enabled us to foresee the need for these resources, provide health security and prevent the social instability that resulted from the inability to properly handle and dispose of corpses. Ongoing studies are being conducted on the routing of funeral vehicles.
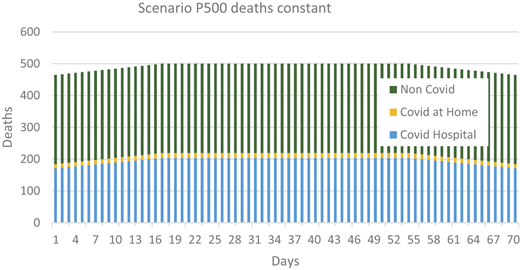
Death distribution for scenario 2x – 600 deaths per day in the peak
Death distribution for scenario 2x – 600 deaths per day in the peak
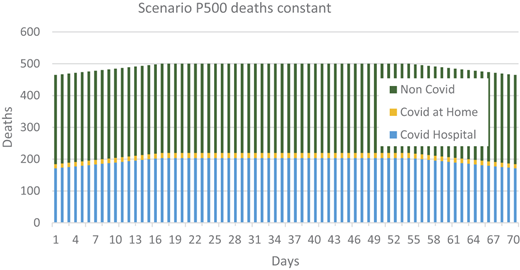
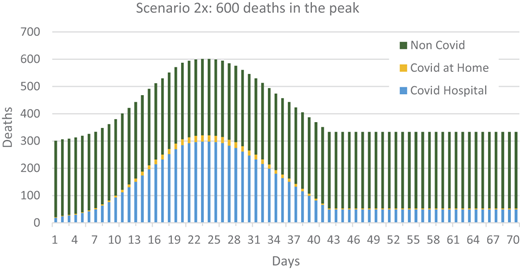
Death distribution for scenario Pl500 – 500 deaths per day on the plateau
Death distribution for scenario Pl500 – 500 deaths per day on the plateau
Triangular functions of the process considered in the simulation
| Process | Unit | Minimum | Most likely | Maximum |
|---|---|---|---|---|
| Wait time in morgue | Minute | 81 | 90 | 99 |
| Wait time in residence | Minute | 306 | 360 | 414 |
| Transportation to collect the victim's body | Hour | 3 | 4 | 4.5 |
| Preparation of the corpse | ||||
| Transportation time to the cemetery or crematory | ||||
| Cremation | Minute | 60 | 80 | 100 |
| Burial (from the arrival at the cemetery to the completion of the burial and release of the burial team) | Minute | 30 | 40 | 60 |
| Wake | Minute | 60 |
This research was supported by Coordination for the Improvement of Higher Education Personnel (CAPES), grant number Pró-Alertas 88887.091746/2014-01
References
Appendix
Death distribution for scenario 2x
Death distribution for scenario Pl500
Triangular functions

