

It is essential to provide drinking water to affected population directly after a disaster. The purpose of this paper is to develop an optimization methodology that helps in the distribution of drinking water in post-disaster situations.
The research was conducted on two phases: phase 1 aims at identifying an appropriate way to deliver drinking water to refugee camps from external sources, considering required drinking water quantities and four possible sources of water with respect to cost and risk assessments. Phase 2 investigates drinking water distribution within a refugee camp using covering models. The MCLP–optimal number of facilities model is proposed to ensure that the water is distributed and delivered to all individuals in a camp with minimum number of water storage tanks required. A control policy is proposed to ensure the fair distribution of water to all targeted individuals.
Al-Za’atari refugee camp, located in northeast of Jordan, was considered as the case study for this research. The result showed that the appropriate way to deliver water to the camp is by using tanker–trucks, and a minimum number of five tanks are required to distribute water to individuals inside the camp with respect to tank locations and the allocation of tank of each area.
The proposed methodology is essential in decision making for the distribution of drinking water in refugee camps in short-term needs. The model adds important value to the literature as the proposed problem has no solution in the literature before.
1. Introduction
Over the past decades, the world has witnessed many disasters due to wars, terrorism and natural disasters. These disasters have led to many thousands of deaths, displaced millions of people and forced millions to flee their country as refugees. With respect to refugees, world refugee numbers continue to grow due to various political, environmental and conflict situations. After leaving their country, many refugees relocate to camps in neighboring countries while others assimilate into the society of the new host country. Relocating refugees to another country creates a challenge for the host country to satisfy basic needs for them (Tomaszewski et al., 2015).
Whether it is a man-made or natural disaster that causes people to leave their country, humanitarian aids must be provided to the people who are affected by those disasters immediately during and after disaster periods. The emergency supplies include food, water, sanitation, medication, shelters, etc. Delivery of the humanitarian aid from suppliers to beneficiaries must be executed as quickly as possible (Hong et al., 2015; Hamedi et al., 2012). According to UNICEF (2015), “Water, sanitation and hygiene are critical for survival in the initial stages of an emergency. People in emergencies are more susceptible to illness and death from diseases that are often caused by lack of sanitation, inadequate safe water supplies and poor hygiene.”
It is a vital need to supply any community with an adequate quantity of clean water to stimulate productive work and help improve personal hygiene, food preparation and healthcare among the beneficiaries. Providing refugees with a continuous supply of drinking water with a high quality and with minimal risk to human health is highly significant and should take into account their special, social, economic and political characteristics (United Nations, 1992).
This research paper presents results of a detailed study to define the best method to supply refugees with clean drinking water. In addition, this study aims to distribute this water within refugee camp efficiently using covering models. A model is proposed here to ensure that this water is distributed in the best possible way and to ensure that total demand on water is covered with the minimum number of water reservoirs. In addition, this study focuses on the short-term needs (emergency), which include meeting the basic needs of refugees until more permanent and sustainable solutions can be found. It is highly imperative to provide rapid-response aid and to find a direct solution considering the time restrictions inherent in emergency situation. The main goal of this study is to optimize the supply and distribution of drinking water in refugee camps. This would be conducted in two phases: phase 1 is to determine the quantity of water supplied, as well as the proper method to supply water to refugee camps considering four possible options in the short-term; using tanker trucks, ground water, ground water–pipelines combinations and ground water–tanker trucks combinations. The best alternative is chosen considering two factors: cost and risk. Phase 2 concerns with determining the distribution of supplied water within the camps using covering models. A control policy is proposed to ensure the fair distribution of water to all people.
2. Background and literature review
According to the United Nations (1992), a disaster can be defined as “a sudden catastrophic event that causes serious disruption of the functioning of a society causing widespread human, material, economic and/or environmental losses which exceed the ability of the affected society to cope with using its own level of resources.” It can be classified based on its causes into two main categories: natural or man-made disasters, where natural disasters are caused by natural hazards, and man-made disasters are caused by human action (Ergun et al., 2010).
Disaster relief management refers to the process of responding to a catastrophic event by providing humanitarian aid to the affected communities who have suffered from disaster. Disaster relief is a multi-phase process; these phases vary in the research methods used to address them. Many researchers prefer the four-phase process: mitigation, preparedness, response and recovery, based on the national comprehensive emergency management concept proposed in 1978 (Intermodal Freight Transportation Institute, 2010). Other researchers such as Lee and Zbinden (2003) discussed three phases of disaster relief operations: preparedness, during operation and post operation. Kovács and Spens (2007) discussed the same three phases but with different operations within disaster relief being identified as preparation, immediate response and reconstruction. There is also another two-phase method: disaster mitigation, which includes assessment, prevention and preparedness, and disaster response, which includes relief, rehabilitation and reconstruction (United Nations, 1992).
This study follows the two-phase approach: disaster mitigation and disaster response. The focus is on the disaster response phase, which includes activities in both short-term immediate responses and long-term recoveries and reconstruction after the onset of disasters. The short-term immediate response is the main research interest here because it is highly important to immediately provide the affected people with food, clean water, shelters and medical care.
Humanitarian logistics refers to the processes of gathering people, resources, skills and knowledge to help people affected by natural disasters and complex emergencies. It includes a range of activities: preparedness, planning, procurement, transport, warehousing, tracking and tracing, and customs clearance (Thomas and Kopczak, 2005). We focus here on transporting and distributing activities. Humanitarian logistics is the most important part in any disaster relief management; it comprises over 80 percent of the total costs in disaster relief (Van Wassenhove, 2005). Therefore, investing in logistics in disaster relief will help to develop an effective and efficient use of resources (Cozzolino et al., 2012). Owusu-Kwateng et al. (2017) developed a framework that focuses on all actors in a disaster for the analysis of relief logistics operations incorporated with the effectiveness of inventory management to evaluate the performance of relief logistics in a disaster in Ghana. Jahre et al. (2018) developed a checklist based on refugee camp design literature and conducted it on multi-site case study in four different countries to help in evolutionary perspective in designing new camps considering social implications.
We consider here the two broad types of activities that humanitarian aid organizations and non-governmental organizations NGOs engage in. The first type is relief activities, “short-term activities”: these activities focus on providing goods and services to victims of large-scale emergencies to minimize immediate risks to human health and survival. While the second type is the development activities, “long-term aid”: these activities focus on providing self-sufficiency and sustainability to an affected community, including establishing permanent and reliable transportation, healthcare, housing and food (Byman, 2002).
Several studies have investigated relief distribution. This kind of distribution provides food, medicine, shelters, work force, sanitation and other related relief resources to affected people (Caunhye et al., 2012). A number of researchers have studied the distribution of relief aids in general, where they focus on optimizing the flow of multiple supplies through distribution networks. For example, Safeer et al. (2014) reviewed modeling parameters for objective functions and constraints in humanitarian logistics distribution. Their research focuses on increasing the supply of relief aid. Berkoune et al. (2012) focused on transporting equipment and numerous humanitarian supplies in order to help and provide relief to victims. Haghani (1996) and Oh and Haghani (1997) defined detailed scheduling plans for transporting various supplies from multiple supply points in a disaster relief operation, with the assumption that the supply quantities are known. Barbarosoglu and Arda (2004) developed a scenario-based, two-stage stochastic programming model for transportation planning in disaster response. They elaborated a multi-commodity, multi-modal network flow formulation to describe the flow of material over an urban transportation network. In addition, Özdamar et al. (2004) addressed an emergency logistics problem for distributing multiple commodities to distribution centers near the affected areas. Falasca and Zobel (2011) constructed a model for procurement in humanitarian relief based in a two-stage stochastic decision process. The model has helped more efficiently and effectively to capture the uncertainty inherited in disaster relief cases and procurement process. It also has helped decision makers to improve the procurement decision processes.
Bozorgi-Amiri et al. (2012) drew up a mixed-integer nonlinear programming model to design a supply chain for disaster relief. The model addresses uncertainties in the demand, supply and transportation. In addition, the model helps decision makers in determining the location of relief distribution centers and the allocation of each center through the minimization of location, procurement, transportation, holding and shortage costs, as well as the variance of total cost. On the other hand, Camacho-Vallejo et al. (2015) considered studying specific multiple supplies in their research. They proposed a two-tiered mathematical programming model for humanitarian logistics to optimize decisions related to the distribution of multiple certain necessary products, such as bottled water, food and medicine.
There are very limited studies regarding single commodity distribution, where the relief supply type is definite. For example, Mete and Zabinsky (2010) analyzed the distribution of medical supplies to be used for disaster management under a wide variety of possible disaster types and magnitudes. Other authors have studied the transportation and distribution of food aid, including Knott (1988), De Angelis et al. (2007), Rancourt et al. (2014), Rancourt et al. (2015) and Paul and Wang (2015).
Access to safe drinking water is one of the primary priorities following a disaster. It is challenging to provide drinking water to the affected individuals. Limited research has been concerned with drinking water distribution in emergencies. Among these researchers are Nolz et al. (2010), who developed a decision support model through multi-objective metaheuristic algorithm as an extension of multi-objective covering problem to help in planning water distribution for emergencies in disasters. Also, the proposed model takes into consideration heterogeneous transport modes and different road types. But most of the studies concerned with providing drinking water to people affected by disasters have focused on the treatment of drinking water, such as Ali et al. (2015), who investigated water treatment practices in refugee camps in South Sudan, and Butler et al. (2013), who examined water treatment in emergency situations. These studies assume that water is available and only is need of being treated. Nonetheless, it is essential to determine the most efficient method to supply water in the first place.
Loo et al. (2012) reviewed water technologies, including membrane technologies that are suitable for use in emergencies for drinking water supply. Wendt et al. (2015) provided a protocol on how to produce hydro geological questionnaire maps for humanitarian purposes using remote sensing data and geographic information system to get clean drinking groundwater.
It is essential that water is supplied to the affected population in an efficient and effective way and as soon as possible. Covering models are very successful in this regard; they have many applications in emergency situations. For example, Rajagopalan et al. (2008) developed a multi-period set covering location model for the dynamic relocation of ambulances to determine the minimum number of ambulances and their locations. Considering the supply of humanitarian aid, Naji-Azimi et al. (2012) designed a covering tour approach to the location of satellite distribution centers. Also, Balcik et al. (2008) proposed a model that can be used for the scheduling of vehicles that will deliver supplies from local distribution centers to areas affected by disasters using last mile distribution. The model is considered as a mixed-integer programming model that incorporates vehicle capacities and delivery time restrictions for delivering required supplies to the affected areas. The authors point out that looking for a faster algorithm to solve the model may help to solve the last mile distribution problem, as the problem increases in complexity along with a rise in the number of nodes and routes.
Covering models are extensively used in facility location applications, particularly for locating facilities in emergencies. The main concept for such models is that the demand is covered if it is located within a specified distance or time, which is called covering distance or covering time. According to Schilling et al. (1993), covering models are classified into two main categories based on the covering concept: set covering models, which aim to choose facilities among a finite set of potential sites, such that all demand is covered with a minimum number of facilities. In addition, maximal covering models that choose facility locations to maximize the amount of covered demand subject to resource limitations.
In disaster relief, using set covering models would mean that to cover each potential demand point, it must be within a specified distance or time of a facility. However, covering the entire demand of every potential disaster scenario this way may not be cost-efficient or even feasible. Therefore, maximal covering models are more suitable for relief network design, as concluded by Balcik and Beamon (2008), who proposed a model that is a derivative of maximum covering location to determine the required locations and numbers of distribution centers to respond for emergency relief as well as the amount of supplies required to be held in each center. The model incorporated budget constraints and capacity limitations. Experiments have been conducted to illustrate the application of the model. The results showed the importance of the pre-disaster budget and funding compared to post-disaster funding.
The maximal covering location problem “MCLP” maximizes the total number of people served within a maximal service distance, given a fixed number of facilities. MCLP has a broad range of applications and has been studied extensively, after Church and ReVelle (1974) introduced it. Many different versions of MCLP models assumed that the facilities to be sited are uncapacitated. This means that the demand will be covered as long as it is within the service-covering standard of any facility. However, this assumption of uncapacitated facilities limits the application of covering models (Current and Storbeck, 1988). Many service facilities have limited capacities to ensure an acceptable level of service and spatial equity (Liao and Guo, 2008; Murray and Gerrard, 1997). Therefore, the capacity limit, the constraint addressed in this study, is an important consideration in location problems, especially for locating emergency facilities.
Chung et al. (1983) and Current and Storbeck (1988) developed the models of capacitated versions of the MCLP. They added maximum capacity constraints into the mathematical formulations of the MCLP to ensure that the demands allocated to a facility will not exceed the capacity of that facility, considering that the allocation of the demands is only within the service-covering standard of facilities. Regarding emergencies, it would be more practical to assign each demand to the service facility whether that demand lies within the service-covering standard or not. Pirkul and Schilling (1991) proposed an extension of the capacitated MCLP where all demands are assigned to facilities. Following the work of Yin and Mu (2012), a multi-objective capacitated MCLP model is proposed, which uses an acronym to refer to the modular capacitated maximal covering location problem (MCMCLP), where the objective function maximizes the weighted covered demand while simultaneously minimizing the average distance from the uncovered demands to the located facilities.
We propose in this study to extend the capacitated MCMCLP model to the emergency facility siting problem in which a facility is capacitated with different levels to determine the optimum number of facilities to be located, in addition of maximizing the covered demand while minimizing the uncovered demand.
3. Methodology
The proposed methodology of this study is introduced in two phases: phase 1 concerns with determining the proper method to transport drinking water to refugee camps from external resources with respect to two factors: cost and risk. Phase 2 concerns in determining the distribution of water through the camp using covering models. This study proposes a model, which optimizes the number of water storage tanks to be located as well as to maximize the number of covered individuals.
3.1 Phase 1
This study focuses on short-term activities due to its high importance to the early stages of disaster relief management. The key point in this phase is to determine the quantity of water needed, as well as determining the proper method to supply water to refugee camps, considering four possible options in the short term: tanker truck, ground water, ground water–pipelines and ground water–tanker trucks. The best option will be chosen based on cost as well as risk assessment process.
According to the United Nations High Commissioner for Refugees (UNHCR) (1992), in standard circumstances, the refugees have access to 15 l of water per capita for public needs; however, under severe circumstances, this number drops to 7 l per capita, which is considered as the minimum “survival” allocation that should be raised to 15 l per capita as soon as possible. The human body’s basic water requirements depend on the climate, workload and other environmental factors. A total of 3 l of water per day is the minimum requirement as for drinking. The amount of water needed for other purposes, including cooking or hygiene, depends on cultural habits, socio-economic factors and on the type of the water supply. Additional water requirements for livestock, sanitation facilities, other community services and irrigation may be of special importance in some emergency refugee camps (UNHCR, 1992). As the main interest in this research is drinking water, 3 l per day is the quantity needed for each refugee.
Short-term recovery should start as soon as possible in order for communities to begin the necessary efforts to recover after an emergency. These efforts begin during the immediate response phase to provide assistance to the affected local governments to restore vital services in the transition period between the actual event response and long-term recovery (Illinois Government, 2011).
One of the main concerns is to find the total cost of each option of water delivery. The total cost for supplying water includes the cost of water, cost of transporting water and cost of labor. The risk factors associated with each proposed method have been evaluated according to the standards set by Dos Anjos (1998).
The first option of supplying water is by using tanker trucks. This method is an extremely effective means of distributing clean water to civil and rural populations, especially as an emergency measure. Using this option on a daily basis is more costly in the long term than providing a piped system, but this method still provides an effective short-term solution to a water supply problem. This option is considered when there is a trusted source of water, whether it is groundwater or surface water, taking into account that the water is clean and ready to use by refugees with no need of treatment. In this case, the main supply for this water is located far from a camp location. When using this option, extracting the cost of water, the cost of transportation and the cost of labor individually could be ambiguous because it is difficult to breakdown the total cost into the incorporated cost items. One of the risk factors associated with this option includes having inadequate water supplies to meet daily basic needs, due to insufficient number of tanks, which create a shortage of the necessary quantity. Another risk is unclean water that is polluted water with biological, chemical or physical that makes it unsafe to use, given that the main source of water is clean, contamination in this option is due to tank use. Long transportation time is a risk also that may depend on the traveled distance, the road condition and the transporting vehicle. It may lead to long waiting time for accessible water. The need for road and street infrastructure is considered a risk for this method.
The second option of supplying water is by using ground water. According to UNHCR, ground water in rural areas is quite often considered safe enough to be provided directly without treatment. This option is feasible in the short term if it is already available and located inside a camp. In this case, there is no need for a means of transportation. The total cost covers only the water pumping-out cost without considering the cost of transportation and labor. Risks associated with this method may include unclean water, insufficient quantity and the depletion of ground water.
Supplying water using ground water–pipelines is considered as the third possible option to use. This option should be considered in the short term if the ground water is near a camp location and the pipelines are already constructed and available for use. In this case, the total cost includes water pumping-out costs and transportation costs. The risk factors include: unclean water, insufficient quantity, ground water depletion and infrastructure requirements. The last option to supply water using is through ground water and tanker trucks. This option may be considered when the ground water is close to a camp location but is not connected to pipelines. In this case, the transportation of water is completed using tanker trucks. The total cost of this option involves the cost of pumping water and the cost of transportation. The risk factors include: unclean water, insufficient quantities, long transportation time and the requirements of infrastructure.
Risk is evaluated with two surveys conducted by experts in the field of water supply. The first survey is conducted to determine the most important criteria related to water transportation risk factors, while the second survey is to determine the best method with the least risk based on the criteria chosen on the first survey by the expert. The proposed methods are ordered using pair-wise comparison matrices according to the expert’s linguistic evaluations where: 1 – equal importance, 3 – moderate importance, 5 – strong importance, 7 – very strong importance and 9 – extreme importance. As well, risk priority number (RPN) is assigned to each risk factor to emphasize the result. The RPN is a valuable tool for setting priority. Each risk factor has an assigned severity (S), probability (P) and detectability (D) values. Each of these risk elements takes a value from 1 (least) to 10 (most). RPN is the product of these three ranks. The best method for supplying water can be determined based on the least costly and minimum risk options.
3.2 Phase 2
This phase concerns with locating a number of water storage tanks among a limited number of sites such that all individuals are covered by at least one water storage tank. The problem is modeled and will be solved in two stages. In the first stage, a clustering algorithm is applied for demand classification into groups. In the second stage, a model is proposed to maximize the number of population served by those water storage tanks as well as optimizing the number of those tanks.
Cluster analysis is defined as grouping a set of objects in such a way that objects in the same group are more similar to each other than to those in other groups. The purpose of the analysis is arranging objects into relatively similar groups based on multivariate observations (Anderberg, 1973). Many clustering methods have been developed, each with different application and different algorithms. They can be divided into two main groups: hierarchical and partitioning clustering. Each of the groups has the plenty of subtypes and different algorithms for finding the clusters (Fraley and Raftery, 1998). Hierarchical clustering starts successively by merging smaller clusters into larger ones, or by splitting larger clusters. Partition clustering, on the other hand, tries to decompose the data set directly into a set of non-overlapping clusters. Such methods typically require that the number of clusters should be pre-set by the analyzer.
K-mean clustering approach is also considered in this study due to its simplicity and its ability of grouping the instances based on the distance which fits this research best. In other words, grouping people using this approach takes into account that the water storage tank will be close enough for every refugee in the camp, considering distances in such case prevent refugees from walking for a very long distance to get water. K-means clustering is a commonly used partitioning clustering method, where k is the number of clusters, since an instance is assigned to the cluster for which its distance to the cluster mean is the smallest. It starts out as follows: at first, an initial set of means should be set randomly and classifying instances based on their distances to the centers; next, the cluster means must be computed again, considering the assigned instances to the clusters; then, all instances must be reclassified based on the new set of means. This step must be repeated until cluster means does not change much between successive steps. Finally, the means of the clusters should be calculated once again and assign the instances to their permanent clusters (Maimon and Rokach, 2005).
Maximal covering location models choose facility locations to maximize the amount of covered demand subject to resource limitations, which is suitable for relief chain network design. Therefore, this study proposes an extension of MCLP models called MCLP–optimal number of facilities (MCLP–ONF) as the second stage of phase 2 of the methodology. The formulation for the MCLP–ONF model is based on the modular capacitated maximal covering location problem (MCMCLP) model that is developed by Yin and Mu (2012). They developed their model to maximize the weighted covered demand while simultaneously minimize the average distance from the uncovered demands to the located facilities. While the MCMCLP model is useful in a number of contexts, it is not an effective representation of emergencies because it is developed on the assumption that the number of facilities is fixed without considering the cost and the availability of such facilities.
In this study, the MCLP–ONF model aims to optimize the number of facilities needed, as well as to maximize the weighted covered demand while at the same time, minimizing the walking distance for refugees to the water storage tanks in our case. Optimizing number of facilities means choosing the most suitable number, which fulfills the total demand, i.e. taking into account any extra facility as increase in cost where the situation could be done with a lower number with the same result. The model entails the following considerations: the facility at each potential site has one maximum capacity, all demands need to be allocated to facilities, and the uncovered allocated demands would be assigned based on their proximity to facilities.
Several assumptions are made in this study to apply the MCLP–ONF model to optimally site water storage tanks in emergencies. One assumption is that a facility has a limited capacity. This assumption is simple but reasonable. The second assumption is the use of the model to determine the number of facilities, which, as assumed, presents no information of those numbers. This assumption ensures that humanitarian organizations would be able to supply the needed number of water tanks without any excessive and unwanted costs.
The benefit of the model, as opposed to MCLP models, is that the number of facilities is determined based on demand, which ensures the optimal number. Considering all the above, the model formulation for the research is as follows:
Sets and parameters:
I=the set of demand objects {1, …, i, …, m};
J=the set of potential facility sites {1, …, j, …, n};
S=the service-covering standard of facility;
dij=the travel distance or time from potential facility site j to demand object i;
Ji=the set of potential facility sites j within the service-covering standard of which demand object i lies, i.e., {j|dij⩽S};
ai=the amount of service demands at demand object i;
p=the total number of facilities; in this research the number of water storage tanks is concerned;
c=the capacity of one water storage tank (assuming all have the same capacity);
w=the weight associated with all the uncovered allocated demands; and
M=very large number.
Decision variables:
Xj=the number of water storage tanks stationed at potential facility site j; a facility is located on site j when xj>0; and
Yij=the percentage of demands at demand object i that is allocated to the facility on site j.
Maximize:
Subject to:
The objective function (Equation (1)) seeks to maximize the amount of the covered allocated demands, while simultaneously minimizing the total distance between the uncovered allocated demands and the sites to which they are assigned, as well as optimizing the number of tanks to be located. In this function, the weight w⩾0 can be varied to adjust the preference on each objective. The first constraint (Equation (2)) ensures that all demands allocated to any facility cannot exceed the maximum capacity of that facility, if no facility (i.e. no water storage tanks) is located on a site, no demand will be allocated to that site. The second constraint (Equation (3)) ensures that all demands at each demand object will be allocated to a facility, while the third constraint (Equation (4)) indicates that the decision variable Xj is a non-negative integer. In addition, the last constraint restricts the continuous decision variable Yij, which ranges from 0 to 1.
According to Haghani (1996), to ensure maximization of the covered allocated demands, which is the primary objective, the weight “w” must meet the following condition when assuming integer demands:
where A is the total demands, and dmax and dmin are the maximum and minimum distances, respectively, between any pairs of demand object i and potential facility site j.
The factor M is important because it directly affects the objective function, as well as the number of tanks, since it is connected to Xj in the objective function. The value of this factor must be calculated to avoid the negativity value of the objective function, and to determine the optimal number of tanks. The covering distance s is the maximum distance the facility can provide service within. The value of s indirectly affects the number of facilities needed; when s increases, the number of facilities decreases since the facilities would cover larger distances efficiently reducing the need for any extra facility. On the contrary, when it decreases, the number of facilities increases; in this case, more facilities are needed to cover the demand. The value of parameter s is selected to be suitable for walking distances, as people walk to get their drinking water. Additionally, in disastrous areas, walking should occur within secured areas, which might not be always available. According to this, assigning the demand point to a facility is selected based on how long the people can walk safely to get their needs from water. This is surly happened with some dependency on value demand and supply.
MCMCLP was proposed by Yin and Mu (2012) to solve the set covering problem of locating the emergency vehicles, whereas the MCLP–ONF is developed in this research to solve the problem of locating water tanks and determining the number of tanks to be located in case of disasters. One of the important additions for MCLP–ONF is the third term in the objective function (), which is missing in the MCMCLP model. This term functions to minimize the number of tanks which is important in case of disaster, as the number of available or donated tanks is limited and increasing the number of installed tanks will acquire more security issues. Additionally, the number of vehicles (P) in MCMCLP model is predetermined, which is not applicable in case of disaster management. Whereas, in MCLP–ONF model, the resources are assumed to be limited during the humanitarian relief, so, determining the number of tanks is achieved by the solving the model to provide the minimum number of tanks with best possible service, i.e., maximum water delivery. For the same issue, the MCMCLP model has a constraint that forces the whole demand to be satisfied (sum of yij=1 for all i), which is absolutely not applicable in disaster regions. In such areas, the total demand exceeds the total supply (Al Theeb and Murray, 2017; Barzinpour and Esmaeili, 2014; Baba, 2014). Accordingly, the MCLP–ONF model treats this issue by enforcing the maximum demand delivery by allowing the possibility of not satisfying the whole demand in case of supply shortage.
The proposed model provides feasible solution even if the demand exceeds supply, as the constraints in Equation (3) is less than or equal to 1. However, in case of demand exceeding the suppliers, the model provides results with whole available supply is delivered, as the objective function is to maximize the delivery, but with some unsatisfied demand. Furthermore, even the existence of unsatisfied demand, the distribution is achieved with high level of fairness and justice, as the objective function includes the maximization of each node delivery ().
If the supply is greater than the requested demand, the model will give a suitable number of tanks for each district (node) to be sufficient for all people in each node. However, in other case, if the demand exceeds supply, the number of tanks in each node is sufficient for the portion of requested demand. In this case, it is responsibility of agencies work in these areas to ensure an equate distribution of water among people. Some discussion is added to clarify this point.
In the case that the minimum number of facilities needed to fulfill the total demand is not available, the demand value has to be reduced in a certain percentage to cope with the reduction of the facilities. For example, if the ONF is 5 and the available number is only 4, according to the model, this solution is infeasible. Therefore, the demand value, that is fed into the model, must be reduced to cope with this number to ensure that the model still gives a feasible solution to the problem and works as expected.
MCLP–ONF has been validated through small-scale problems, which include three facility sites and eight demand locations. Hence, it contains 39 constraints, 3 integer variables and 25 continuous variables. It was solved by using CPLEX–OPL and it obtained correct results.
3.3 A control policy
A control policy is essential in emergencies to ensure that the distributed drinking water will be fairly delivered to all refugees, and also to ensure that the water source is protected from any theft. The control policy is greatly needed where the situation is not stable and chaotic. A control policy can be implemented by first distribute water containers to every refugee family in the camp. Then, each family in a refugee camp must have an ID card, especially when trying to access water distribution points, this card must contain basic information of the user and their daily share of water. Thereafter, there should be a checkpoint with qualified persons who work on organizing the process of distributing water to refugees and collecting their cards, as well as ensuring that refugees are only accessing their share of water without any excess shares. Finally, there must be a fixed schedule for when refugees can access water distribution points, which in turn will give time to persons in charge to maintain an organized system that keeps the track of water quantities stored, and refugees who have or have not accessed their daily share of water.
4. Methodology implementation (Al-Za’atari camp)
More than six years have passed since the Syrian crisis broke out and the Syrian refugee situation began. Jordan is one of the countries in Middle East region that opened its doors to the large numbers of refugees. The current estimated official number is approximately 1.4m, with about 15 percent living in refugee camps while the majority of these refugees live in host communities. However, there are several camps across the country. Al-Za’atari is currently the biggest refugee camp for Syrians in Jordan (Jordan Center for Strategic Studies, 2014).
Meeting the needs of Syrian refugees is a great challenge for the Jordanian Government, as well as to the international organizations involved, not only due to the shortage of funding but also to the highly demanding levels of organization needed to handle this crisis (Jordan Center for Strategic Studies, 2014). Al-Za’atari camp is a refugee camp in Jordan, located 70 km northeast of Amman, which is gradually developing into a permanent settlement. It was first opened on July 28, 2012 to host Syrians fleeing the violence of the ongoing Syrian civil war that erupted in 2011 (Kimmelman, 2014). Al-Za’atari has developed from an empty desert expanse into a home for roughly 100,000 people with an area of 5.2 km2 (UNHCR, 2014). In an attempt to have the camp organized as a city, Al-Za’atari was divided into 12 districts each with a different population density. In this study, the main emphasis is on the short-term response, more specifically on the Al-Za’atari camp during its first six months, July 2012 to the end of 2012, with a population of 30,700 refugees (UNHCR, 2016).
4.1 Implementation of phase one
In this phase, the quantity of water to be supplied to the camp is determined, as well as determining the proper method to supply this water to refugee camps in the short term considering four possible options: tanker trucks, ground water, ground water–pipelines and ground water–tanker trucks. The best method to supply water can be determined based on the method with the least costs and minimum risks. According to UNHCR (1992), the minimum share of drinking water for each person is 3 l per day. For Al-Za’atari camp in the considered short-term period, the quantity needed daily to cover the drinking needs of a population of 30,700 people is 92,100 l (92.1 m3).
The surveys were distributed to experts from Agence d’Aide à la coopération technique et au développement (ACTED) organization, who have experience in water transportation and distribution in Al-Za’atari refugee camp. In addition, experts from Irbid water authority and Yarmouk Water Company were involved in this study. Each expert was asked to provide judgments based on personal knowledge and on the expertise of risk factors related to water transportation in Jordan.
According to the results of the survey, risk experts agreed that the most important factor is unclean water and inadequate water. In other words, it is a high risk to the transport unclean water and inadequate quantifies of water. These two criteria are considered in the following step to evaluate the risk factors related to water transportation in post-disaster humanitarian relief. To evaluate the risk factors in the first survey, experts were asked to set RPN for each risk factor. The result of the risk survey showed that unclean water and inadequate water factors are the ones with the highest RPN, thus emphasizing the result that has been concluded earlier in the first survey. As for unclean water factor, risk experts agreed that transporting water using ground water–tanker truck method pollutes water the most, followed by transporting water using tanker trucks, while transporting water using ground water–pipelines is the least polluting method. Therefore, the best method to transport water is by using ground water–pipelines, because it scored the lowest among all proposed methods with regard to risk factors in this study.
As for the inadequate water quantities factor, the source of water is the main key to determine the quantities and not the method of transportation. When using tanker trucks, the source is underdetermined as opposed to using ground water, which is clearly an identifiable source. For cost factor, Table I lists the cost of transporting water for the proposed methods in Jordan.
Costs obtained from experts for each water transportation method
| Method of transportation | Cost/m3 (Jd) |
|---|---|
| Using ground water–pipelines | 0.3 |
| Using ground water | 0.55 |
| Using ground water–tanker trucks | 1.1 |
| Using tanker trucks | 4 |
Ordering methods from most efficient to least efficient based on cost and risk factors is as follows: the ground water – pipeline method; ground water; and water tanker–trucks. According to data from Al-Za’atari camp, using tanker trucks to transport water from external sources into the camp is the current used method.
4.2 Implementation of phase 2
In this phase, the MCLP–ONF model will optimize the minimum number of water storage tanks Xj and will optimize the coverage of water tanks making sure that water tanks can distribute to all refugees efficiently. The clustering techniques that mentioned earlier in chapter 3 will not be necessary in this case, due to the camp topology and the division of the camp into 12 districts in a way that each district contains people with almost the same background and interest. Grouping people in this way avoids any inconvenience, facilitate the communication among them and ensure that water distributed to them in an organized way, which is the main purpose of clustering.
The capacity of the storage tanks in Jordan varies between 1,000 l to more than 90,000 l. It might be difficult to provide the camp with water tanks with large capacity within a very short period. Tanks with capacity of 20,000 l are considered is the case studied; it is the largest capacity that can be provided in Jordan according to Irbid water authority. The population density of each district of the camp determines the daily demand for each district; by multiplying the population density by 3 l, which is the minimum share for each person daily as mentioned earlier. Table II lists the population of each district as well as the daily demand of drinking water.
Population and demand for each district
| District number | Population | Drinking water demand (liters/day) |
|---|---|---|
| 1 | 4,282 | 12,846 |
| 2 | 5,002 | 15,006 |
| 3 | 2,767 | 8,301 |
| 4 | 1,957 | 5,871 |
| 5 | 552 | 1,656 |
| 6 | 1,996 | 5,988 |
| 7 | 912 | 2,736 |
| 8 | 835 | 2,505 |
| 9 | 2,064 | 6,192 |
| 10 | 3,349 | 10,047 |
| 11 | 4,191 | 12,573 |
| 12 | 2,793 | 8,379 |
The distances needed for this research dij are measured in kilometers using Google maps, presenting data that show maximum distance taken, the largest distance between two districts and the furthest distance one would walk to access water. These distances are used to conduct the distance matrix. Where the maximum distance is 3.31 km and the minimum is 0.56 km.
According to Equation (5), the value of weight w should be within the range [zero − 3.98×10⁻⁴] to ensure the maximization of the covered allocated demands. In fact, as long as the value of weight w falls in this range and does not equal 0, the solutions will be the same, irrespective of the weight w. Therefore, we set w=1×10⁻⁴ for the MCLP–ONF model. As the capacity c, weight w, distances dij and demand ai are determined, two factors are still in need of evaluation; M and the covering distance s, those two factors affect the objective function directly and they control the number of water tanks. Thus, they must be estimated carefully.
The model was solved using CPLEX to find the optimal solution. The model was run for multiple iteration with c=20,000, w=0.001 and with different values for M and s, as shown in Table III. Using trial and error method, 18,420 was found as the maximum value for M, at this value the value of objective function equals 0. Thus, choosing M smaller than 18,420 is necessary in the model to avoid the negativity value of the objective function.
Model sensitivity analysis M, s parameters
| Number of runs | M | s | Results of Xj | Objective function value |
|---|---|---|---|---|
| 1 | 0.1 | 0.9 | 5 facilities at each site total of 60 | 92,004 |
| 2 | 0.1 | 1 | 5 facilities at each site total of 60 | 92,004 |
| 3 | 0.1 | 1.5 | 5 facilities at each site total of 60 | 92,004 |
| 4 | 0.1 | 2 | 5 facilities at each site total of 60 | 92,004 |
| 5 | 0.1 | 3 | 5 facilities at each site total of 60 | 92,004 |
| 6 | 0.1 | 5 | 5 facilities at d1 only | 92,099.5 |
| 7 | 0.1 | 10 | 5 facilities at d1 only | 92,096 |
| 8 | 0.1 | 100 | 5 facilities at d1 only | 92,099.5 |
| 9 | 1 | 0.9 | 12 facilities one at each district | 92,088 |
| 10 | 1 | 1 | 12 facilities one at each district | 92,088 |
| 11 | 1 | 1.5 | 8 facilities (2 at d2) and (1 at d3,d4,d5,d7,d8,d9) | 92,092 |
| 12 | 1 | 1.6 | 8 facilities (2 at d2) and (1 at d5,d7,d8,d9,d11,d12) | 92,092 |
| 13 | 1 | 1.8 | 8 facilities (1 at d1,d2,d3,d4,d5,d6,d8,d9) | 92,092 |
| 14 | 1 | 2 | 6 facilities (2 at d1) and (1 at d5,d6,d8,d10) | 92,094 |
| 15 | 1 | 2.2 | 7 facilities (2 at d1) and (1 at d2,d8,d9,d11,d12) | 92,093 |
| 16 | 1 | 2.5 | 6 facilities (2 at d8) and (1 at d1,d2,d6,d12) | 92,094 |
| 17 | 1 | 2.6 | 7 facilities (2 at d8, d9) and (1 at d1,d3,d7) | 92,093 |
| 18 | 1 | 2.7 | 7 facilities (3 at d5) and (1 at d2,d3,d7,d9) | 92,094 |
| 19 | 1 | 2.8 | 7 facilities (2 at d7, d8) and (1 at d1,d2,d5) | 92,093 |
| 20 | 1 | 3 | 6 facilities (3 at d8) and (1 at d4,d5,d6) | 92,094 |
| 21 | 1 | 3.2 | 6 facilities (3 at d8) (2 at d1) and (1 at d5) | 92,094 |
| 22 | 1 | 3.3 | 5 facilities at d6 | 92,095 |
| 23 | 1 | 3.5 | 5 facilities at d1 | 92,095 |
| 24 | 1 | 100 | 5 facilities at d1 | 92,095 |
| 25 | 10 | 2 | 5 facilities (1 at d1,d4,d5,d8,d10) | 92,050 |
| 26 | 50 | 2 | 5 facilities (2 at d10) and (1 at d2,d5,d9) | 91,850 |
| 27 | 100 | 2 | 5 facilities (2 at d10) and (1 at d2,d5,d9) | 91,600 |
| 28 | 150 | 2 | 5 facilities (2 at d4) and (1 at d5,d8,d9) | 91,350 |
| 29 | 5 | 2.5 | 5 facilities (1 at d1,d5,d6,d7,d10) | 92,075 |
| 30 | 500 | 2.5 | 5 facilities (2 at d1) and (1 at d5,d6,d10) | 89,600 |
| 31 | 1,000 | 2.5 | 5 facilities (1 at d1,d2,d6,d8,d9) | 87,100 |
| 32 | 10,000 | 2.5 | 5 facilities (1 at d1,d2,d6,d8,d9) | 42,100 |
| 33 | 10,000 | 3 | 5 facilities (2 at d8) and (1 at d1,d5,d6) | 42,100 |
| 34 | 20,000 | 2.5 | 5 facilities (1 at d1,d5,d8,d9,d10) | −7,900 |
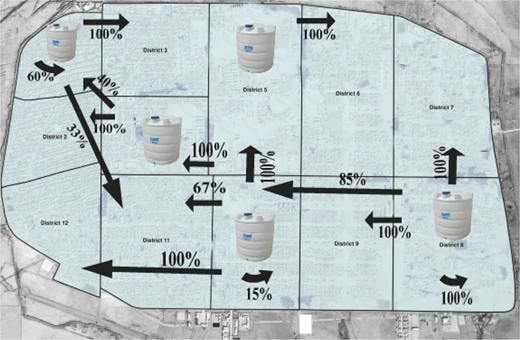
The process paired different values of s while holding values of m constant and vice versa as shown in Table III, after running CPLEX with different pairs of M and S values, as both m and s control the number of tanks, the result indicates that a minimum number of five tanks are needed. The optimal values for s and m are 2 and 10, respectively. The run time is 0.312 s. The solutions obtained from CPLEX were finally visualized in Figure 1, which shows the optimal locations of water tanks in the camp as well as the percentage of coverage by those tanks. Every district is covered 100 percent based on their proximity to the water tank.
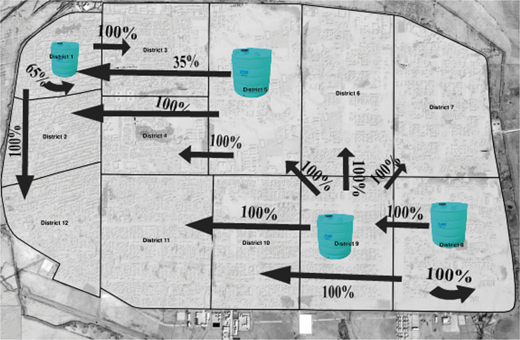
Five tanks are the optimal number to cover all the demand in the camp. In case, the number of tanks is not optimal, the model will distribute water evenly to all districts accommodating the reduction of the number of water tanks; the model will relocate the tanks into new optimal points that would serve the camp evenly. However, the demand value will be reduced due to the reduction in the numbers of water tanks. For example, if the number of tanks falls short by one, then the supply of water will drop from 92,100 to 80,000 l. Figure 2 shows the result of running the model with four tanks and with M=100, s=2.2.
If the demand was measured weekly rather than daily, the model will still be effective; however, it will present different results, e.g., in a weekly schedule, the optimal number of tanks as solved by CPLEX would be 36, which is a large number. In this case, the refill rate should be considered.
4.3 A control policy
The following steps can be taken to implement control policy in Al-Za’atari Camp:
Distribute water containers to every refugee family in the camp.
Give each family in the camp an ID card; this card must contain basic information of the user and their daily share of water.
Set a checkpoint with qualified persons who work on organizing the process of distributing water to refugees and collecting their cards, as well as ensuring that refugees are only accessing their share of water without any excess shares.
Set a fixed schedule for refugees to access water distribution points, which in turn will give time to persons in charge to maintain an organized system that keeps track of quantities water stored, and refugees who have or have not accessed their daily share of water.
Applying control policy in Al-Za’atari camp might face many difficulties; as it might be difficult to apply it in the first stages of disaster due to chaos, including identify each family in the camp.
5. Conclusions and future research directions
This study aims to optimize the supply and distribution of drinking water into refugee camps. It was conducted on two phases, in phase 1, the quantity of water supplied is determined; based on the standards set by UNHCR. As well as the proper method to supply water to refugee camps was determined considering four possible options in the short term; using tanker trucks, ground water, ground water–pipelines and ground water–tanker trucks. The best option among them is the one that ensures the least cost and the least risk. Phase 2 is concerned with water distribution inside a camp using a modified set covering model. In addition, a control policy is proposed to ensure the fair distribution of water to all people.
5.1 Conclusions
As a conclusion of this study, the most important criteria in transporting water to refugee camps, based on risk assessment, are unclean water and inadequate water. This result was confirmed using RPN. As for the unclean water factor, risk experts agreed that transporting water using ground water–tanker truck method pollutes water the most, followed by transporting water using tanker trucks, while transporting water using ground water–pipelines is the least polluting method. This entails that the best method to transport water is by using ground water–pipelines, because it scored the lowest among all proposed methods concerning risk factor in this study. Whereas for the inadequate water quantities factor, the source of water is the main key to determine the quantities and not the method of transportation. When using tanker trucks, the source is underdetermined as opposed to using ground water, which is clearly an identifiable source. The results show that risk experts concur that transporting water using tanker trucks and ground water provides almost the same quantity of water, where the cheapest method to transport water is using groundwater–pipelines, followed by using groundwater, and then using groundwater tanker trucks. Finally, the most expensive method to transport water is using tanker trucks.
Clustering techniques are efficient in grouping instances based on a certain criterion, using these techniques help to distribute water efficiently. In our case, there was no need for clustering techniques as the camp was already divided into districts in a reasonable manner. The model developed in this study work on distributing water into refugee camp effectively; it determines the minimum number of water tanks, the optimal locations of those tanks and the allocation of all the demand to ensure that the water is distributed evenly. The MCLP–ONF model is an extension of MCLP models, where the capacity constraint is considered as well as allocation of demands to facilities. With an extra objective that determines the optimal number of water tanks based on the available demand. Al-Za’atari Refugee Camp is selected to be the case study for the research. After applying the model, it shows impressive results for distributing water throughout the camp.
5.2 Future research
Many research topics can be performed in future. Some of these topics are directly related to this work, such as studying transporting water in the long term in more details rather than concentrating is short-term distribution, pursuing a different clustering techniques to explore more solutions, investigating the capability of the methods to work in times of humanitarian crisis and making some modifications to the MCLP–ONF model, by changing the capacity to be a constraint not an input.
On the other hand, some new works can be created in this field. First, in this work, demand for drinking water is considered constant. However, in many real-life cases, demand is stochastic. Thus, this work can be extended by adopting a stochastic model to deal with such cases. Second, similar to the first point, demand could be random with unknown distribution. In such cases, stochastic modeling is invalid. Instead, robust optimization can be used to overcome the problems associated with such cases. Third, water distribution is not the only issue in humanitarian relief operations, the distribution of medications and food is also important. Accordingly, this work can be repeated for the distribution of medications and food in all cases: constant, stochastic and random demand. Fourth, Al-Za’atari Refugee Camp is not the only camp in Jordan, this provides a potential research work in other places by taking in the considerations the specific implication in each place. Finally, this work concentrates on water distribution after the disasters happen; other important field in disaster management is to make pre-plans for water, food and medications distribution based on some expectations. This includes determining the possible places for installation the tanks and install some of them, identifying the places of shelters, expecting the amount of supplies needed, etc.
The authors would like to thank the Deanship of Research at Jordan University of Science and Technology, Irbid, Jordan for the grant number (20150358, Proposal No. 390-2015) funded to perform this research.
