


Chiang Rai being an earthquake-prone city, it is essential to raise awareness about earthquake safety and readiness, especially amongst the elderly population who spend most of their time at home. The purpose of this paper is to evaluate the earthquake preparedness of elders in relation to knowledge, attitude and practice.
This was an analytic cross-sectional study. Research data were collected from 480 elders of 60 years old and above. The research instruments were questionnaires about knowledge, attitude and self-assessment of practices in earthquake situations. Data were analyzed by number, percentage and a χ2 test.
Of participants interviewed, 39.4 percent were aged between 60 and 66 years old. Overall, 94.0 percent of them had already experienced an earthquake, with 79.4 percent having experienced it in 2014. Participants had a good level of knowledge and attitude toward earthquake safety. Their practices toward earthquake readiness, however, were insufficient due to the lower practice scores (<12), especially found in the high seismic zone. The score level of knowledge, attitude and self-assessment of practice in earthquake situations showed that there is a difference in statistical significance (p<0.05).
This study focuses attention on the need to increase levels of preparedness. Safety instructions and earthquake drills should be promoted and supported in order to prepare elders for an earthquake in the study area. Research findings identified in this study will help to address the specific needs of the elderly when implementing an earthquake disaster risk reduction plan.
Introduction
An earthquake is the shaking of the earth as it releases energy and decreases stress under the earth’s surface in order to balance the crust. The occurrence of earthquakes cannot be predicted by scientists[1, 2]. The seismic waves generated from an earthquake as well as the low frequency or long period waves result in their traveling long distances. The amplified waves cause resonance in buildings, and the resulting motion are strong enough to be felt by residents and could cause damage to buildings and a danger to lives[3]. In order to minimize disaster risk and reduce the vulnerability of people and property, wise management of land and the environment, and improving preparedness and early warning for adverse events are important. Disaster preparedness identifies planning, infrastructure, knowledge and capabilities, and training as the major components of maintaining a high level of preparedness. It was reported that the 7.8 magnitude earthquake that struck Nepal on April 25, 2015 killed about 9,000 people, and left many thousands more injured and homeless[4]. Experts said that being prepared plays a very significant role in ensuring safety. The main problem with Nepal is imparting knowledge of preparedness to the common people, who are generally poor judges of their own safety and think that they are safe until an earthquake occurs[5]. A survey of knowledge, attitude and practice (KAP) about earthquakes is a tool to evaluate the population profile, including the levels of their preparedness to deal with disasters and prepare a suitable disaster risk reduction plan[6].Previous studies suggest that occupation, the location of the home, age group and education are among the factors that can influence the knowledge, attitude toward and practice of earthquake preparedness. Moreover, the World Health Organization (WHO) identified older adults as a vulnerable population who are more likely to be at greater risk in a disaster[7]. They experience more negative impacts and are more likely to have higher morbidity rates than the rest of the population in a disaster[8]. Previous research findings suggest that the location of the home, knowledge about an earthquake, attitude score and age are factors that were associated with taking precautionary measures against an earthquake[9].
Chiang Rai is a province in Thailand located in active fault zones, namely, the Phayao fault, the Mae Chan Fault and the Mae Ing fault[10]. On May 5, 2014, the Phayao fault caused the 6.3 magnitude earthquake which severely impacted on Chiang Rai, Chiang Mai, Phayao, Nan, Phrae, Lam Pang and Kamphaeng Phet. It also caused cracks in the lands, sinkholes, and wells and led to 1,285 aftershocks[11]. In order to reduce this enormous disaster risk in the future, earthquake readiness strategies have been developed by the related organizations in Thailand and neighboring ASEAN countries who are working to reduce the adverse results of a reoccurrence[12]. Projects to support earthquake readiness strategies should be developed in order to reduce earthquake damage as much as possible. Preparations must also be made with the area and community in mind. Additionally, the population, and particularly the elders living in earthquake-prone areas should be made aware of survival tips. It is of utmost importance to handle emergency situations appropriately and accurately. Since Thailand is moving toward becoming an aging society[13], a program focused on Thai elders should be promoted in order to get ready for uncommon situations. The project for earthquake preparation provided by the Department of Local Administration is absolutely important and appropriate to the current elders in society and will inevitably be important to the entire population.
It is proven that earthquakes are more likely to occur in the same places[14], making Chiang Rai a city at risk. Apart from implementing an effective earthquake preparation project, the population must also be able to survive in these situations. However, there is little research conducted by age group, especially amongst the elderly, regarding disaster management. This situation is further compounded by a lack of literature on enhancing disaster risk reduction from the unique perspectives of the elderly. From this standpoint, this research aimed to evaluate KAPs among the elderly people in Chiang Rai in the context of their distance from an active fault in the high, medium and low seismic zones. The results would be useful to the Department of Local Administration or other organizations as it can be used as a model to form a strategy on earthquake survival planning.
Methodology
Research design
This research is an analytic cross-sectional study collecting data in the earthquake-prone risk area of Chiang Rai.
Study area
This study collected data in six districts of Chiang Rai in 2017. The areas were classified into three groups, namely, the high seismic zone group, the medium seismic zone group and the low seismic zone group.
Study sampling
We followed a two-step sampling process; the calculation of the sample size and the equation for calculating the sample was taken from Cochran (1963) which was cited in Watthana[15] (see Equation (1)) by using the prevalence of earthquake experienced elders as 0.5. The calculated sample size was 441 (with 15 percent added to make up an additional margin if needed). It was therefore determined to use 480 samples for this research.
The 480 elders were selected by random sampling technique with the selection criterion of participants being more than or equal to 60 years old who had been living in Chiang Rai for at least one year. Because the research aimed to study the KAP levels of the elderly for preparedness in a future earthquake, the researchers were not concerned with any recall bias of the earthquake in Chiang Rai three years previously. Furthermore, the sample size of 480 was distributed by area and the intensity and scale of the shaking. There were three criteria of sampling areas of Chiang Rai based on the Mercalli (MM) Intensity Scale[16] of each area. The detail of the intensity scale and the sampling area is shown in Table I. Only four villages from each district (see Table I) were selected with 20 elders randomly selected from each village resulting in 160 samples in each area (2 districts × 4 villages × 20 elders =160 samples):
where n = sample size, P = prevalence, Z=1.96, p=0.5, e=0.05.
Mercalli intensity scale and sampling
| Level | Shaking | Description/damage | Sampling areas | Samples |
|---|---|---|---|---|
| I–III | High | People both indoors and outdoors can feel the shaking and the trembling caused by the cracks. Buildings are damaged and water is shaken | Mae Lao and Phan districts | 160 |
| IV–V | Low | Most people can feel the trembling of buildings and in a car | Wiang Chai and Muang districts | 160 |
| VI–X | Non-intensity | The trembling is so little that only some people can feel it | Doi Luang and Mae Chan districts | 160 |
| 480 |
Research instruments
Questionnaires were used for the research tools. They surveyed the knowledge, attitude and the self-assessment in their practice of earthquake situations. The questionnaire consisted of four sections. These were: general information about the participant; test of knowledge about earthquake readiness (14 items); test of attitude about earthquake preparedness (10 items); and self-assessment of practice in earthquake situations. The fourth part comprised a 14-item checklist. Questionnaires were checked and verified by three experts who were experienced in the subject of earthquake readiness and experienced in evaluating KAPs of earthquake safety. Index of Item-Objective Congruence of the research instrument was 0.95. In addition, the formula of Cronbach’s α was used to check the validity of the questionnaires in 30 elders living in Mae Chan district. Its validity of knowledge, attitude, and practices were 0.83, 0.75 and 0.75, respectively.
Measurement
The interviewer posed nine questions to assess the demographic characteristics of the participants. These included: age, gender, occupation, income, education, caregiver status and previous earthquake experiences.
Regarding KAP about earthquake preparedness, 14, 10 and 12 questions, respectively, were asked to evaluate the participants’ KAPs. The knowledge question included general knowledge and knowledge of practices for earthquake mitigation. The attitude questions aimed to investigate the extent of earthquake preparedness whilst the practice questions were divided into three situations, namely, before, during and after an earthquake.
Data collection
Primarily, the research team wrote a letter to the Chief Executive of the SAO and Chief of the sub-district municipality requesting permission to collect the data. In addition, the heads of each village were contacted in order to explain the purpose of the research and ask for their cooperation. Before the fieldwork, all researchers were trained to accurately and appropriately interview participants and correctly deploy the questionnaires. Before commencing the interview, the research purpose and methodology was explained to all participants in terms of its background, purpose, data collection, advantages and the effect. All participants were then requested to sign the consent form. The team of researchers interviewed 480 elders for 30–40 min in the six districts of Mae Lao, Phan, Wiang Chai, Muang, Doi Luang and Mae Chan districts.
Data analysis
The data were checked and analyzed using SPSS version 20, 2014 (SPSS, Chicago, IL). General information of samples was analyzed by descriptive statistics, namely, frequency, percentage, mean and standard deviation. Data of knowledge, attitude and the practices in earthquake situations were analyzed by the criteria of knowledge level[17], attitude and practices[14]. Inferential statistics (using a χ2 test) were employed to examine the difference between KAPs in earthquake situations.
Ethical consideration
This research was certified by the Human Research Ethical Considerations Board of Mae Fah Luang University on June 2, 2017. The document number is 061/2560.
Results
Of the 480 elders who were interviewed, results showed that 57.1 percent were females. Their ages were ranked into five groups. 39.4 percent are the oldest participants, who are between 60 and 66 years old. The mean is at 70.50 (SD=7.62). Of them, 68.8 percent graduated at primary school level; 67.1 percent of them were unemployed; 76.2 percent of them received an old age allowance as their main income; and 42.1 percent of them were looked after by their children.
Regarding earthquake experience, 94.0 percent of participants had experience of a previous earthquake, and 79.4 percent of them experienced it in 2014. Besides, 46.3 percent of participants followed the earthquake news via television. Only 23.8 and 4.4 percent of them received the news from the head of the village and wire broadcasting service, respectively (Table II).
General information of participants
| Area | ||||
|---|---|---|---|---|
| High seismic zone | Medium seismic zone | Low seismic zone | Total | |
| General information | n (%) | n (%) | n (%) | n (%) |
| Gender | ||||
| Male | 73 (45.6) | 69 (43.1) | 64 (40) | 206 (42.9) |
| Female | 87 (54.4) | 91 (56.9) | 96 (60) | 274 (57.1) |
| Age (years) | ||||
| 60–66 | 67 (41.9) | 59 (36.9) | 63 (39.4) | 189 (39.4) |
| 67–73 | 45 (28.1) | 45 (28.1) | 45 (28.1) | 135 (28.1) |
| 74–80 | 28 (17.5) | 39 (24.4) | 32 (20.0) | 99 (20.6) |
| 81–87 | 18 (11.3) | 12 (7.5) | 19 (11.9) | 49 (10.2) |
| 88–94 | 2 (1.3) | 5 (3.1) | 1 (0.6) | 8 (1.7) |
| Mean (SD) 70.50 (7.62) | ||||
| Min, Max 93, 60 | ||||
| Occupation | ||||
| Unemployed | 112 (70.0) | 103 (64.4) | 107 (66.9) | 322 (67.1) |
| Pensioner | 2 (1.3) | 1 (0.6) | 3 (1.9) | 6 (1.3) |
| Merchant | 5 (3.1) | 10 (6.3) | 17 (10.6) | 32 (6.7) |
| Farmer | 33 (20.6) | 34 (21.3) | 24 (15.0) | 91 (19.0) |
| Fisherman | 0 (0.0) | 1 (0.6) | 0 (0.0) | 1 (0.2) |
| Part-time self-employed | 7 (4.4) | 10 (6.3) | 8 (5.0) | 25 (5.2) |
| Business | 1 (0.6) | 0 (0.0) | 1 (0.6) | 2 (0.4) |
| Janitor | 0 (0.0) | 1 (0.6) | 0 (0.0) | 1 (0.2) |
| Main income (more than one item) | ||||
| No income | 3 (1.5) | 1 (0.5) | 2 ((1.0) | 6 (1.0) |
| Career | 37 (18.4) | 29 (14.6) | 36 (17.9) | 102 (17.0) |
| Pension | 1 (0.5) | 2 (1.0) | 4 (2.0) | 7 (1.2) |
| Old age allowance | 154 (76.6) | 154 (77.4) | 150 (74.6) | 458 (76.2) |
| Grandparents | 3 (1.5) | 5 (2.5) | 5 (2.5) | 13 (2.2) |
| Disabled persons allowance | 3 (1.5) | 8 (4.0) | 4 (2.0) | 15 (2.5) |
| Level of education | ||||
| Uneducated | 41 (25.6) | 27 (16.9) | 49 (30.6) | 117 (24.4) |
| Primary school | 111 (69.4) | 118 (73.8) | 101 (63.1) | 330 (68.8) |
| Middle school | 3 (1.9) | 2 (1.3) | 4 (2.5) | 9 (1.9) |
| High school | 3 (1.9) | 12 (7.5) | 3 (1.9) | 18 (3.8) |
| Vocational Certificate or Vocational Diploma | 2 (1.3) | 0 (0.0) | 2 (1.3) | 4 (0.8) |
| Bachelor’s degree or higher | 0 (0.0) | 1 (0.6) | 1 (0.6) | 2 (0.4) |
| Main caregiver | ||||
| Alone | 20 (12.5) | 12 (7.5) | 19 (11.9) | 51 (10.6) |
| Couples | 73 (45.6) | 72 (45.0) | 50 (31.3) | 195 (40.6) |
| Children | 56 (35.0) | 70 (43.8) | 76 (47.5) | 202 (42.1) |
| Niece/nephew | 8 (5.0) | 5 (3.1) | 13 (8.1) | 26 (5.4) |
| Siblings | 3 (1.9) | 1 (0.6) | 2 (1.3) | 6 (1.3) |
| Earthquake experience | ||||
| Yes | 160 (100) | 151 (94.4) | 140 (87.5) | 451 (94.0) |
| No | 0 (0.0) | 9 (5.6) | 20 (12.5) | 29 (6.0) |
| Earthquake experience period (year) | ||||
| 2011 | 10 (5.9) | 17 (10.4) | 60 (34.3) | 87 (17.1) |
| 2013 | 0 (0.0) | 0 (0.0) | 7 (4.0) | 7 (1.4) |
| 2014 | 160 (94.1) | 141 (86.0) | 103 (58.9) | 404 (79.4) |
| 2015 | 0 (0.0) | 0 (0.0) | 4 (2.3) | 4 (0.8) |
| 2016 | 0 (0.0) | 6 (3.7) | 1 (0.6) | 7 (1.4) |
| Information/news sources | ||||
| Head of village | 38 (23.8) | 20 (12.5) | 11 (6.9) | 69 (14.4) |
| Wire broadcasting | 7 (4.4) | 14 (8.8) | 1 (0.6) | 22 (4.6) |
| Television | 114 (71.3) | 123 (76.9) | 129 (80.6) | 366 (46.3) |
| Radio | 0 (0.0) | 0 (0.0) | 1 (0.6) | 1 (0.2) |
| Unknown | 1 (0.6) | 3 (1.9) | 18 (11.3) | 22 (4.6) |
Knowledge about earthquake readiness
Most of the participants knew how to survive when an earthquake occurs. There are three main aspects which were most frequently correct. First, 94.6 percent of participants accurately answered question 7, about earthquakes at different damage levels causing distinct effects toward human lives and their assets. In contrast, they mostly failed question 6 about the occurrence of earthquakes being predictable with only 62.5 percent of them answering correctly. Comparing the groups, the high seismic zone group was the most knowledgeable as shown in Table III.
Knowledge about earthquake readiness
| Number of correct answerers n (%) | ||||
|---|---|---|---|---|
| High seismic zone | Medium seismic zone | Low seismic zone | Total | |
| Facts | n (%) | n (%) | n (%) | n (%) |
| General knowledge | ||||
| 1. Faults cause earthquake | 130 (81.3) | 87 (54.4) | 104 (65.0) | 321 (66.9) |
| 2. Chiang Rai is located in the faults | 132 (82.5) | 103 (64.4) | 108 (67.5) | 343 (71.5) |
| 3. Earthquake intensity is measured by human sensation and buildings trembling | 159 (99.4) | 149 (93.1) | 145 (90.6) | 453 (94.4) |
| 4. An earthquake damage houses, streets, water supply and electricity | 157 (98.1) | 135 (84.4) | 145 (90.6) | 437 (91.0) |
| 5. An earthquake can cause injuries or kill humans | 155 (96.9) | 127 (79.4) | 147 (91.9) | 429 (89.4) |
| 6. Earthquake occurrence can be predictable | 117 (73.1) | 85 (53.1) | 98 (61.3) | 300 (62.5) |
| 7. Earthquakes at different damage level cause distinct effects toward human lives and assets | 157 (98.1) | 146 (93.1) | 151 (94.4) | 454 (94.6) |
| Knowledge about practices of earthquake experience | ||||
| 1. Dilapidated houses can be ruined by an earthquake | 160 (100) | 146 (93.1) | 155 (96.9) | 461 (96.0) |
| 2. During an earthquake, falling objects from a high cupboard could possibly block the exit and severely injure humans | 160 (100) | 152 (95.0) | 153 (95.6) | 465 (96.9) |
| 3. The turning on of a stove and lighting of a flame during an earthquake occurrence causes explosions | 125 (78.1) | 98 (61.3) | 114 (71.3) | 337 (70.2) |
| 4. People should find a shelter protecting their head when an earthquake occurs | 133 (83.1) | 132 (82.5) | 126 (78.8) | 391 (81.5) |
| 5. People should stay away from mirrors or glass ornaments or furniture when an earthquake occurs | 160 (100) | 152 (95.0) | 145 (90.6) | 457 (95.2) |
| 6. People should stay away from concrete walls when an earthquake occurs | 160 (100) | 146 (91.3) | 144 (90.0) | 450 (93.8) |
| 7. People should run away from houses when an earthquake occurs | 155 (96.5) | 147 (91.9) | 141 (88.1) | 443 (92.3) |
Attitude about earthquake preparedness
The participants possessed a good level of knowledge about earthquake preparedness. Of them, 80 percent accurately answered the questionnaire. However, most of them had the wrong understanding about certain aspects as they incorrectly stated that people should immediately go back into the buildings after an earthquake. This result for question 9 is shown in Table IV.
Information of earthquake preparedness attitude
| Good attitude n (%) | ||||
|---|---|---|---|---|
| High seismic zone | Medium seismic zone | Low seismic zone | Total | |
| Facts | n (%) | n (%) | n (%) | n (%) |
| 1. A good earthquake preparedness plan reduces earthquake effects | 119 (94.4) | 145 (90.6) | 142 (88.8) | 406 (84.6) |
| 2. Governmental organizations should prepare clean water and sufficient food for the population after an earthquake | 157 (98.1) | 155 (96.9) | 160 (100) | 472 (98.3) |
| 3. Governmental organizations accommodate evacuation centers | 158 (98.8) | 154 (96.3) | 159 (99.4) | 471 (98.1) |
| 4. Regular checking and repairing of cracks on the walls possibly prevent building collapse | 123 (76.9) | 136 (85.0) | 147 (91.6) | 406 (84.6) |
| 5. Participating in earthquake drills could make you practice safety when an earthquake occurs | 146 (91.3) | 147 (91.9) | 148 (92.5) | 441 (91.9) |
| 6. You should prepare an emergency bag, so you can survive in the event of an earthquake | 155 (96.9) | 137 (85.6) | 157 (98.1) | 449 (93.5) |
| 7. Staying tuned on earthquake forecasts and earthquake predictions from reliable sources such as a village leader and disaster warning center helps you to cope with an earthquake in time | 159 (99.4) | 155 (96.9) | 159 (99.4) | 473 (98.5) |
| 8. During an earthquake, you should first take care of yourself before helping others | 153 (95.6) | 151 (94.4) | 148 (92.5) | 452 (94.2) |
| 9. After an earthquake, you should not immediately get back into the house | 76 (47.6) | 68 (42.5) | 77 (48.1) | 221 (46.0) |
| 10. After the earthquake, you should check your family members | 158 (98.8) | 157 (98.6) | 159 (99.4) | 474 (98.8) |
Self-assessment of practice in earthquake situations
It is shown that all groups had fewer scores in this section of the questionnaire. The least score was in question 5 where only 8.1 percent of the participants joined in earthquake drills. In addition, for question 4, only 27.5 percent of them used to obtain information about practice for earthquake experience from their local authority. For question 6, just 28.8 percent of participants consulted and planned with their family about the shelter and duty for survival in case of an earthquake. Table V is the conclusion in this part Table V.
Information of practice in earthquake situations
| Good practice n (%) | ||||
|---|---|---|---|---|
| High seismic zone | Medium seismic zone | Low seismic zone | Total | |
| Facts | n (%) | n (%) | n (%) | n (%) |
| Before earthquake | ||||
| 1. Your house is checked and cracks have been repaired so it is earthquake resistant | 83 (51.9) | 93 (58.1) | 84 (52.5) | 260 (54.2) |
| 2. You always have a flashlight at home and never forget its place | 148 (92.5) | 143 (89.4) | 150 (93.8) | 441 (91.9) |
| 3. Your stuff is always managed nice and tidy | 153 (95.6) | 138 (86.3) | 148 (92.5) | 439 (91.5) |
| 4. You obtain information about earthquake preparedness from your local organization | 27 (16.9) | 37 (23.1) | 68 (42.5) | 132 (27.5) |
| 5. You participate in earthquake drills | 3 (1.9) | 2 (1.3) | 34 (21.3) | 39 (8.1) |
| 6. You consult and plan with family about the duty and shelter for survival in case of an earthquake | 12 (7.5) | 50 (31.3) | 76 (47.5) | 138 (28.8) |
| 7. You have an emergency bag which contains essential stuff such as food and a torch | 93 (58.1) | 100 (62.5) | 93 (58.1) | 286 (59.6) |
| During the earthquake | ||||
| 8. You are conscious and not nervous during an earthquake | 73 (45.6) | 125 (78.1) | 137 (85.6) | 335 (69.8) |
| 9. You promptly turn off your stove and valve when you feel the shaking of an earthquake | 113 (70.6) | 132 (82.5) | 142 (88.8) | 347 (80.6) |
| 10. During the earthquake, you stay in a safe shelter such as under the table in a strong building | 115 (71.9) | 103 (64.4) | 92 (57.5) | 310 (64.6) |
| 11. You immediately get out of the house when the shaking stops | 137 (85.6) | 126 (78.8) | 103 (63.8) | 365 (76.0) |
| 12. You will hurry out to a bare place far from buildings | 144 (90.6) | 137 (85.6) | 119 (74.4) | 400 (83.3) |
| After earthquake | ||||
| 13. You check your house before going in | 152 (95.0) | 143 (89.4) | 139 (96.9) | 434 (90.4) |
| 14. You receive the news about rescue from the governmental organizations | 159 (99.4) | 123 (76.9) | 137 (85.6) | 419 (87.3) |
The difference of KAP in each area
A comparison of the KAP level of earthquake preparedness in each area shows a difference in the statistical significance (p<0.05). The high seismic zone had the highest scores, 89.4 percent, in the earthquake knowledge part. The highest attitude score level of 94.4 percent belonged to the low seismic zone group and means that they have the most accurate attitude about earthquake readiness. The low seismic zone has the best score, 46.5 percent, for earthquake experience practices, as shown in Table VI.
The comparison of knowledge, attitude and practice in each area
| n (%) | |||||
|---|---|---|---|---|---|
| Variables | High seismic zone | Medium seismic zone | Low seismic zone | Total χ2 | p-value |
| Knowledge | |||||
| Good (⩾12 scores) | 143 (89.4) | 87 (54.4) | 100 (62.5) | 49.978 | <0.001* |
| Insufficient (⩽11 scores) | 17 (10.6) | 73 (45.6) | 60 (37.5) | ||
| Attitude | |||||
| Good (⩾8 scores) | 135 (84.4) | 145 (90.6) | 151 (94.4) | 8.910 | 0.012* |
| Insufficient (0–7 scores) | 25 (15.6) | 15 (9.4) | 9 (5.6) | ||
| Practice | |||||
| Good (⩾12 scores) | 23 (14.4) | 46 (28.8) | 75 (46.9) | 40.417 | <0.001* |
| Insufficient (0–11 scores) | 137 (85.6) | 114 (71.3) | 85 (53.1) | ||
Note: *Significant at p-value <0.05
Discussion
Most participants had a good level of knowledge about earthquake preparedness. They may have been trained in how to survive in earthquake situations after the previous earthquake. So, they have an awareness of how to practice in an emergency situation. This finding confirms the research of Becker et al.[18] who mentioned that a person who directly experienced an earthquake situation will be wiser on earthquake experience and more conscious about it. Similarly, Sothnasatien[19] states that humans primarily learn via their experience.
In addition, participants have a good attitude about earthquake readiness due to the fact that they already experienced an earthquake and were directly affected. This idea relates to the study of Nelson and Quick[20] (cited in Jharidool, 2017, 7) which stated that attitude was influenced by direct experience and social learning. However, the participants’ attitude is not proper in some aspects, for example, the belief that people should promptly get back into the house after an earthquake is incorrect. Only 46.0 percent of them answered correctly on this question. Kantakanishtha[21] mentioned that earthquake preparedness of people was not enough because, in spite of experiencing an earthquake, they had not been severely affected.
Additionally, the correct and appropriate practices in earthquake situations were at a low level. This study found that, before the occurrence of an earthquake, the elders had not been given the correct guidance and instructions about earthquake preparedness and the process of participating in earthquake drills. Moreover, they failed to have a family meeting in order to plan the shelter and their duties in the event of an earthquake. When there is a lack of the above-mentioned activities, examples of inappropriate earthquake preparedness is likely to be higher. The study of Mala et al.[22] confirmed the above statement that building awareness toward preparedness of natural disasters helps people to cope with it more efficiently. Tuohy et al.[23] also noted that social readiness is essential for elders to appropriately handle an earthquake situation. Social readiness includes building appropriate rescue systems as well as maintaining good relations among neighbors. People, especially elders, could get help from neighbors. Social readiness is not only helpful for earthquake readiness or other emergencies but also helps with maintaining the health and welfare of older adults.
Three groups of participants were compared in order to study their practices in an earthquake situation. It showed that the practices of the high seismic zone group were at a good level. This contrasts with the study of Tuohy et al.[23] which stated that earthquake preparedness depended on the elder’s experiences. That is, an elder who already confronted earthquake situations would know how to survive in the time of an earthquake. Oral et al.[24] stated that an individual’s earthquake preparedness is based on prior experience. After analyzing the results, it showed that the scores of the high seismic zone group in relation to their attitudes are lower than for the low seismic zone group. Similarly, Ostad Taghizadeh et al.[25] mentioned that populations in the high seismic zone had earthquake preparedness levels that were lower than those who lived in the low seismic zone. The results showed that low levels of knowledge caused insufficient earthquake readiness. Moreover, education and age indicated attitudes toward earthquake preparedness. On the other hand, this does not agree with the study of Alan et al.[26], which stated that a person living in the high seismic zone was wiser than a person living in the low seismic zone in terms of getting ready for an earthquake.
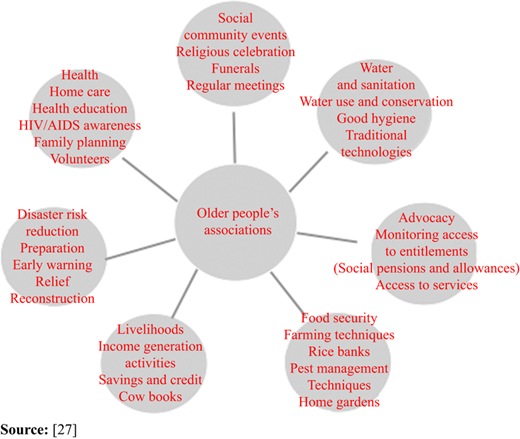
From the results, it is advisable to establish the need for disaster and earthquake training and increase preparedness by introducing workshops to enhance skills in preparedness. Furthermore, due to the high level of knowledge amongst elders in this area, it is important to consider the third UN World Conference on Disaster Reduction Framework that states[27]; “Older persons have years of knowledge, skills and wisdom, which are invaluable assets to reduce disaster risk, and they should be included in the design of policies, plans and mechanisms, including for early warning” (Figure 1). The elderly population are key agents for positive change in disaster risk reduction and management efforts. The familiar role of the elders should be taken into consideration and addressed, particularly so that their voice can be heard and also so their positive participation can help to mitigate the impacts of disasters.
Conclusion
The elders have a high knowledge level of earthquake readiness. Their attitude toward earthquake preparedness is satisfactory. In contrast, the correct and appropriate practices are at a low level. In particular, they lack safety instructions pertaining to earthquakes from the Department of Local Administration, earthquake drill participation and family meetings. Furthermore, their KAPs of earthquake preparedness are different in the statistical significance.
The authors would like to specially thank the chief executive of the SAO, chief of the sub-district municipality, village leaders and all the participants for their collaboration and invaluable assistance. In addition, the authors thank the National Research Council of Thailand (NRCT), Mae Fah Luang University and Center of Excellence for the Hill tribe Health Research for helping to conduct the research.

