This study aims to explore the factors influencing tourist consumers to use generic social networking sites as tourism platforms.
Data collected from Chinese consumers who use social networking sites for tourism purposes were used to test an extended version of the Unified Theory of Acceptance and Use of Technology 2, which adds two new constructs – platform reputation and social interactive value – to the existing framework.
The findings indicated that hedonic motivation is the strongest factor influencing behavior, followed by performance expectancy and social interactive value.
This research provides a workable framework within the domain, guiding developers and operators of social networking sites. In addition, it provides strategic guidance for tourism marketers, helping them leverage social networking sites more effectively for marketing purposes.
This study enhances the attractiveness and practicality of social networking sites in tourism scenarios, effectively promoting the digital development process of the tourism industry.
1. Introduction
With the rapid development of digital technology, the tourism industry is undergoing a transformation at an unprecedented rate. Social Networking Sites (SNSs) have emerged as a crucial component of the digital tourism ecosystem, gradually changing the way tourists acquire information, make decisions and experience their travels. In recent years, an increasing number of studies have demonstrated that the application of SNSs in tourism services is becoming more widespread, and their influence is growing significantly. According to the latest business reports and studies, by January 2024, there were 5.35 billion internet users worldwide, accounting for 66.2% of the global population. Of these, 5.04 billion individuals, or 62.3% of the world’s population, were active on social media platforms. The average daily social media (SM) usage worldwide was 143 min (Statista, 2024a, 2024b). Global travel expenditure is expected to reach $2tn in 2024 (TravelPerk, 2024). As the tourism market continues to expand, the role of SNSs in tourism services has become increasingly significant. The market for online travel agents (OTAs) is expanding in line with the growth of the tourism industry, becoming an important tool for travel consumers to plan and simplify their trips. OTAs serve as the primary channels for travel planning and reservations, but the initial sparks of inspiration and ideas often come from other sources, notably SM platforms. Particularly when it comes to the Chinese market, Chinese tourists are skilled in mobile technology and receptive to technology solutions to enrich their travel experience. Platforms such as Xiaohongshu, Douyin, WeChat and Weibo are instrumental in providing travel inspiration (The WeChat Agency, 2023)
SM/SNSs are platforms that connect users via internet technology, facilitating the sharing of information and social interaction. Generic SNSs like Facebook and Instagram were not originally designed for tourism, but their role in this industry is significant. Users on these platforms share travel photos, stories and experiences, providing a wealth of information for other tourists. Other users can browse this content for inspiration and even contact the sharers directly on the platform for more information. OTAs focus on providing one-stop travel product booking services, meeting users’ practical needs with efficient and convenient booking processes and a wide range of travel resources. Platforms like Ctrip and Qunar, with their robust booking systems and extensive supplier networks, help users easily arrange their trips. Despite clear differences in functionality, user experience and business models, the line between these two types of platforms is blurring as the tourism industry evolves. They are increasingly complementary. SNSs may integrate booking functions to offer more comprehensive services, while OTAs may enhance cooperation with SNS platforms to attract more traffic. This integration will better meet users’ diverse needs in travel planning and experience and jointly promote the continuous development of the tourism industry.
In this context, digital trust and online reputation play a crucial role in shaping tourists’ behavior. Trust in the digital environment is crucial for users to engage with SNSs and OTAs, as it influences their willingness to share personal information, make bookings and rely on user-generated content (Kitsios et al., 2022). Online reputation, driven by reviews and ratings, further enhances the credibility of destinations and services, guiding tourists’ choices and influencing their overall travel experience (Rodríguez-Díaz et al., 2018).
Studies have explored SM/SNSs in tourism, showing how user generated content (UGC) creation and shared travel experiences influence potential tourists’ decisions (Cheung et al., 2021; Wang et al., 2022; Kitsios et al., 2022). Many scholars have studied how tourists use SM to draw travel inspiration, make destination choices and plan itineraries (Zhou et al., 2023; Liu et al., 2020; Pan et al., 2021). Some studies have explored the use of SM for destination marketing, enhancing visibility and attracting tourists (Todua, 2019; Kumar et al., 2021). Some scholars studied how the tourism industry can provide immediate customer service through SM, responding to tourists’ needs and questions (Sotiriadis, 2017; Harrigan et al., 2017). However, empirical studies rarely focus on SM/SNSs as platforms for providing tourism services. Moreover, most existing research has focused on Tourism-specific platforms, while relatively little research has been conducted on generic SNSs. This limits the overall understanding of the role of SNSs in the travel decision-making process.
Our study addresses the above knowledge gap by exploring the elements influencing consumers to use generic SNSs as tourism platforms. The study’s research question is: “What are the key factors that influence tourist consumers to use generic social networking sites as tourism platforms?” To address this question, this paper adopts an improved version of the Unified Theory of Acceptance and Use of Technology (UTAUT2). This model has been endorsed in tourism literature as a framework for consumption. A research model was drawn on this theory and tested through an empirical study within the Chinese context. This research contributes to the theoretical framework within the field and provides guidance for SNS developers and operators. In addition, it provides strategic guidance for tourism marketers, helping them leverage SNSs more effectively for marketing purposes.
As discussed above, we examined how the rise in Internet users and the growing popularity of SNSs have made them a crucial component of tourism information acquisition, decision-making and the travel experience. The boundaries between OTAs and SNSs are blurring, and their convergence in terms of functionality and user experience provides new opportunities for the development of the tourism industry. To gain a deeper understanding of these phenomena, the literature review will focus on the following two principal aspects.
2. Literature review
2.1 Social networking sites and tourism-specific digital platforms
SNSs and tourism-specific digital platforms have significant differences in terms of functionality, user behavior and market positioning. However, as the tourism industry evolves, the connections between them are becoming increasingly stronger. SNSs were initially designed for personal social interaction and information sharing (Kitsios et al., 2022). Although these platforms were not specifically designed for tourism, users can share travel experiences, thereby providing travel inspiration for others (Choi, 2021). Tourism-specific digital platforms refer to the tourism management platforms based on the internet and information technology, which integrate the functions of tourism information, tourism products, tourism services, tourism marketing, tourism management and other aspects into one and provide tourism enterprises with comprehensive digital services and management (World Tourism Organization, 2023). Their design aims to meet the specific needs of tourists by providing one-stop travel planning and booking services.
In terms of user behavior, users on SNSs primarily engage in social interaction and information sharing (Gao et al., 2022). They maintain contact with friends and family by posting photos, videos and comments. When it comes to travel, users may share their travel experiences and photos to gain travel inspiration and advice. Conversely, users on tourism-specific digital platforms mainly engage in travel planning and booking (Pinto and Castro, 2019). The user behavior on these platforms is more goal-oriented, focusing on completing travel plans.
Regarding market positioning, SNSs are positioned to provide broad social interaction and information-sharing services. Their user base is extensive, encompassing individuals of various ages, interests and backgrounds. At the same time, tourism-specific digital platforms are positioned to meet the specific needs of tourists by offering one-stop travel planning and booking services. Their users are primarily tourists and travel enthusiasts who use the platforms to obtain travel information, compare prices and make bookings.
As the tourism industry progresses, the functionality and market positioning of SNSs and tourism-specific digital platforms are gradually converging. SNSs are expanding into the tourism market by integrating travel booking functions. Meanwhile, tourism-specific digital platforms are strengthening their cooperation with SNSs to leverage the influence of SNSs and attract more users. This integration not only provides users with more comprehensive services but also offers new opportunities for the development of the tourism industry.
2.2 The unified theory of acceptance and use of technology 2 model and tourism research
The UTAUT2 model is an extension of the Unified Theory of Acceptance and Use of Technology (UTAUT), developed by Venkatesh et al. in 2012, which includes hedonic motivation (HM), price value and habit to the original four constructs: performance expectancy, effort expectancy, social influence (SI) and facilitating conditions (FC). It provides a systematic framework for analyzing the diverse factors that influence users’ behavioral intentions (BI) and actual use behaviors in the context of adopting new technologies. The model has been validated through empirical studies and adopted by numerous researchers (Gupta and Dogra, 2017; Kamboj and Joshi, 2020; Venkatesh et al., 2012).
The UTAUT2 model has been widely applied in information systems research, particularly evaluating users’ acceptance and usage intentions toward new technologies, systems or applications (Tamilmani et al., 2021). It also explores users’ acceptance and continued use of SM, instant messaging tools and other communication technologies (Praveena and Thomas, 2018). Numerous studies have employed the UTAUT2 model to investigate the factors influencing consumer acceptance of technology systems and platforms (Zhou et al., 2023). In the context of tourism, researchers have studied mapping apps (Gupta and Dogra, 2017) and UGC (Herrero et al., 2017).
While the UTAUT2 model provides a robust framework for understanding user behavior, it is essential to recognize that specific contexts may require additional variables to capture the full spectrum of influencing factors. In the context of tourism platforms, two critical factors that have gained significant attention are platform reputation (PR) and social interactive value (SIV). PR is vital in tourism as it reflects user trust and satisfaction. High-reputation platforms attract users due to their perceived reliability and trustworthiness, which are built through consistent performance, positive reviews and excellent customer service. Integrating PR into the UTAUT2 model helps understand its impact on user intentions to use SNSs as tourism platforms. SIV is key for tourism platforms, especially SNSs, as it enhances user experience through interactions, shared experiences and feedback. This social aspect boosts user engagement and fosters a sense of community. In tourism, it significantly influences platform use decisions by providing a space to share travel experiences, seek recommendations and connect with similar tourists. Adding this to the UTAUT2 model provides insights into how social dynamics influence user behavior and loyalty.
3. Developing research hypotheses
3.1 Performance expectancy
Venkatesh et al. (2012) defined performance expectancy (PE) as “the degree to which using a technology will provide benefits to consumers in performing certain activities” (p. 159). This construct has been identified as the most powerful predictor of behavioral intentions in several contexts, including mobile wallets (Nafiz Rayun et al., 2025), mapping apps (Gupta et al., 2018) and social network sites (Herrero et al., 2017). The following hypothesis is therefore proposed:
Performance expectancy positively influences consumers’ intention to use a generic SNS as a digital tourism platform.
3.2 Effort expectancy
Effort expectancy (EE) is defined as “the degree of ease associated with consumers’ use of technology” (Venkatesh et al., 2012, p. 159). Tourists tend to be more inclined to embrace simple, intuitive technology and the least expensive to use. Numerous studies have demonstrated that EE has a substantial impact on BI in various tourism contexts and settings (Omar et al., 2025; Romero-Charneco et al., 2025; Nafiz Rayun et al., 2025). The following hypothesis is therefore proposed:
EE positively influences consumers’ behavioral intention to use a generic SNS as a digital tourism platform.
3.3 Social influence
SI is conceptualized as “the extent to which consumers perceive that important others believe they should use a particular technology” (Venkatesh et al., 2012, p. 159). Recommendations from friends and family, as well as online reviews, may influence tourists’ decisions to use technology for travel planning, booking and sharing experiences. Many studies have confirmed that SI has a significant impact on BI in the context of the adoption of travel apps (Gupta et al., 2018), mobile apps (Marinković et al., 2025) and TikTok in tourism destination choice (Zhou et al., 2023). Thus, the following hypothesis is proposed:
SI positively influences consumers’ intention to use a generic SNS as a digital tourism platform.
3.4 Facilitating conditions
FC refer to “consumers’ perceptions of the resources and support available to perform a behavior” (Venkatesh et al., 2012, p.162). In our study, FC can be understood as the perceived external support and availability of resources that tourists experience when using SNSs as a tourism platform. Venkatesh et al. (2012) have noted that FC not only affect BI but also have a direct impact on actual behavior (AB). This relationship has been tested and validated in empirical studies (Gupta and Dogra, 2017; Omar et al., 2025). Thus, the following hypothesis is proposed:
FC positively influence consumers’ intention to use a generic SNS as a digital tourism platform.
Facilitating conditions positively influence the consumer’s use behavior of a generic SNS as a tourism digital platform.
3.5 Hedonic motivation
HM is defined as the “fun or pleasure derived from using a technology” (Venkatesh et al., 2012, p. 161). Empirical research has demonstrated that HM significantly influences the BI and AB of tourism technology (Medeiros et al., 2024; Tamilmani et al., 2019). In line with Self-Determination Theory, HM can influence users’ behavior on SNSs by enhancing their intrinsic motivation and sense of autonomy (Deci and Ryan, 1985). HM on SNSs is mainly driven by intrinsic motivation, as the entertaining and interactive content meets users’ intrinsic needs, enhancing their intention to use and ongoing engagement. Thus, the following hypothesis is advanced:
HM positively influences consumers’ intention to use a generic SNS as a tourism digital platform.
HM positively influences the consumer’s use behavior of a generic SNS as a tourism digital platform.
3.6 Price value
Price value (PV) is defined as “consumers’ cognitive trade-off between the perceived benefits of the applications and the monetary cost for using them” (Venkatesh et al., 2012, p. 161). Empirical research has demonstrated that PV significantly influences the BI of tourism technology (Ridzky and Sarno, 2020; Gupta and Dogra, 2017). Consumers’ willingness to use SM/SNSs will be enhanced if they perceive that the service or experience they receive through SM/SNSs is attractive in terms of price and provides them with value for money or better value. Thus, the following hypothesis is advanced:
PV positively influences consumers’ intention to use a generic SNS as a tourism platform.
3.7 Habit
Habit (HA) is defined as “the extent to which people tend to perform behaviors automatically because of learning” (Venkatesh et al., 2012, p. 161). Existing studies established and supported that HA has a considerable effect on BI and AB in the context of smartphone apps (Gupta et al., 2018), TikTok in tourism destination choice (Zhou et al., 2023) and SNSs (Herrero et al., 2017). Thus, the following hypothesis is advanced:
Habit positively influences consumers’ intention to use a generic SNS as a tourism digital platform.
Habit positively influences the consumer’s use behavior of a generic SNS as a tourism digital platform.
3.8 Platform reputation
PR refers to the overall public perception and evaluation of a social media platform or any other online platform (Liu and Sun, 2014). According to reputation theory (Weigelt and Camerer, 1988), reputation serves as an effective incentive mechanism in information asymmetry, and SNSs with a high reputation are more likely to win the trust of users, thereby increasing the reliability of information sources and enhancing the perception of information quality (Li et al., 2019). Thus, the following hypothesis is proposed:
PR positively influences consumers’ intention to use a generic SNS as a tourism digital platform.
3.9 Social interactive value
SIV refers to the value perceived about the growth, upkeep, and expansion of connections with others (Hamilton et al., 2016). According to Social Identity Theory (Tajfel and Turner, 1979), an individual’s self-concept is partly derived from the social groups to which they belong. This theory emphasizes that individuals define their social identity through three processes: social categorization, social comparison and social identification. SIV meets consumers’ social needs on tourism platforms, making them feel more intimate and welcome and enhancing the experience with personalized travel advice and services (Guan et al., 2022). Thus, the following hypothesis is proposed:
SIV positively influences consumers’ intention to use a generic SNS as a digital tourism platform.
3.10 Behavioral intentions and actual behavior
BI refer to the likelihood of an individual performing a specific behavior, indicating their readiness to take part in a particular action. The research by Venkatesh et al. (2003) in the UTAUT model demonstrated that BI has a significant impact on technology use. Based on the UTAUT2 model (Venkatesh et al., 2012), BI influences AB. A consumer with a positive intention is more inclined to accept and use innovation (Gupta et al., 2018; Kamboj and Joshi, 2020; Gupta and Dogra, 2017). Thus, the following hypothesis is advanced:
Behavioral intention to use a generic SNS as a tourism digital platform influences the actual use of tourist consumers.
Figure 1 depicts the research model.
4. Empirical study
4.1 Research design
The research model was tested quantitatively using an online questionnaire designed in accordance with the research framework. Participants were Chinese tourists who had used SNSs, selected via screening questions. The questionnaire was pretested and optimized for clarity and relevance. Data analysis was conducted using SPSS 24.0 and SmartPLS 4.1.0 software. Ethical considerations were communicated to participants, ensuring their anonymity, and they were asked to complete the questionnaire based on their personal experiences. The main details are described below.
4.2 Questionnaire design
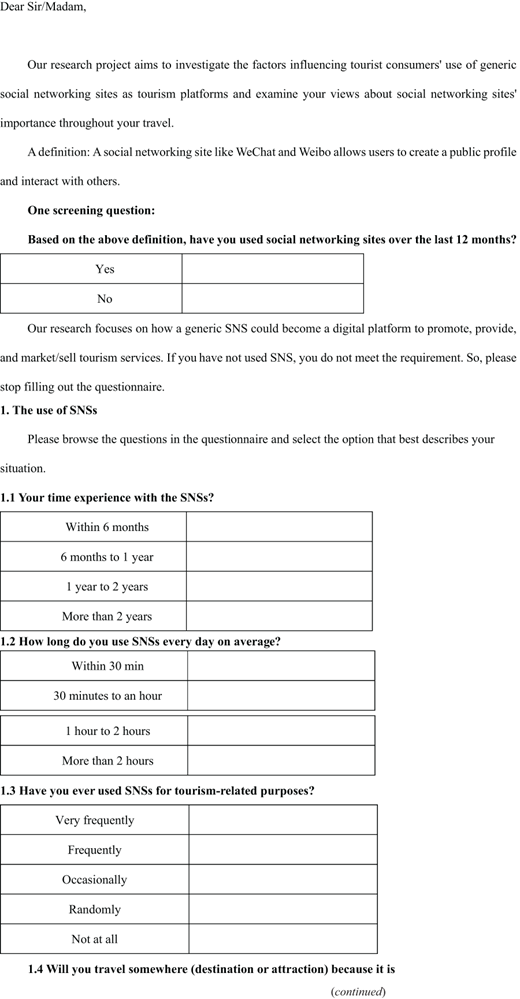
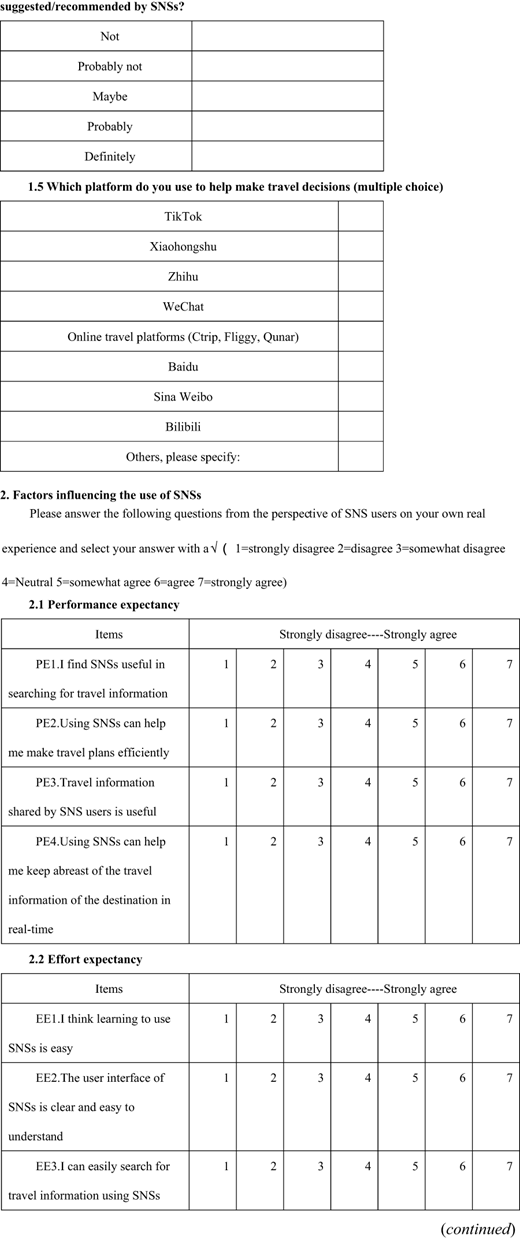
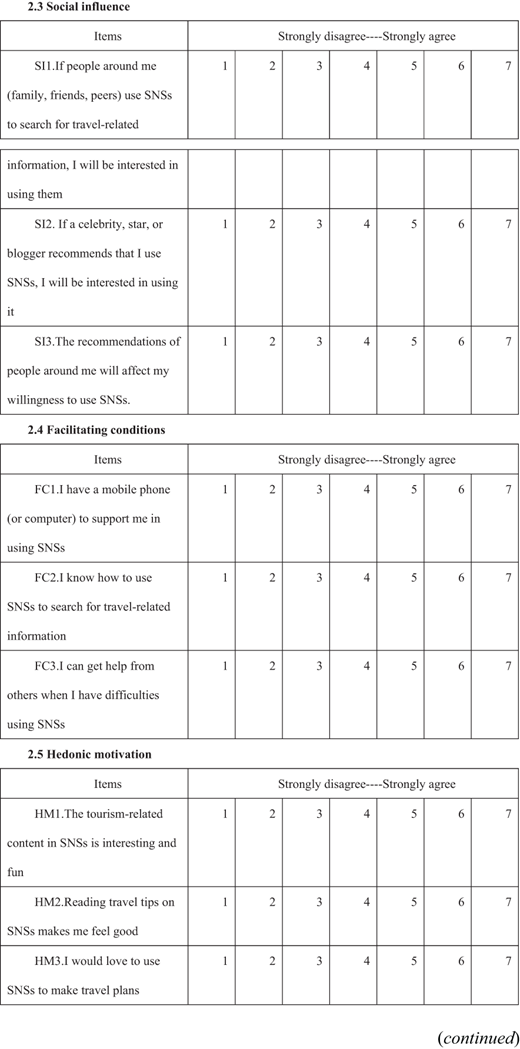
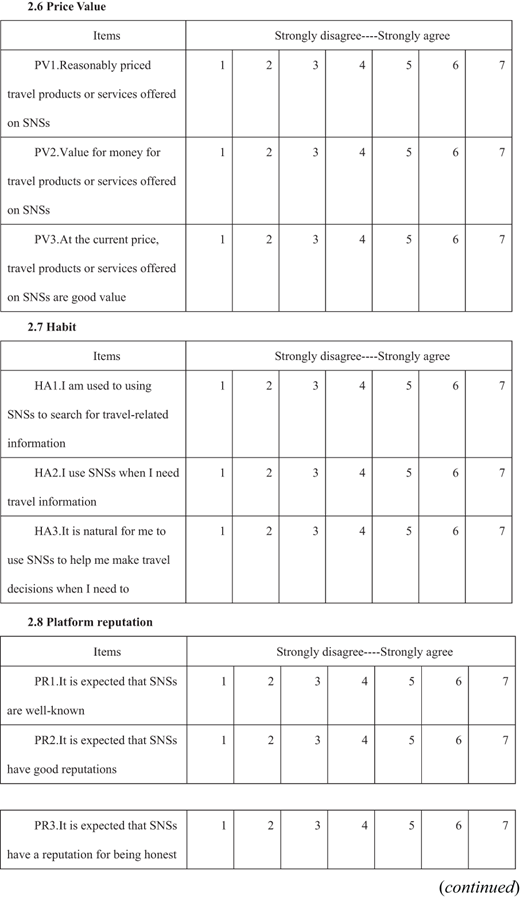
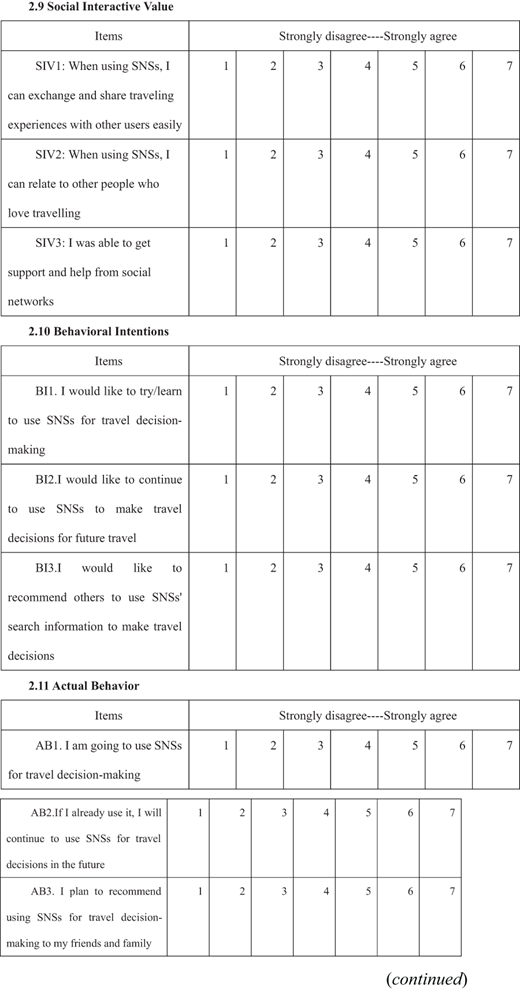
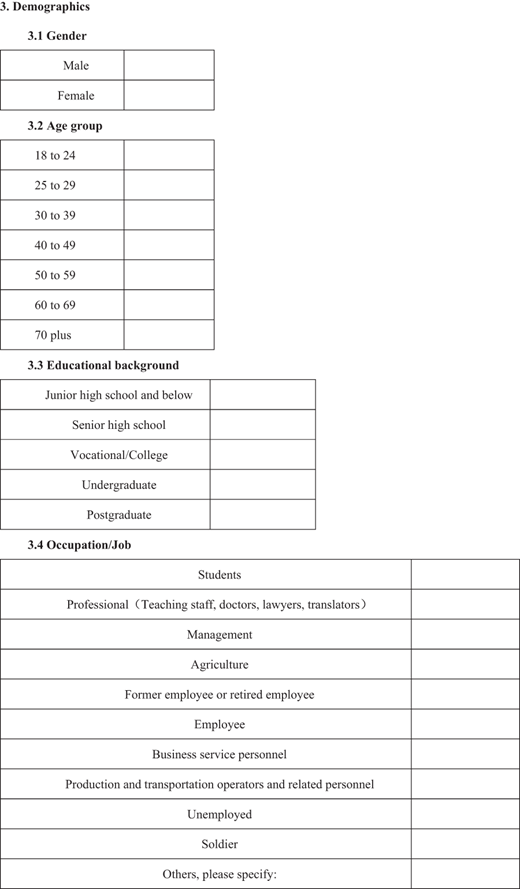
The questionnaire consisted of three parts, containing a total of 43 statements See Appendix 2. Firstly, it encompassed items related to the respondents’ utilization of SNSs. Secondly, there were items related to the 11 variables within the model, using a seven-point Likert scale, where 1 signified “strongly disagree” and 7 denoted “strongly agree.” Thirdly, it incorporated items aimed at gathering demographic data. The measurement scale was formulated based on recommendations from prior studies and modified to suit the research context and objectives. The items for the factors PE, EE, SI, FC, HM, HA, BI and AB were taken from Venkatesh et al. (2012), Zhou et al. (2023) and Gupta et al. (2018). The items for PV were based on studies by Venkatesh et al. (2012), Gupta et al. (2018) and Kamboj and Joshi (2020). The items for SIV were taken from Chen et al. (2018) and Perez-Vega et al. (2018), while the items for PR were taken from Kim (2012). The research team first created the survey in English and then translated it into Chinese See Appendix 1 Table A1.
Profile of the participants (n = 805)
| Demographics | Frequency (n) | Proportion (%) |
|---|---|---|
| Gender | ||
| Male | 432 | 53.66 |
| Female | 373 | 46.34 |
| Age group | ||
| 18–24 | 279 | 34.66 |
| 25–29 | 180 | 22.36 |
| 30–39 | 114 | 14.16 |
| 40–49 | 146 | 18.14 |
| 50–59 | 58 | 7.20 |
| 60–69 | 16 | 1.99 |
| 70 plus | 12 | 1.49 |
| Educational background | ||
| Junior high school and below | 24 | 2.98 |
| Senior high school | 29 | 3.60 |
| Vocational/college | 65 | 8.07 |
| Undergraduate | 453 | 56.27 |
| Postgraduate | 234 | 29.07 |
| Occupation/Job | ||
| Students | 280 | 34.78 |
| Professional(teaching staff, doctors, lawyers, translators, etc.) | 141 | 17.52 |
| Management | 130 | 16.15 |
| Agriculture | 31 | 3.85 |
| Former employee or retired employee | 13 | 1.61 |
| Employee | 109 | 13.54 |
| Business service personnel | 75 | 9.32 |
| Production and transportation operators and related personnel | 12 | 1.49 |
| Unemployed | 8 | 0.99 |
| Soldier | 1 | 0.12 |
| Others | 5 | 0.62 |
4.3 Sampling and data collection
The study gathered questionnaires online and randomly sampled all respondents. The research team began collecting online questionnaires on June 1, 2024, using the Questionnaire Star survey platform, which linked to social platforms such as Xiaohongshu, Weibo and Circle of Friends to gather a wider sample of data. As of October 15, 856 questionnaires were collected. The collected questionnaires were then screened, and 51 invalid questionnaires were excluded, resulting in 805 valid questionnaires being obtained in the end.
5. Data analysis: results and discussion
In this study, data were analyzed using SPSS 24.0 and SmartPLS 4.1.0 software. Regarding the reliability of the scale, Cronbach’s alpha is one of the most common methods used to test the reliability of a scale, SPSS was used to test the reliability of the questionnaire’s scale, and the validity of the questionnaire’s scale was tested using a validation factor analysis; regarding the validation of the H1–H10 research hypothesis, structural equation modeling was used to calculate the path coefficients to test whether the hypothesis was valid or not.
5.1 Descriptive statistics
Concerning the sample’s profile, the gender distribution was relatively balanced, with 53.66% male and 46.34% female respondents. The majority of participants were aged 18–24 (34.66%). In terms of education, 85.34% held a bachelor’s degree or higher, with 56.27% specifically having a bachelor’s degree. Regarding occupation, students (34.78%), professionals (17.52%), management (16.15%) and employees (13.54%) formed the largest groups (See Table 1). These individuals typically have a certain level of disposable income and leisure time, making them key current or potential tourist demographics. Concerning the use of SNSs, 79.88% of respondents had been using SNSs for over two years, with 52.42% spending more than 2 h daily on these platforms. Most participants acknowledged using SNSs for tourism-related purposes, as only 2.73% stated they had never engaged in tourism-related activities on SNSs. 86.46% of respondents indicated that they are likely to travel to a place because of the attention and lively discussion it generates on SNSs (See Table 2).
Reliability and validity testing
| Construct | Item | Standard loading | Composite reliability (CR) | Average variance extracted (AVE) | Cronbach’s alpha |
|---|---|---|---|---|---|
| PE | PE1 | 0.908 | 0.925 | 0.814 | 0.924 |
| PE2 | 0.898 | ||||
| PE3 | 0.903 | ||||
| PE4 | 0.901 | ||||
| EE | EE1 | 0.894 | 0.849 | 0.768 | 0.849 |
| EE2 | 0.879 | ||||
| EE3 | 0.855 | ||||
| SI | SI1 | 0.908 | 0.874 | 0.794 | 0.870 |
| SI2 | 0.874 | ||||
| SI3 | 0.891 | ||||
| FC | FC1 | 0.926 | 0.916 | 0.855 | 0.915 |
| FC2 | 0.924 | ||||
| FC3 | 0.923 | ||||
| HM | HM1 | 0.909 | 0.894 | 0.824 | 0.893 |
| HM2 | 0.908 | ||||
| HM3 | 0.906 | ||||
| PV | PV1 | 0.928 | 0.922 | 0.858 | 0.917 |
| PV2 | 0.912 | ||||
| PV3 | 0.939 | ||||
| HA | HA1 | 0.872 | 0.862 | 0.782 | 0.860 |
| HA2 | 0.902 | ||||
| HA3 | 0.879 | ||||
| PR | PR1 | 0.884 | 0.875 | 0.778 | 0.858 |
| PR2 | 0.911 | ||||
| PR3 | 0.849 | ||||
| SIV | SIV1 | 0.914 | 0.897 | 0.821 | 0.891 |
| SIV2 | 0.891 | ||||
| SIV3 | 0.914 | ||||
| BI | BI1 | 0.904 | 0.907 | 0.843 | 0.907 |
| BI2 | 0.920 | ||||
| BI3 | 0.930 | ||||
| AB | AB1 | 0.863 | 0.820 | 0.734 | 0.819 |
| AB2 | 0.852 | ||||
| AB3 | 0.854 |
Furthermore, when Chinese tourists make travel decisions, their preferred social media platforms are Xiaohongshu, TikTok, OTA platforms (such as Ctrip, Fliggy and Qunar) and Bilibili. These data suggest that SNSs provide a platform for information exchange and significantly influence travel choices and decisions. Users rely on SNSs to learn about destinations, share experiences and be inspired by social dynamics for travel planning. Businesses use these platforms for effective branding and personalized recommendations, as well as to build communities of travel enthusiasts. SNSs enable instant feedback that informs other users and helps travel service providers refine their services. In short, SNSs have become a key force in shaping travel behavior and driving the industry (See Table 2).
Respondents’ usage of SNSs
| Characteristics | Frequency (n) | % |
|---|---|---|
| Use of SNSs | ||
| Within 6 months | 28 | 3.48 |
| 6 months to 1 year | 66 | 8.19 |
| 1 year to 2 years | 68 | 8.45 |
| More than 2 years | 643 | 79.88 |
| Average daily usage | ||
| Within 30 min | 45 | 5.59 |
| 30 min to 1 h | 163 | 20.25 |
| 1 h to 2 h | 175 | 21.74 |
| More than 2 h | 422 | 52.42 |
| Using SNSs for tourism-related purposes | ||
| Very frequently | 85 | 10.56 |
| Frequently | 263 | 32.67 |
| Occasionally | 379 | 47.08 |
| Randomly | 56 | 6.96 |
| Not at all | 22 | 2.73 |
| Travel somewhere because of its attractiveness on SNSs | ||
| Not | 21 | 2.61 |
| Probably not | 88 | 10.93 |
| Maybe | 295 | 36.65 |
| Probably | 362 | 44.97 |
| Definitely | 39 | 4.84 |
| The most popular platform for helping tourists make travel decisions | ||
| Xiaohongshu | 714 | 88.70 |
| TikTok | 531 | 65.96 |
| Online travel platform (ctrip, fliggy, qunar, etc.) | 379 | 47.08 |
| Bilibili | 238 | 29.57 |
5.2 Measurement model testing
In this study, the reliability of all items within the research scale was first examined through SPSS 24.0. The Cronbach’s alpha coefficient was 0.969, indicating a high overall scale reliability and excellent internal consistency. The test results for each of the 11 variables are presented in Table 3. The Cronbach’s alpha coefficient values ranged from 0.819 to 0.924, all of which exceeded 0.7, indicating good stability. Internal consistency was then tested within each factor, and the standardized factor loadings for each measure ranged from 0.849 to 0.939, which is higher than the benchmark value of 0.5 suggested by scholars. Composite reliability (CR) serves as a discriminant criterion for the internal consistency of a model. It reveals whether each latent variable’s measurement items can coherently account for the latent variable. A CR value exceeding 0.6 signifies an acceptable level of intrinsic quality (Bagozzi, 1981), and the CR of the measurement model in this study ranges from 0.821 to 0.925, indicating that all measurement items of each variable consistently explain the variable and that the measurement items have a high degree of internal correlation. The average variance extracted (AVE) value is utilized to evaluate the convergent validity. When the AVE value exceeds 0.5, it indicates adequate convergent validity (Leguina, 2015). The AVE is between 0.734 and 0.858, ideal for convergent validity. For the test of discriminant validity, the heterogeneous univariate heterotrait-monotrait ratio of correlations (HTMT) ratio between latent variables was used, a superior method proposed by Henseler et al. (2015). An HTMT value of 0.85 or less is considered to indicate good discriminant validity between the two variables. In this study, the HTMT values between the two variables in the model did not exceed 0.85, so the discriminant validity passed the test (See Table 4). Variance inflation factor (VIF) is a measure of the strength of the linear relationship between the independent variables. VIF values below 3.3 are usually acceptable, but a VIF of less than 5 can also be acceptable in cases with errors within the measurement algorithm (See Table 5).
Discriminant validity
| Construct | PE | EE | SI | FC | HM | PV | HA | PR | SIV | BI | AB |
|---|---|---|---|---|---|---|---|---|---|---|---|
| PE | |||||||||||
| EE | 0.697 | ||||||||||
| SI | 0.772 | 0.643 | |||||||||
| FC | 0.764 | 0.628 | 0.676 | ||||||||
| HM | 0.750 | 0.598 | 0.731 | 0.662 | |||||||
| PV | 0.570 | 0.472 | 0.647 | 0.460 | 0.621 | ||||||
| HA | 0.713 | 0.513 | 0.668 | 0.630 | 0.667 | 0.521 | |||||
| PR | 0.700 | 0.595 | 0.722 | 0.603 | 0.634 | 0.701 | 0.620 | ||||
| SIV | 0.717 | 0.576 | 0.713 | 0.633 | 0.673 | 0.609 | 0.657 | 0.729 | |||
| BI | 0.756 | 0.624 | 0.713 | 0.672 | 0.690 | 0.570 | 0.655 | 0.690 | 0.724 | ||
| AB | 0.697 | 0.548 | 0.692 | 0.610 | 0.680 | 0.537 | 0.651 | 0.669 | 0.707 | 0.741 |
5.3 Testing research hypotheses
Firstly, an analysis was conducted to examine the impact of external factors on BI and AB. In the structural model, the R2 values for BI and AB for tourist consumers using SNSs as tourism platforms were 0.602 and 0.490, respectively. We found that the model can account for both BI and AB. The cross-validation redundancy of BI and AB was calculated by using SmartPLS software. The outcomes were 0.498 and 0.353, each above zero and below 1. The model signified an acceptable degree of predictive relevance. The path coefficient results among the structural model variables were finally acquired using the bootstrapping approach. As shown in Table 6, most path coefficients exhibited high t-values. Among the ten hypotheses, H3 and H6 with insignificant t-values were not validated, while the others were. Consequently, no positive association was identified between SI, PV and BI, leading to the rejection of these hypotheses. However, hypotheses H1, H5b, H7b, H9 and H10 were significant at p < 0.001, H4a and H4b were significant at p < 0.01 and H2, H5a, H7a and H8 were significant at p < 0.05. Hence, BI is more affected by PE, FC, PR and SIV. Moreover, AB is significantly and positively impacted by BI, HM and HA.
Path test results
| Path | R2 | Q2 | Direct effects | t-value | p-value | Supported or not |
|---|---|---|---|---|---|---|
| BI | 0.602 | 0.498 | ||||
| PE->BI | 0.188 | 4.096 | 0.000 | H1: Yes | ||
| EE->BI | 0.078 | 2.297 | 0.022 | H2: Yes | ||
| SI->BI | 0.083 | 1.622 | 0.105 | H3: No | ||
| FC->BI | 0.103 | 2.836 | 0.005 | H4a: Yes | ||
| HM->BI | 0.098 | 2.254 | 0.024 | H5a: Yes | ||
| PV->BI | 0.034 | 0.864 | 0.388 | H6: No | ||
| HA->BI | 0.078 | 2.229 | 0.026 | H7a: Yes | ||
| PR->BI | 0.112 | 2.443 | 0.015 | H8: Yes | ||
| SIV->BI | 0.183 | 3.528 | 0.000 | H9: Yes | ||
| AB | 0.490 | 0.353 | ||||
| FC->AB | 0.094 | 2.642 | 0.008 | H4b: Yes | ||
| HM->AB | 0.207 | 4.763 | 0.000 | H5b: Yes | ||
| HA->AB | 0.168 | 4.494 | 0.000 | H7b: Yes | ||
| BI->AB | 0.356 | 7.666 | 0.000 | H10: Yes |
6. Conclusions, implications and limitations
6.1 Conclusion
The main aim of this study was to explore the elements that influence tourist consumers’ intention to use generic SNSs as tourism platforms by expanding the UTAUT2 framework by incorporating PR and SIV constructs. Findings indicate that consumer use of SNSs such as PE, EE, FC, HM, HA, PR and SIV significantly influenced tourism platforms. This study has established that HM is the dominant force in determining the variables, in contrast to PE, SIV and HA, which are of lesser significance. These results corresponded with the findings of previous research (Medeiros et al., 2024; Zhou et al., 2023; Castañeda et al., 2019).
However, the findings indicate no significant relationship between SI and PV on BI. This result differs from some previous studies, but it also has its own rationality and uniqueness. SI is considered to have a strong predictive effect on users’ willingness to use in consumer contexts (Zhou et al., 2023; Gupta et al., 2018). However, some studies have also shown that SI has no significant impact on tourists sharing information on social networks or using map applications during travel (Herrero et al., 2017; Gupta and Dogra, 2017). Scholars point out that SI only works in mandatory environments and that there is no need to seek the opinions of people around you, such as peers or friends. In a previous study, PV is considered to have a strong predictive effect on users’ willingness to use in consumer contexts, such as users’ use of OTA and the use of map applications (Ridzky and Sarno, 2020; Gupta and Dogra, 2017). However, some studies have also shown that PV has no significant impact on consumer usage of travel and restaurant platforms or the use of online travel reviews (Assaker et al., 2019; de et al., 2023). In the context of this study, consumers may focus more on obtaining travel inspiration and information through SNSs rather than directly transacting, reducing the price factor’s weight.
6.2 Implications
6.2.1 Theoretical implications/contribution.
This study makes significant theoretical contributions to understanding tourists’ adoption of SNSs as tourism platforms. First, integrating the constructs of PR and SIV into the UTAUT2 framework enriches the theoretical exploration of factors influencing the use of SNSs for tourism purposes. Although the UTAUT2 model has been extensively validated in general technology acceptance contexts, research on “using SNSs for tourism purposes” has mostly focused on traditional drivers such as PE and FC. The roles of PR and SIV, which are highly relevant to travel decision-making, have largely been unexplored. In the tourism SNSs context, users’ perceptions of platform credibility and the emotional and social benefits derived from interacting with others have been overlooked. Our findings highlight their importance in shaping tourists’ behavioral intentions, thereby addressing a dearth of comprehensive exploration of the elements of tourists’ technology adoption within the context of tourism SNSs. Second, the study reaffirms and extends the understanding of the roles of well-established factors within the UTAUT2 model. For instance, the confirmation of HM as the strongest determinant aligns with prior studies on the importance of enjoyment in technology adoption in tourism. This finding inspires future researchers to explore further the links between HM and other psychological factors, thereby deepening their understanding of the mechanisms underlying tourist behavior. The significant influences of PE, HA and the newly introduced SIV also corroborate and expand existing knowledge, offering a more comprehensive perspective on tourists’ decision-making processes. Third, the research provides further evidence regarding the insignificance of certain factors in specific contexts. The lack of a significant relationship between SI and BI, as well as that of PV and BI, deepens our understanding of when and why these factors do not play a decisive role. This contributes to refining the application scope and enhancing the predictive accuracy of the UTAUT2 model within tourism-related technology acceptance studies. In summary, this study not only broadens the theoretical boundaries of the UTAUT2 model but also enhances its explanatory and predictive power in the domain of tourists’ utilization of SNSs for travel activities.
6.2.2 Practical implications for industry practitioners.
This study holds substantial practical implications for diverse stakeholders in the tourism industry, especially those involved with SNSs serving as tourism platforms. SNSs developers and operators must understand the significant factors that affect tourists’ intentions. Firstly, emphasizing HM implies prioritizing the creation of an engaging and enjoyable user experience. According to the study by Yoo et al. (2017), the application of SNSs in the tourism industry extends beyond mere information provision, offering a richer user experience through the integration of gamification and smart tourism technologies. Incorporating features such as interactive travel stories, visually appealing interfaces and gamified elements can enhance the pleasure derived from using the platform. SNSs developers can introduce gamification elements, such as badges, leaderboards and challenges, to increase users’ stickiness and frequency of use on the platform. Tourism enterprises can highlight the fun, novelty and emotional value of travel experiences in their marketing communications.
Secondly, given the importance of PE, ensuring accurate, up-to-date and comprehensive travel information, along with seamless navigation and efficient search functions, is crucial. SNSs developers can optimize the platform’s navigation features to ensure that users can easily find the information they need. For example, through intelligent search algorithms and categorized tags, users can quickly locate travel destinations and activities that interest them. FC also needs attention; developers should ensure that the platform is accessible across various devices and internet connections and offer clear instructions and user support. Platforms can utilize encryption technology to protect user data, thereby enhancing user trust in the platform. By enhancing the application of Artificial Intelligence (AI) and big data analytics in SNSs, platforms can more effectively identify and address misinformation and undesirable behaviors, thereby boosting credibility (Samara et al., 2020). For instance, machine learning algorithms can be utilized to automatically detect and filter out fake reviews, safeguarding users from being misled.
Meanwhile, AI can bolster user trust by offering transparent rating systems and feedback mechanisms. Moreover, big data analytics enables platforms to gain in-depth insights into user preferences and behavior patterns, thus providing highly personalized travel recommendations and services. For example, AI algorithms can recommend travel destinations, activities and accommodation options that align with user interests based on their travel history and preferences. The Bayesian bidirectional long short-term memory model proposed by Kulshrestha et al. (2020) and the temporal multilayer sequential network model, which incorporates a temporal attention mechanism, have further enhanced the accuracy of personalized recommendations. For SIV, marketers can design campaigns encouraging user interactions, such as travel photo contests, destination quizzes and community forums. This not only enhances user engagement but also spreads positive word-of-mouth.
In contrast, recognizing the insignificance of PV in this context, SNS developers can focus on providing high-quality content and services, enhancing user interaction experiences and improving PR, rather than relying solely on pricing strategies to attract users. For example, providing exclusive travel guides, professional travel advice and high-quality interactive features to boost user engagement and loyalty; partnering with well-known travel brands to host joint promotional activities, such as lottery events and limited-time offers, to increase brand awareness and user traffic; and leveraging targeted advertising and paid membership schemes to offer exclusive discounts and unique content, thereby increasing platform revenue. Overall, this research equips industry practitioners with the knowledge to optimize their platforms and marketing efforts, ultimately enhancing the attractiveness and usability of SNSs for tourism purposes.
6.3 Study’s limitations and future research
Our study acknowledges certain limitations due to its specific context, sampling method, absence of behavioral observation and the limited generalizability of its findings. Consequently, we propose recommendations for future research directions. First, the study’s context is confined to China, which may limit the applicability of the results to other cultural and social settings. Future research should consider conducting comparative studies across different cultural contexts to validate the model’s effectiveness and generalizability. Second, regarding the sample, our study may not fully represent diverse populations due to the sampling method employed. Future research could benefit from more diverse and representative sampling techniques to ensure a broader range of participants and perspectives. Third, our study does not directly observe actual behavior; future research could employ longitudinal tracking or combine survey data with platform log data to capture real behavior and further validate the model’s predictive power. Finally, the findings cannot be easily generalized beyond the specific context of China. To address this, we suggest conducting comparative studies across different markets. These endeavors will provide valuable insights for technology promotion in global markets.
 The structural model presents hypothesised relationships between multiple variables affecting behavioural intention and actual behaviour. Performance expectancy, effort expectancy, social influence, facilitating conditions, hedonic motivation, perceived value, habit, perceived risk, and social image value each connect to behavioural intention through hypotheses H1 to H9. Behavioural intention, in turn, influences actual behaviour through H10. Facilitating conditions, hedonic motivation, and habit have both direct and indirect effects on behavioural intention and actual behaviour.
Research model
Note(s):PE = performance expectancy, EE = effort expectancy, SI = social influence, FC = facilitating conditions, HM = hedonic motivation, PV = price value, HA = habit, SIV = social interactive value, PR = platform reputation, BI = behavioral Intentions, AB = actual behavior
Source: Authors’ own work
The structural model presents hypothesised relationships between multiple variables affecting behavioural intention and actual behaviour. Performance expectancy, effort expectancy, social influence, facilitating conditions, hedonic motivation, perceived value, habit, perceived risk, and social image value each connect to behavioural intention through hypotheses H1 to H9. Behavioural intention, in turn, influences actual behaviour through H10. Facilitating conditions, hedonic motivation, and habit have both direct and indirect effects on behavioural intention and actual behaviour.Research model
Note(s):PE = performance expectancy, EE = effort expectancy, SI = social influence, FC = facilitating conditions, HM = hedonic motivation, PV = price value, HA = habit, SIV = social interactive value, PR = platform reputation, BI = behavioral Intentions, AB = actual behavior
Source: Authors’ own work
References
Further reading
Appendix 1
Research instrument: original vs. modified scales
| Constructs | original items | Source |
|---|---|---|
| PE | 1.1 I find TikTok useful in searching for travel information 1.2 Travel information shared by TikTok users is useful 1.3 Using TikTok can help me keep abreast of the travel information of the destination in real-time 1.4 Using TikTok can help me choose and determine the destination faster | (Venkatesh et al., 2012; Zhou et al., 2023) |
| EE | 2.1 I think learning to use TikTok is easy 2.2 The user interface of TikTok is clear and easy to understand 2.3 I can easily search for travel information using TikTok | (Venkatesh et al., 2012; Zhou et al., 2023) |
| SI | 3.1 If people around me (family, friends, peers) use TikTok to search for travel-related videos, I will be interested in using it 3.2 If a celebrity, star or blogger I respect or love posts a travel video on TikTok, I will be interested in using it 3.3 The recommendations of people around me will affect my willingness to use TikTok for destination selection | (Venkatesh et al., 2012; Zhou et al., 2023) |
| FC | 4.1 I have the resources needed to use TikTok (mobile device, internet) 4.2 I know how to use TikTok to search for short travel videos 4.3 When I have trouble using TikTok, I can ask others or customer service for help | (Venkatesh et al., 2012; Zhou et al., 2023) |
| HM | 5.1 The short tourism video content on TikTok is interesting and fun 5.2 Watching short travel videos on TikTok makes me feel good 5.3 I would love to use TikTok to scan travel destinations | (Venkatesh et al., 2012; Zhou et al., 2023) |
| PV | 6.1 Mobile Internet is reasonably priced 6.2 Mobile Internet is a good value for the money 6.3 At the current price, mobile internet provides a good value | (Venkatesh et al., 2012; Gupta and Dogra, 2017; Kamboj and Joshi, 2020) |
| HA | 7.1 I am used to using TikTok to watch short travel videos 7.2 I use TikTok when I need travel information 7.3 It is natural for me to use TikTok to help me make destination decisions when I need to | (Venkatesh et al., 2012; Zhou et al., 2023) |
| PR | 8.1 It is expected that online sellers are well-known 8.2 It is expected that online sellers have good reputations 8.3 It is expected that online sellers have reputations for being honest | Kim (2012) |
| SIV | 9.1 When watching a live stream, I can exchange and share opinions with the streamer or other audiences easily 9.2 When watching a live stream, I feel closer to the streamer 9.3 When I am watching a live stream, the streamer provides sufficient opportunities to respond and ask a question | (Chen et al., 2018; Perez-Vega et al., 2018) |
| BI | 10.l I would like to try/learn to use TikTok for destination decision making 10.2 I would like to continue to use TikTok to make destination decisions in future travel 10.3 I would like to recommend others to use TikTok search information to make destination decisions | (Venkatesh et al., 2012; Zhou et al., 2023) |
| AB | 11.1 I am going to use TikTok for destination decision-making 11.2 If I have already used it, I will continue to use TikTok for destination decisions in the future 11.3 I plan to recommend using TikTok for destination decision-making to my friends and family | (Venkatesh et al., 2012; Zhou et al., 2023) |
| Constructs | Modified items | |
| PE | 1.1 I find SNSs useful in searching for travel information 1.2 Using SNSs can help me make travel plans efficiently 1.3 Travel information shared by SNS users is useful 1.4 Using SNSs can help me keep abreast of the travel information of the destination in real-time | |
| EE | 2.1 I think learning to use SNSs is easy 2.2 The user interface of SNSs is clear and easy to understand 2.3 I can easily search for travel information using SNSs | |
| SI | 3.1 If people around me (family, friends, peers) use SNSs to search for travel-related information, I will be interested in using them 3.2 If a celebrity, stars or a blogger I respect or love recommend me to use SNSs, I will be interested in using it 3.3 The recommendations of people around me will affect my willingness to use SNSs. | |
| FC | 4.1 I have a mobile phone (or computer) to support me in using SNSs 4.2 I know how to use SNSs to search for travel-related information 4.3 I can get help from others when I have difficulties using SNSs | |
| HM | 5.1 The tourism-related content in SNSs is interesting and fun 5.2 Reading travel tips on SNSs makes me feel good 5.3 I would love to use SNSs to make travel plans | |
| PV | 6.1 Reasonably priced travel products or services offered on SNSs 6.2 Value for money for travel products or services offered on SNSs 6.3 At the current price, travel products or services offered on SNSs are good value | |
| HA | 7.1 I am used to using SNSs to search for travel-related information 7.2 I use SNSs when I need travel information 7.3 It is natural for me to use SNSs to help me make travel decisions when I need to | |
| PR | 8.1 It is expected that SNSs are well-known 8.2 It is expected that SNSs have good reputations 8.3 It is expected that SNSs have reputations for being honest | |
| SIV | 9.1 When using SNSs, I can exchange and share travel experiences with other users easily 9.2 When using SNSs, I can relate to other people who love travelling 9.3I was able to get support and help from social networks | |
| BI | 10.1 I would like to try/learn to use SNSs for travel decision making 10.2 I would like to continue to use SNSs to make travel decisions in future travel 10.3 I would like to recommend others to use SNSs’ search information to make travel decisions | |
| AB | 11.1 I am going to use SNSs for travel decision-making 11.2 If I have already used it, I will continue to use SNSs for travel decisions in the future 11.3 I plan to recommend using SNSs for travel decision-making to my friends and family | |
Appendix 2. Questionnaire