The study quantifies the impact of resilience enablers on various business outcomes affected during a supply chain (SC) disruption faced by the Indian automobile industry. This impact is captured using the resilience index that helps in benchmarking resilience across SCs.
Graph theoretic and matrix approach (GTMA) is utilised in the study for obtaining the interactions and the resilience index. GTMA comprises three steps, namely, digraph formulation, adjacency matrix development and permanent function calculation. The diagraph helps in obtaining the interaction between the enablers, whereas the permanent function helps provide the single index value to the resilience capability of SCs.
The GTMA results in digraphs for the business outcomes depicting the interactions among the enablers for each business outcome. These interactions were quantified into adjacency matrix and permanent functions are calculated along with the theoretical best and worst values. The current value of each of the business outcomes and the SC resilience index is less for the Indian automobile SC, which requires strengthening the interactions among the enablers in the SC.
The research methods and the value of the resilience index are beneficial for managers and academicians alike. The quantification method can be utilised in other industry and country contexts to analyse the resilience of their SCs. Furthermore, these values may act as a benchmarking tool to compare the resilience value for different industries and also within the same industries. Based on the comparisons, managers can invest more in incorporating enablers in their SCs or they can improve upon the interactions among the enablers for a business outcome to improve overall resilience.
1. Introduction
The smooth functioning of logistics and transportation systems enables international trade of a country by facilitating industrial operations, thereby improving its logistics performance index. High-performing logistics and transportation systems, therefore, influence export potential and national competitiveness and support government revenue through trade facilitation (Timotius et al., 2022). However, the geopolitical uncertainty and turbulence, economic sanctions, pandemics and climate-related shocks are increasing uncertainty and vulnerability of international supply chains (SCs), thereby severely impacting the logistics effectiveness of a country’s SCs (Kwon, 2020). The vulnerabilities of several of these global SCs emerged during the COVID-19 pandemic, and many of them are impacted owing to the ongoing trade tensions and wars among countries. For example, Apple Inc. faced similar disruptions amidst the rise in trade tariffs by the USA and had to lift their products from India to circumvent the rise in costs. Furthermore, Indian automakers are facing tough conditions in importing rare-earth magnets from China owing to trade tensions between the two countries. The industry was also impacted during the COVID-19 pandemic, as the interconnected nature of complex, globally distributed supply networks and just-in-time logistics meant that even short-term disruptions led to production halts and cascading effects throughout the value chain. The vulnerabilities in the SC and the resulting disruption bring the attention of scholars and practitioners alike towards building resilience capability in SCs (Agarwal et al., 2022).
Supply chain resilience (SCR) is the ability of a system to return to its original state or move to a more desirable state after being disturbed (Christopher and Peck, 2004). With resilience capability, SCs ensure continuity of operations at the desired level of connectedness and control over structure and function amidst disruptions (Ponomarov and Holcomb, 2009). As SCs with resilience capability can recover faster from disruptions than their non-resilient counterparts, they also witness a better customer-oriented performance (Asamoah et al., 2019), SC performance (Gu et al., 2021), financial performance (Li et al., 2017) and firm performance (Abeysekara et al., 2019). Hence, resilience represents a critical capability that can mitigate the devastating effects of disruptive events on the operations of firms and SCs. The aforementioned arguments support building of resilience capability in SCs. However, despite its benefits, managers often struggle with implementation due to challenges in evaluating its effectiveness and the high associated costs. In such times, managers often look for ways to prioritise and manage the most critical risks and build resilience to mitigate disruption as well as create and execute business continuity plans within the intended budget.
For enhancing resilience, existing literature on resilience consists of studies identifying enablers enhancing resilience and analysing their impact on achieving business outcomes amidst SC disruptions. These studies are often variance-based analyses and frequently overlook the enablers and their interrelationships to assess their impact on business outcomes amidst SC disruptions. Quantification of the interactions among enablers to assess their effect on business outcomes helps in prioritising strategic interventions, improving decision-making and enhancing overall SCR during disruptions. The present study utilises the graph theoretic and matrix approach (GTMA) to quantify the interactions among enablers and their quantification in achieving business outcomes during disruptions. GTMA helps identify the interactions amidst the enablers for business outcomes through digraphs and the adjacency matrix and quantifies them using the permanent function revealing the resilience index of the SC. The quantification of interactions to achieve business outcomes helps in individually assessing the impact of resilience enablers, whereas the resilience index provides an overall score for the SC. The index value not only provides information regarding the resilience of the SC but is also beneficial in benchmarking resilience with other SCs.
Given the strategic importance of the automobile sector in global manufacturing and trade, there is an urgent need to systematically study SCR within this industry. By doing so, stakeholders can identify vulnerabilities, design robust logistical frameworks and formulate adaptive policies that strengthen global value chains. Amidst these times, it is essential that more studies are performed that analyse the resilience capability of the Indian automobile industry that shall not only help the incoming players but also shall help Indian companies to benchmark their performance in comparison to leaders. Resilience-based studies in the context of Indian automobile industry have been given limited attention despite its immense potential for the success of global automobile value chains. Given the scant nature of studies towards quantification of resilience capability while considering the interactions of resilience enablers, the present study sets out to ask the following questions:
How can the interactions between the resilience enablers be quantified to yield the intensity of their effect on business outcomes?
How can SCR be quantified to be depicted as a single numerical index?
The rest of the study is organised as follows: Section 2 reviews the extant literature on SCR and methods used for the assessment; Section 3 is that of the research methodology, which elaborates the conceptual framework and the data collection; Section 4 gives the findings of the application of research methods and Section 5 gives the concluding remarks, implications of the study and limitations and future scope of study.
2. Review of literature
The present study critically reviews the literature to establish understanding of contemporary research on SCR and identifies possible gaps that might exist before beginning new research. The following sections give a detailed review on SCR and its enablers and the methods used for the evaluation of resilience.
2.1 Review of supply chain resilience and enablers
Many recent events (such as the COVID-19 pandemic, the resulting semi-conductor shortages, the Russia–Ukraine war and the Israel–Palestine war, to name a few) demonstrate that global SC networks are exposed to material, financial or information risks that could create network wide problems (Pimenta et al., 2022). These events may affect any SC activity, whether manufacturing, logistics and retailing, snowballing into an SC wide disruption. Strategies emphasising on efficiency and effectiveness to counter turbulence are proving insufficient and uncompetitive in the present era (Vishnu et al., 2019). The need of the hour is to develop approaches that can control dynamically arising risks due to global unrest (Piprani et al., 2020). Building competencies across the value chain prepare businesses to endure and recuperate from disruptive events, which form the crux of SCR (Asamoah et al., 2019). Resilience is, thus, a crucial and strategic capability that can help SCs avoid severe consequences of disruptive events (Belhadi et al., 2021a, b; Singh and Singh, 2019). The present study takes the definition given by Agarwal and Seth (2024) for defining SCR as, “a capability of a supply chain that helps it to prevent, respond and recover from disruption through its preparedness, quick response and transformation”.
The literature argues on the importance of identification of enablers that enhance resilience capability of a SC. These enablers identified in different industry and country contexts, acting as foundational elements to strengthen resilience in an SC (da Silva Poberschnigg et al., 2020; Sawyerr and Harrison, 2020). Resilience enablers lead to rapid adaptation to market changes through tactical, strategic and operational decision-making (Ozdemir et al., 2022; Agarwal et al., 2022; Kim and Bui, 2019). The advantages offered by resilience enablers, hence, make their identification of immense importance. Table 1 tabulates the resilience enablers that are discussed in the literature along with the industry contexts in which they are studied.
Different enablers come into play for enhancing resilience of SCs as the industry and country context changes. For example, da Silva Poberschnigg et al. (2020) identified flexibility, adaptability, collaboration, visibility and agility and cross-functional integration as the enablers for automobile industry, whereas Scholten and Schilder (2015) identified SC collaboration through information sharing, collaborative communication, mutually created knowledge and joint relationship efforts for food processing industry. Some authors have, however, identified enablers across multiple industries indicating common enablers that enhance SCR irrespective. The manner in which different disruptions impact the SCs often vary with the industry and country context that calls for building enablers tailored to their situation. Once different enablers across diverse contexts are identified, they can be further utilised for universal solutions. Cross-country studies also enable benchmarking, helping organisations and policymakers adopt successful strategies and set global standards. Ultimately, a multi-contextual understanding of resilience mechanisms supports stronger collaboration within global SCs, fostering networks that can better withstand and adapt to unforeseen challenges.
2.2 Review of methods for evaluation of supply chain resilience
Resilience capability helps SCs achieve superior performance amidst disruptions by ensuring continuity of material supply and product delivery. Information about the improvement in performance parameters conveys the efficiency and effectiveness of actions. It reflects the essential areas of a process that requires improvement. Since the conditions surrounding the business environment are dynamic, managers also require continuous evaluation of the efficiency and effectiveness of action. In particular, it is beneficial for firms to quantitatively analyse the impact of resilience enablers on different business outcomes. The structural model can help assess. Table 2 tabulates the existing methods of evaluation of SCR in different industry and country contexts. The literature provides abundant evidence on how the enablers (given as independent variables) affect SCR (given as dependent variables). Diverse research methods are applied such as empirical studies (Wong et al., 2020), developing theoretical models (Shashi et al., 2020) and case studies (Treiblmaier, 2018) and others such as multi criteria decision-making techniques (Agarwal et al., 2022), system dynamics modelling (Jafarnejad et al., 2019) and optimisation techniques, to name a few, among which empirical studies are most frequently observed. Besides evaluation of the resilience capability, several studies have also assessed the impact of enablers on performance of SC as well (Liu et al., 2018; Abeysekara et al., 2019; Rashid et al., 2025).
It is observed from Table 2 that the quantification of SCR upon the effect of the enablers is given limited attention in the literature. The quantification can assist managers in quantifying relationships among the resilience enablers and evaluate the success of the resilience capability in a SC (Anand and Bahinipati, 2012). However, such an impact assessment of resilience enablers on its business outcomes while considering the complex relationships between them is scant in the literature.
2.3 Motivation for study: research gaps and objectives
Identifying resilience enablers is as vital as their implementation owing to the investments they require (Agarwal and Seth, 2024). Companies need to justify these investments, as each of them comes at a cost. Therefore, to make a strong case for their investment and to assess if the companies are achieving the benefits they anticipate, it becomes important for businesses to assess business outcomes obtained by the implementation of resilience enablers in SCs.
The review of literature provides abundant evidence towards the identification of resilience enablers and their impact on resilience and SC performance in different industry and country contexts (Table 1 and Table 2). These studies have mostly followed variance-based methods and often overlook the interactions among these enablers to assess the impact on various business outcomes impacted during disruptions. Furthermore, limited studies have focused on developing a composite index depicting the resilience of SCs. Such a quantification of resilience will help organisations assess the effectiveness of the resilience enablers. It shall help SCs benchmark their resilience capability with other networks and facilitate organisations to assess their resilience prior to and after the implementation of risk management measures. However, such studies are scant in nature, especially in the context of the Indian automobile industry. The analysis becomes even more important in the context of Indian automobile SCs as they become a greater part of the global value chains. The disruption the industry faced during the COVID-19 pandemic makes it even more important to prevent such a catastrophe to its SCs in future should such a disruption occur. Also, with more global companies exploring the Indian sub-continent for establishing their SCs, it is important that the companies are able to assess their resilience capabilities. The quantification not only helps in the assessment of how well the enablers are helping SCs achieve the business outcomes but also helps in benchmarking their performance with other SCs in the industry.
Considering these concerns and the gaps present in the existing literature, the present study sets out to achieve the following objectives:
To quantify the relationships between the resilience enablers to yield the intensity of their effect on business outcomes
To determine a single numerical index for SCR by considering the enablers and their interactions
The following sections shall explain the conceptual framework adopted for the study and the research methods adopted.
3. Research methodology
The present section discusses the research methodology for the study and elaborates upon the conceptual framework, case SC and the research methods.
3.1 GTMA conceptual framework
The present study takes a two-step approach for achieving the research objectives of the study. For the first objective, the authors have compiled all the enablers and held multiple discussion rounds with the different SC members of the case SC. The list is further reduced after removing duplicate enablers. The final list of enablers is then discussed with the experts for their views. The experts were decided upon using the snowball sampling method, where each expert recommended the subsequent expert for the study. The data collection method and final list of experts are discussed in the next sub-section.
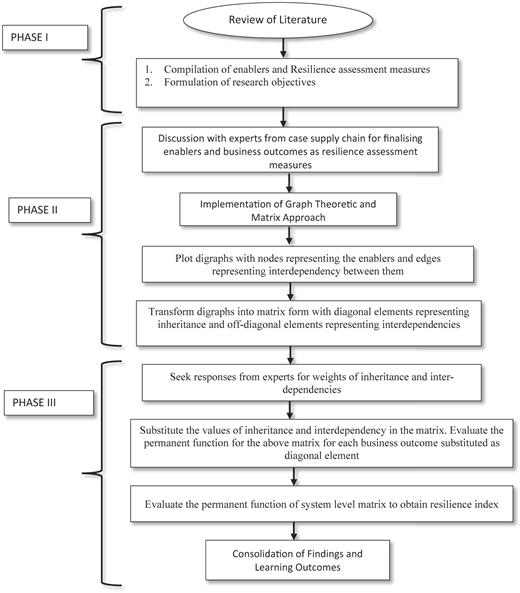
The second research objective entails quantification of interactions between resilience enablers to obtain the intensity of their effect on business outcomes. For fulfilling this research objective, GTMA is utilised. GTMA is a systematic methodology for the conversion of qualitative interrelationships between the variables of a system to quantitative values through mathematical equations. Based on graph theory and matrix algebra, GTMA uses a digraph representation to visualise the relationship among the variables of a system. It helps establish a quantitative directional relationship among the variables. In the present context, GTMA quantifies the interactions between the resilience enablers to yield the intensity of their effect on business outcomes. GTMA does this by providing a weight to the existing relationship between variables and fixing the index, which is depicted using the adjacency matrix (Kumar et al., 2015). The permanent function values of the adjacency matrix compute the interactions to obtain a single numerical index, thereby facilitating an accurate analysis of their dynamic complexities and addressing the research gap identified from the literature review (Figure 1).
In the present work, GTMA helps assess the intensity of the effect of SCR enablers affecting business outcomes. The intensity of resilience enablers on the outcomes depends upon the individual nature and the amount of interaction among them. The use of the GTMA is conceptually supported by systems theory, which emphasises holistic understanding of complex systems through the interplay of interdependent components. GTMA’s ability to capture both the importance of system elements and the relationships among them aligns with this theoretical view, making it especially suitable for modelling dynamic, real-world problems such as resilience assessment, SC performance and sustainability evaluation. The interactions between enablers to showcase their effect on business outcomes are justified using systems theory. The systems theory helps understanding complex phenomena as integrated systems composed of interrelated and interdependent components. It emphasises that the behaviour of the whole system cannot be understood merely by analysing its individual parts in isolation; rather, the structure, interactions and feedback among parts are crucial to understanding system performance. Since in the present study, GTMA entails analysing the individual and combined effect of enablers on business outcomes and hence resilience; therefore, the theoretical underpinning of systems theory is justified.
3.2 Research methods
The GTMA for calculating the resilience index comprises three steps. The first step entails depicting the interactions among the enablers using a network digraph (comprising nodes and edges). The number of nodes is equal to the number of enablers considered for enhancing the resilience of SCs (Agarwal et al., 2022). Unlike undirected graphs, where no direction is assigned, directed graphs have directional edges. If node i has relative importance over another node j, then a directed edge or arrow is drawn from node i to node j (i.e. fij). If node j has relative importance over i, then a directed edge is drawn from node j to node i (i.e. fji).
A digraph with N enablers, having no self-loops, can be represented by matrix F = [rij], called the adjacency matrix, where rij represents the interaction (or the weightage of their relation) between the ith enabler and jth enabler, and they are placed as the off-diagonal elements (called interdependencies). The formation of the adjacency matrix is the second step of GTMA. Here, rij is different from rji because the relationship between the enablers is directional in nature and fii is 0, due to the absence of self-loops, since no practice is interacting with self, namely business continuity, market performance during disruption and financial performance during disruption. The diagonal elements represent the inheritance of factors, which represents the significance of ith enabler with respect to the given business outcome (Kavilal et al., 2017). The matrix, called the adjacency matrix, representation gives a one-to-one representation of the digraph. The analysis of the matrix further assists in the calculation of the resilience index (Jain and Raj, 2015). The effect of the resilience enablers on the three performance measures shall be individually taken by creating three matrix representations, as represented by Equations (1–3).
While both digraph and matrix representations help analyse the problem, these representations are not unique. Thus, to develop a unique depiction of the problem, a permanent function representation is used, which forms the third and the last step of the GTMA (Jain and Raj, 2015). The permanent matrix equation is a multinomial, standard matrix function used and defined in combinatorial mathematics. Hence, it is useful in calculating a composite index since no information is lost while calculating a permanent function value. It gives the complete expression for variables effect, as it considers the presence of all attributes and their interdependencies, thereby revealing the effect of variables in a systematic manner (Kumar et al., 2015). The resilience index helps managers compare different SCs while giving an insight into the effect of enablers on the increase or decrease of resilience and, consequently, the effect on SC risk exposure. Permanent function, used in combinatorial mathematics, is a standard matrix function. The permanent is calculated similarly to a determinant where the negative signs are replaced with positive signs (Equation 4). This computation process results in a multinomial whose every term has a physical significance related to the extent of enablers in achieving the business outcome. This representation includes all the information regarding the inheritance of coordination mechanisms and their interactions, thus giving a quantitative representation of enablers and their effect in achieving business outcomes.
3.3 Data collection – about the case company and about experts
The inputs for the present study were taken from the members of a case SC belonging to the Indian automobile industry. The experts were selected based on the snowball sampling method where the research participants are asked to suggest subsequent experts (Section 3.1). Initially, the senior SC manager at OEM was contacted, who further referred to other senior members in the OEM and their tier I and tier II suppliers. The OEM members also referred the authors to the distributors and the retailers. The OEM members also referred to the logistics and the warehouse managers. Besides the members of the SC, two senior professors with expertise in SC management were also contacted to obtain their views. In this manner, 10 experts were selected for the discussion tabulated in Table 3.
For the present study, the resilience enablers identified from the multi-round Delphi survey conducted by Agarwal and Seth (2024) in the context of Indian automobile SCs are considered. These enablers, along with their working definitions as per the study, are tabulated in Table 4.
The business outcomes, namely, business continuity, market performance and financial performance, as identified by Agarwal and Seth (2024), are considered. The enablers and business outcomes were then presented to the industry expert for validation. This ensures relevance and applicability of the variables in context of the study. Once the variables are finalised, experts finalised the interactions among the enablers with respect to the business outcome (Section 4.1). In the structural digraph model developed by Agarwal and Seth (2024), highlighting the hierarchies among the variables was also utilised to draw the directed graphs. The second step after developing the digraph is formulation of adjacency matrix. This matrix quantifies the interactions among the enablers and also between enablers and the business outcomes, as detailed in Section 4.2. The last step entails calculation of permanent function of the adjacency matrix to calculate impact on business outcomes and the resilience index (Section 4.3).
4. Results, findings and discussions
The present section gives the results and findings of the research methods as per the conceptual framework (Figure 1). It is divided into four sub-sections, Section 4.1 providing a diagraph representation of SCR enablers, Section 4.2 elaborating on the matrix representation and Section 4.3 giving the resilience index value of the case SC. Lastly, Section 4.4 gives the theoretical best and worst values of the resilience index.
4.1 Digraph representation of SCR enablers and their interdependencies
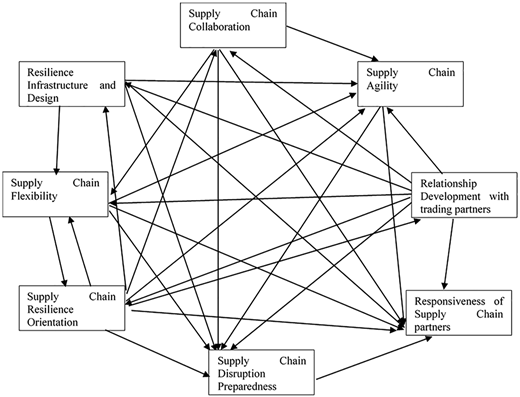
The directed edges are drawn according to the interdependence of these enablers as given in Figure 2. For instance, collaboration with suppliers and information sharing can amplify agility, allowing a company to respond more effectively to disruptions. Therefore, a directed arrow is drawn from SC collaboration towards SC agility. However, since agility is not affecting the collaboration, the directed graph is not drawn. Based on these interactions, digraphs representing the interactions between the enablers in the context of the business outcome are drawn (Figure 2). It should be noted that since resilience enablers serve as foundational capabilities that support multiple business outcomes (e.g. business continuity, market share growth and financial performance), it justifies a common digraph structure representing their interactions.
4.2 Matrix representation of SCR enablers and their interdependencies
The inheritance of each practice and its interdependencies for each business outcome are quantified through discussion with the industry experts based on the decided scale. The strength of the interactions between the enablers for each business outcome is called interdependencies, which are represented as off-diagonal elements. Similarly, the significance of each enabler towards achieving the business outcome is called the inheritance and is represented as a diagonal element. The rating was performed using the scale from 1 to 5 (1 being the lowest and 5 being the highest) for both interdependency and inheritance. For example, the adjacency matrix of business continuity comprises of inheritance (diagonal elements) and the interdependencies (off-diagonal elements). The experts were asked specific question for each of the business outcomes, for example, “For improving business continuity amidst disruption, how is SC agility more important than relationship development with trading partners?” The experts were asked specific questions for each of the business outcome, for example, “What is the significance of SC agility in improving business continuity?” The mode of the ratings obtained from ten experts is chosen to be the final values for depicting the quantification of interdependencies. This method ensures that the final values are reflections of the opinions of the majority of experts, mitigating individual bias, eliminating outliers and improving the robustness of inputs. Furthermore, rating was submitted anonymously and individually since group consensus is not required, unlike the Delphi technique, ensuring transparency and that the opinions are less prone to subjectivity. The adjacency matrix for all business outcomes is given in Tables 5–7.
The following sub-section calculates the permanent function of the adjacency matrix for each of the business outcomes and overall resilience index.
4.3 Supply chain resilience index
In the third and final step, we calculate the permanent function value of the adjacency matrix to obtain the effect of interaction among enablers for achieving business outcomes amidst disruptions and the resilience index. The value of the permanent function is calculated for each of the business outcomes using Equation (4). The calculations were performed with the built-in software provided by https://www.dcode.fr/matrix-permanent. The permanent function value for business continuity, market performance and financial performance is as follows:
Permanent function value for business continuity = 35,856
Permanent function value market performance = 3,186
Permanent function value financial performance = 2,916
The permanent function values reveal the intensity of effect that the interrelationship between the resilience enablers has on the different resilience outcomes in the context of Indian automobile SCs (Jain and Raj, 2015). It quantifies the effect of the resilience enablers on the business outcomes (Gurumurthy et al., 2013). The intensity may be demarcated as the enhancing strength of the enablers for a particular outcome. The intensity (or strength) of the resilience enablers depends on their individual behaviour and the extent of interaction among them. The higher value of the permanent function indicates that a particular outcome is more affected by the interrelationships of the resilience enablers than others (Jain and Raj, 2015). The business continuity of the SC is most impacted, as its permanent function value is the highest, followed by financial performance and market share growth. The permanent function values of the business themselves do itself does not reveal the entire picture about the resilience capability of the SC. Hence, the resilience index is calculated in the next section using the permanent function values of the business outcomes. The following sub-section provides the results of the resilience index and its theoretical minimum and maximum values.
4.4 Resilience index, theoretical best and worst values
The resilience index of the SC is calculated by calculating the interrelationships between the resilience outcome measures and their inheritance values towards resilience. The resilience index shall help assess the SC’s final resilience value. The permanent function values are the inheritance values and form the diagonal element of the matrix representation. The interactions between the business outcomes are also discussed with the experts for the final resilience index.
Matrix representation for the SCR
Permanent function value of the matrix representation.
= SCR Index
= 3.3 × 10¹¹
The SCR index for the Indian automobile SCs is 3.3 × 10¹¹. Whether this value is good is revealed by calculating the theoretical maximum and minimum value of the index. The theoretical minimum and the theoretical maximum value of the permanent value for each business outcome are obtained by substituting the inheritance (or the diagonal elements) with the lowest (very low influence), i.e. 1, and the highest (very high influence) values, i.e. 5 (Anand and Barua, 2023; Jain and Raj, 2015; Muduli et al., 2012). The theoretical minimum and maximum values are given in Table 8.
The maximum and minimum values of the SCR index indicate the range within which it can vary. The current value of each of the business outcomes and the SCR index is lower for the Indian automobile SC. The SCs of the Indian automobile industry need to strengthen the relationship between the resilience enablers to enhance the business outcomes and overall SCR. The future direction of this research is improving the system, as the current value of the resilience index of this work is 3.3 × 10¹¹, which is below the maximum value of 3.6 × 10¹⁷. The value in itself speaks of the scope of improvement in the interactions among enablers for achieving business outcomes amidst disruptions.
5. Conclusion, implications for theory and practice, limitations and recommendations for future studies
The conditions surrounding the business environment are dynamic, making SCs vulnerable to disruptions and necessitating building resilience capability in them. Since developing such capabilities in SCs requires immense investment, managers require continuous evaluation of the efficiency and effectiveness of action. In particular, it is beneficial if they are able to quantify the extent to which the resilience enablers impact the different business outcomes amidst disruptions while considering their interactions. Such a kind of analysis is scant in the existing literature and will be superior to other variance-based analyses, as it will holistically consider all major resilience enablers and the weights of their interrelationships, particularly in the context of Indian automobile SCs (Soni et al., 2014; Kumar et al., 2015).
The present study aims to create a digraph representing the interactions among the resilience enablers and quantifying them to determine a single numerical index for SCR using GTMA. GTMA is used because it helps in quantifying relationships among the variables and arriving at a single numerical index describing their effect on business outcomes and hence resilience amidst disruptions. For this purpose, a case automobile SC was considered, and its members were considered as experts for developing the interactions which are depicted through a structured digraph. These interactions were quantified and converted into an adjacency matrix, with the diagonal elements indicating the interactions between the enablers and off-diagonal elements, indicating the significance of each enabler in achieving each business outcome (inheritance). The resilience enablers are taken from Agarwal and Seth (2024), namely, SC agility, relationship development with trading partners, resilience infrastructure and design, responsiveness of SC partners, SC resilience orientation, SC disruption preparedness, SC collaboration and SC flexibility.
The values depict that the interrelationships between the enablers help the most in business continuity, followed by market share growth and financial performance. These values are further used as inheritance values for calculating the final resilience index for the Indian automobile SCs. The future direction of this research is improving the system, as the current value of the resilience index of this work is 3.3 × 10¹¹, which is below the maximum value of 3.6 × 10¹⁷. This value in itself speaks of the scope of improvement in the effect each enabler has on the business outcome to increase the resilience in SC (Anand and Barua, 2023; Agarwal and Seth, 2024). The implications of the present study for theory and managers are discussed in the next sub-section.
5.1 Implications for theory and practitioners
The present study sets out to quantify the interactions among the resilience enablers to yield the intensity of their effect on various business outcomes amidst disruptions. With the help of GTMA, the study quantified these interactions for different business outcomes and obtained a resilience index for the Indian automobile SCs (Anand and Barua, 2023). The index value shall facilitate managers in tracking SC resilience over time by assessing it before and after implementing risk management measures. The index value, along with the theoretical best and worst values, enables benchmarking of current performance and assessment of the feasibility of improvement from the present performance. By changing the values of interdependencies and inheritance values, the method also supports scenario planning, helping managers visualise how disruptions might cascade through interrelated logistics elements, thereby informing better contingency strategies in international trade settings (Gohr et al., 2022). Since the present study evaluates the outcomes of resilience intervention not only by a particular enabler but by all the enablers and their relationships, it shall enable managers to take meaningful actions through categorisation and suitable mitigation and facilitates organisations to assess resilience for tracking it over time (Zeiser et al., 2025).
The quantification method can be utilised in other industry and country contexts to analyse the resilience of their SCs. Furthermore, these values may act as a benchmarking tool to compare the resilience value for different industries and also within the same industries. Based on the comparisons, managers can invest more in incorporating enablers in their SCs or they can improve upon the interactions among the enablers for a business outcomes for improving overall resilience. Furthermore, the resilience of each player may also be analysed in this manner for different business outcome to assess their preparedness for disruptions. By serving as a mathematical boundary, the theoretical best and worst values also enable normalisation of results, thereby facilitating comparison among alternatives and scenarios. Policymakers or managers may assume a “theoretical best” reflects an achievable ideal and thereafter can then decide upon the corrective actions to improve the interactions among enablers or they might invest more enablers for their suppliers to enhance resilience. The SCs can together arrive at the theoretical best and worst values for their network and decide on a corrective action to keep the resilience index within these values only, making the methodology applicable for the entire SC instead of just one organisation. The study presents the case of Indian automobile SCs; however, the methodological rigour can be duplicated across SCs of other industries, making the analysis contextual to their industry and country context. With this, the study fulfils the initial issue present in resilience literature of analysis not being discussed in industry and country contexts.
The findings of the present study may also act as validation tool in variance-based studies to assess the magnitude of change of resilience with enhancement in resilience enablers. Furthermore, all possible interactions among variables can be varied to analyse the outcomes for improving resilience, which is a limitation in variance-based analysis. This characteristic can provide a complete picture of connectivity and dependency within networks, which is useful for network robustness studies (Li and Sukhotu, 2025).
5.2 Limitations and future scope of research
The scope of the present study is limited to a single SC belonging to the Indian automobile industry and its members. The future studies may consider several SCs to achieve a comprehensive understanding of resilience for the industry. Furthermore, the future studies may evaluate the resilience of different segments of the automobile industry, namely by vehicle type and by fuel type and compare them for obtaining insights about the industry. These can be assessed by using the methods used in the present study to find if their relationships vary between different parts of the nation and across segments.
Thereby, despite a few flaws, this research can be expected to be an excellent foundation for additional future research towards the adoption of more resilient practices in different industries of the emerging economies. The answers may be useful in validating the findings obtained in the study. The second is to replicate this study in other territorial contexts and assess possible convergences (e.g. industrial symbiosis). A key role will be to consider policies to define which ones are capable of promoting a sustainable transition from the present system. The third concerns a different panel of experts that could lead to different indications. GTMA findings may be used to calculate the best and worst values for the purpose of comparison between companies belonging to different tiers of the SC and for benchmarking the performance with the leader. The researchers may also attempt to identify if the different sources of risk lead to differences in enablers across the industry, and future researchers can attempt to find more relevant drivers in this context. Lastly, the use of a permanent function to quantify the resilience index and effect of interactions between enablers in obtaining business outcomes into a single scalar value. This may oversimplify complex systems and mask individual factor contributions. Decision-makers may find it difficult to understand which variables most influenced the final value, as a higher or lower contribution eventually increases or decreases the overall index value.