

The impact of anisotropic cracking on concrete mechanically degraded by alkali–silica reaction (ASR) under multi-axial restraint conditions was quantitatively explored. An experimental framework was established to observe and correlate the expansion, compressive behaviour and crack patterns from different directions across specimens under free expansion, uniaxial restraint and biaxial restraint. Anisotropic expansion was induced using a newly fabricated fixture and clear cracking anisotropy based on anisotropic restraint directions was revealed through image analysis. Correlating the compressive behaviour with the crack orientation distribution revealed that specimens with a higher proportion of cracks orthogonal to the compressive loading direction exhibited lower compressive strength and elastic modulus despite similar volumetric expansions. This finding highlights the inadequacy of evaluating ASR-induced degradation in restrained concrete based solely on volumetric expansion or parallel cracks to the compressive loading direction, emphasising the need to consider the negative impact of orthogonal cracks in ASR modelling. The methodology and findings of this study establish a foundation for accurately assessing ASR damage in concrete structures under complex restraints.
Notation
Introduction
Anisotropic mechanical degradation induced by alkali–silica reaction (ASR)
ASR causes significant concrete structural degradation. Under restrained conditions, ASR-induced expansion develops preferentially in the direction of lower restraint stress, resulting in anisotropic expansion behaviour in concrete (Farooq et al., 2024; Gautam et al., 2017a; Kagimoto et al., 2014; Morenon et al., 2017; Multon and Toutlemonde, 2006; Multon et al., 2006; Takahashi et al., 2023). Experimental studies have been conducted to investigate the effect of ASR on the mechanical properties of concrete under anisotropic expansion (Ferche and Vecchio, 2022; Gautam et al., 2017b; Zahedi et al., 2022). Ferche and Vecchio (2022) prepared five groups of specimens under uniaxial and biaxial restraints with different confining stresses and subjected them to ASR acceleration. Among the five tested specimen groups, two exhibited better mechanical properties when compression test loading was conducted in the direction of higher restraint stress, whereas the other groups exhibited the opposite. Gautam et al. (2017b) and Zahedi et al. (2022) reported that specimens under higher restraint stress exhibited enhanced mechanical properties compared with specimens with lower restraint stress. Barbosa et al. (2018) and Hansen and Hoang (2021) observed that cores drilled from the direction parallel to the restraint yielded a higher compressive strength than those drilled from a direction perpendicular to the restraint. The conclusions from these studies regarding ASR-induced anisotropic mechanical behaviour are not entirely consistent. Furthermore, a quantitative evaluation of anisotropic mechanical degradation could not be extracted from these studies because of insufficient documentation regarding expansion in certain directions. These limitations hinder precise ASR-induced deterioration prediction in existing reinforced concrete structures. Further studies are needed to elucidate the principles of ASR-induced degradation and quantitatively predict mechanical deterioration under restrained conditions.
Impact of crack orientation on anisotropic mechanical behaviour
Previous studies have highlighted that the anisotropic mechanical properties of ASR-affected concrete under restraint are influenced by ASR-induced crack orientation (Barbosa et al., 2018; Darveau et al., 2024; Fujishima et al., 2024; Hansen and Hoang, 2021; Hayes et al., 2020; Zahedi et al., 2022). Hansen and Hoang (2021) indicated that samples with cracks aligned orthogonally to the loading direction exhibited lower compressive strength owing to ASR-induced crack closure and unstable fracture progression compared with those with a parallel crack orientation. Therefore, analysing the impact of crack orientation is crucial for understanding anisotropic mechanical degradation in ASR. However, studies on the crack orientation effect often lack simultaneous documentation on the expansion, mechanical properties and quantitative crack orientation distribution. Hansen and Hoang (2021) conducted compression tests on specimens drilled in different directions relative to the restraint of ASR-damaged concrete slabs while simultaneously investigating the oriented crack pattern. However, the unknown expansion levels of these samples suggest that they may not have been compared at equivalent deterioration levels, providing only a qualitative crack orientation effect assessment. Kongshaug et al. (2020) and Zahedi et al. (2022) thoroughly measured anisotropic expansion development using compression tests conducted in different restraint directions. However, crack orientation was investigated in only one sample or was indirectly estimated in these studies. Hence, although anisotropic crack patterns under restrained conditions were identified, a quantitative correlation between crack orientation and mechanical degradation could not be derived. Consequently, previous studies have not quantitatively assessed how crack orientation affects the anisotropic mechanical properties under multi-axial restraint, particularly with regard to ASR-induced anisotropic expansion. To clearly reveal the mechanisms underlying anisotropic mechanical behaviour, it is essential to comprehensively investigate the corresponding crack orientation, expansion and mechanical behaviour across different directions.
Incorporating the effect of crack orientation on ASR-induced anisotropic behaviour is essential for modelling ASR-affected concrete. The reduction in mechanical properties caused by ASR-induced cracks at different angles could differ from that of mechanically induced cracks. Cracks caused by external bending loads in concrete members have minimal impact on mechanical properties when compressive stresses are applied perpendicular to the cracks. On the other hand, compressive strength decreases when compressive stress acts in the direction parallel to mechanically induced cracks. Miura et al. (2022a) explained the mechanism of this mechanical property degradation numerically, showing that it can be explained by whether the stress transfer area in the cross-section is decreased. Vecchio and Collins (1986), Cervenka (1985) and Miyahara et al. (1987) proposed a strength reduction model that correlates compressive strength reduction with cracks parallel to the direction of compressive stress. This model has been considered in constitutive laws based on the finite-element method (FEM). However, in the case of ASR-induced cracks, the reduction in mechanical properties is likely greater when compressive stress is applied perpendicular to the cracks, as noted in previous research (Hansen and Hoang, 2021), unlike mechanically induced cracks. Current constitutive models using the FEM do not consider this potential reduction trend. Therefore, further investigation is needed to thoroughly understand the relationship between compressive behaviour and crack orientation, and to develop an index for evaluating the anisotropy in mechanical properties owing to ASR-induced cracking.
Research significance
The aim of this study was to quantitatively explore the correlations between mechanical properties and crack orientation in ASR-affected concrete under multi-axial restraint conditions. An experimental framework was established, comprising three groups of specimens subjected to ASR exposure and varying restraint conditions. Compression testing and crack pattern analysis were conducted in multiple directions, allowing for the acquisition of comprehensive data on the three-dimensional (3D) expansion, crack patterns and compressive behaviour of each specimen. Quantitative correlations between crack orientation and mechanical properties were established based on image analysis of crack patterns. This research enhances the understanding of ASR-induced mechanical degradation mechanisms associated with anisotropic expansion under restraint. The findings of this study provide a foundation for more accurate prediction of ASR-induced damage in existing concrete structures subjected to complex restraints.
Experimental programme
Materials and specimen preparation
Specimens were prepared in three restraint states – three specimens were unrestrained (free), six were uniaxially restrained one-dimensional (1D) and six were biaxially restrained two-dimensional (2D). The specimens were cast in moulds of size 12.5 × 12.5 × 12.5 cm3. The mix proportions are provided in Table 1. Ordinary Portland cement with a density of 3.16 kg/m3 and 0.56% sodium oxide (Na2O) was used in this study. Reactive andesite with a surface dry density of 2.64 g/cm3 was used as gravel, while non-reactive sand with a surface dry density of 2.63 g/cm3 was used as fine aggregate. For ASR acceleration, additional alkali was added with sodium hydroxide (NaOH) pellets to make a total sodium oxide equivalent of 10 kg/m3. The specimens were demoulded 1 day after casting and subsequently subjected to sealed curing for 100 days in a room maintained at a constant temperature of 23°C. Two supplementary specimens were cast and cured under the same conditions without sodium hydroxide pellets to serve as a non-ASR reference. Their average compressive strength and elastic modulus were 30.7 MPa and 49.2 GPa, respectively.
Experimental methods
Specimen preparation for ASR acceleration
After the curing period, contact chips were mounted on the specimens for length measurements with a dial gauge and restraint was subsequently applied. To quantify the 3D expansion of the specimens under ASR comprehensively, the mounting position of the contact chips for each specimen group was designed, as shown in Figure 1 (Takahashi et al., 2024). The distance between each pair of contact chips was 10 cm. To measure the expansion of restrained specimens during the acceleration stage, specially made extensions were connected to the dial gauge, allowing it to reach the contact chips shielded by the steel plates. However, continuous expansion measurement during the ASR acceleration process was not feasible when the position of the contact chips was obscured by steel plates and bars. Therefore, the expansion at these positions was measured before applying and after releasing the restraint. The specific measurement locations and methods are detailed in Figure 1.
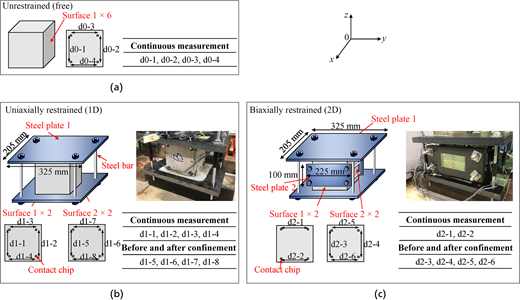
Method of expansion measurement and settings for restraint application in group: (a) Free; (b) 1D; (c) 2D
Method of expansion measurement and settings for restraint application in group: (a) Free; (b) 1D; (c) 2D
As shown in Figures 1 and 2, steel plates with two different dimensions, each 20 mm thick, were used to apply restraint to the specimens. Each steel bar passed through 20 mm dia. holes on two opposite faces of the specimen, and the restraint force was introduced to the specimen by tightening the corresponding bolts. In contrast to the restraint application method used in previous studies (Gautam and Panesar, 2016; Gautam et al., 2017a; Kawabata et al., 2021; Zahedi et al., 2022), the prestressed steel bars did not penetrate the specimens in this study, maintaining the regular shape of the specimens and thus benefiting subsequent mechanical testing. Greased Teflon sheets were placed between each steel plate and the restraint surface to minimise friction. A strain gauge (Flab-3-11-5LJCT-F, Tokyo Measuring Instruments) was attached to the surface of each steel bar and the restraint stress was controlled by monitoring the strain of the steel bars, which was calculated as:
where d is the effective diameter of the steel bar (=8 mm), is the strain recorded on the data logger for each of the four steel bars in one direction, E is the steel bar’s elastic modulus (=184 GPa) and is the concrete specimen surface area in contact with the steel plate.
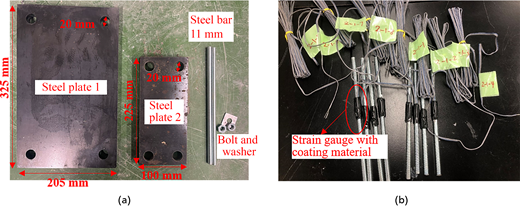
Preparation of steel plates and steel bars for restraint application: (a) materials for restraint application; (b) strain gauges attached to steel bars
Preparation of steel plates and steel bars for restraint application: (a) materials for restraint application; (b) strain gauges attached to steel bars
Restraint was applied to the specimens twice to refine the method and induce effective anisotropic mechanical performance. Initially, a passive restraint method was used with the tightening of each steel bar to achieve a tensile strain of around 0.015%, generating around 0.4 MPa confining stress on the specimen surface. According to the previous literature (Kawabata et al., 2021), the ultimate expansive pressure was approximately 2.0 MPa when the diameter of the steel bars was 9.2–13.0 mm. In this study, the imposed stress was significantly lower than the ultimate expansive pressure, indicating a passive constraint condition. The specimens were then placed in a chamber (40°C and 100% relative humidity) for ASR acceleration. However, both the restraint and unrestraint directions of the confined specimens exhibited a similar expansion of around 0.15%, indicating the passive method's ineffectiveness in inducing anisotropic expansion. It is also likely that deformation of the grease layer between the specimen and the steel plate could absorb the stress that should be applied to the specimen. Therefore, ASR acceleration was halted at 18, 22 and 22 days for the free, 1D and 2D specimens, respectively, by transferring the specimens from the acceleration chamber to a curing room at 23°C. Subsequently, the restraint was released from all the specimens and the specimens were sealed to re-evaluate the bolting conditions. Additionally, based on previous studies (Ji et al., 2021; Miura et al., 2022b), it was assumed that the 0.15% expansion at this stage did not cause significant damage to the specimen’s mechanical properties, particularly its compressive strength. To enhance anisotropic behaviour, an active restraint method was applied to the 1D and 2D specimens 89 days from the start of the initial acceleration. Based on previous studies (Berra et al., 2010; Kawabata et al., 2021) that indicated that an ultimate pressure of approximately 3.0 MPa induced anisotropic expansion, a stress of 4–5 MPa was applied in each restraint direction for the 1D and 2D specimen groups. Subsequently, all the specimens were returned to the test chamber set at 40°C and 100% relative humidity to recommence ASR acceleration.
Specimen processing, compression testing and crack observation after ASR acceleration
ASR acceleration was stopped when an approximate 0.4% expansion was exhibited in the free specimens. Subsequently, to obtain the expansion, compressive behaviour and crack patterns of the same specimen, the specimens were cut and tested using the approach shown in Figure 3. Each specimen was first cut into two equal halves, with one half used for compression testing. The other half was sliced into slices approximately 1 cm thick for crack observation. Furthermore, the specimens were cut in different directions to enable compression testing relative to cracks in various orientations. The cutting and loading directions for each specimen are shown in Figure 4, along with the expected cracking orientation drawn on the specimens. The specimens were labelled with the restraint condition and specimen numbering, as shown in Figure 4. For instance, 1D-2 represents the second specimen in the 1D restraint group. As shown in Figure 4, the 1D and 2D specimens were expected to exhibit more cracks along the unrestrained directions. This cutting method allowed an assessment of compressive behaviour when loading was applied parallel or orthogonal to the primary cracks. The angle between the loading direction and expected cracks on the cutting surface is marked with O or P for the 1D and 2D specimens in Figure 4: O means that the primary crack generated in the specimen was expected to be orthogonal to the loading direction, while P means that the primary crack generated in the specimen was expected to be parallel to the loading direction. For the cracks expected to be generated in the direction perpendicular to the cutting surface, this direction relationship is marked in parentheses as the cracks could not be observed by crack pattern analysis.
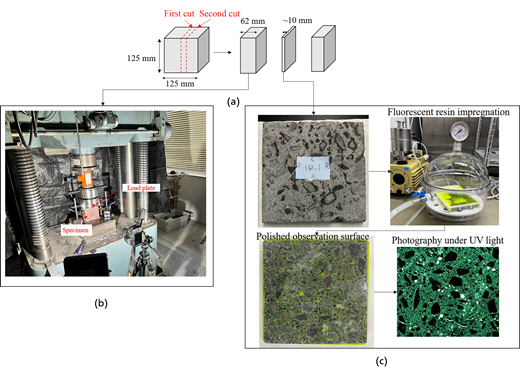
Test sequence after ASR acceleration: (a) cutting method; (b) compression testing; (c) crack observation
Test sequence after ASR acceleration: (a) cutting method; (b) compression testing; (c) crack observation
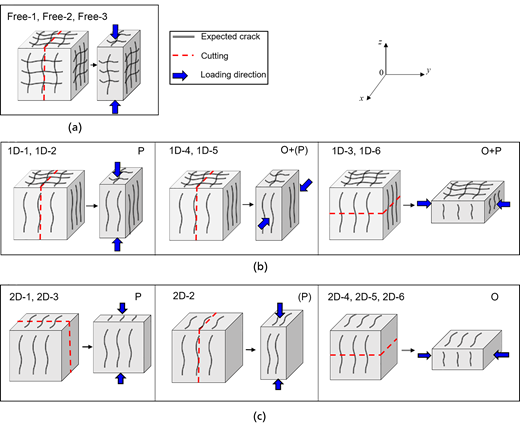
Cutting and loading directions: (a) free specimens; (b) 1D specimens; (c) 2D specimens
Cutting and loading directions: (a) free specimens; (b) 1D specimens; (c) 2D specimens
For the 1 cm thick samples cut from the specimens, a series of processing steps was conducted to prepare the samples for crack observation, as shown in Figure 3(c). First, the samples were cleaned with isopropanol in a ultrasonic cleaner, and dried in an oven at 40°C. Subsequently, an ultra-low-viscosity resin (AGAR R1370) premixed with a resin hardener, resin accelerator and fluorescent dye (Epodye) was used to impregnate the samples. The impregnation was conducted under −0.1 MPa vacuum conditions for 1 h to promote a more complete resin infiltration into the cracks. After impregnation, the samples were placed in a 40°C oven for 3–5 days to ensure complete hardening. Then, the specimens were polished with silicon carbide papers (in the sequence #80, #400, #800 and #1200) and diamond paste (in the sequence 9, 6 and 3 µm) until a smooth surface was obtained for imaging. Finally, images were taken using a Canon macro lens (EF-S35 mm F2.8) under ultraviolet (UV) irradiation (UV radiation intensity 2020 μW/cm2; UV wavelength 254 nm). The resolution of each image was calibrated for statistical crack analysis.
Image analysis of crack patterns
Several image analysis steps were performed using the captured crack pattern images, including phase segmentation, crack identification and crack parameter analysis. The processed images for each step are shown in Figure 5. First, phase segmentation was conducted using Ilastik, an open-source software that has been widely used in previous studies (Berg et al., 2019; Brisard et al., 2020; Thakur et al., 2023). This process integrated manual crack annotation with automatic segmentation using embedded machine learning algorithms using the software interface illustrated in Figure 5(a). During this process, the segmentation results were compared with the original images and specimens to ensure accuracy. The segmentation was iteratively refined until the cracks and voids were distinctly separated from the other image contents. Cracks and voids were then differentiated using a circularity threshold of 0.25, as established in a previous study (Ji et al., 2024). The remaining voids that were not fully removed from the crack areas were manually erased by comparison with the original images, resulting in the final crack phase segmentation (Figure 5(b)).
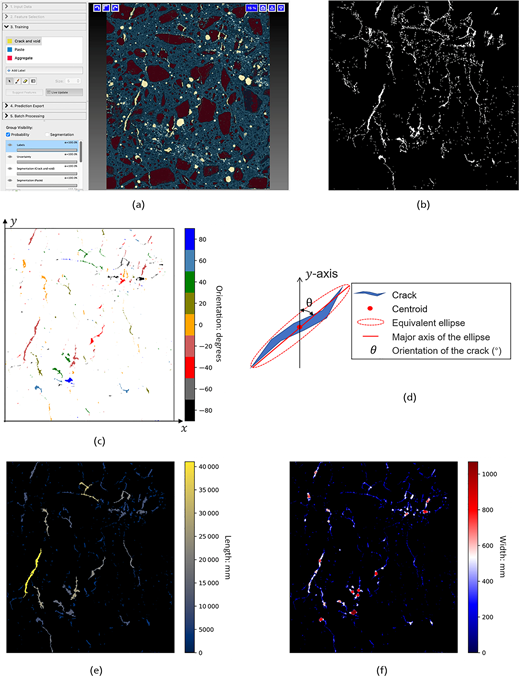
Crack analysis: (a) phase segmentation; (b) segmented cracks; (c) crack orientation measurement; (d) criteria for crack orientation; (e) crack length measurement; (f) crack width measurement. A full-colour version of this figure can be found on the ICE Virtual Library (Link to Emerald InsightLink to the website of emerald.)
Crack analysis: (a) phase segmentation; (b) segmented cracks; (c) crack orientation measurement; (d) criteria for crack orientation; (e) crack length measurement; (f) crack width measurement. A full-colour version of this figure can be found on the ICE Virtual Library (Link to Emerald InsightLink to the website of emerald.)
After the crack phase segmentation, the crack index (orientation, length and width) distribution for each specimen was analysed. First, the crack pattern orientation distribution was measured using several processing steps. Each crack was individually identified using the ‘label’ function (Figure 5(c)) in the Skimage Python package (Van der Walt et al., 2014). The orientation of each crack was determined by measuring the angle between the cracks and the image vertical axis (Figure 5(d)), resulting in a crack orientation distribution ranging between –90° and 90°. Both the length and width distributions were analysed following the processing and the calculation methods established by Ji et al. (2024). The length distribution was determined by calculating the skeleton length of each crack and the width distribution was measured using the local thickness method PoreSpy (Gostick et al., 2019). The results of sample length and width analysis are shown in Figures 5(e) and 5(f), respectively.
Experimental results
Expansion
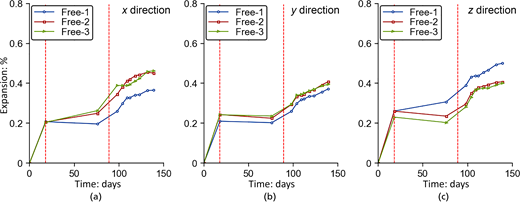
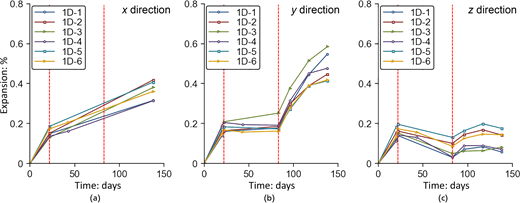
The 3D expansions for the free, 1D and 2D specimen groups are shown in Figures 6–8, respectively. During the first 22 days, minimal differences were observed between the restrained and non-restrained directions in both the 1D and 2D specimens, indicating that the restraints were not effectively applied. After the ASR acceleration pause (as described in the section ‘Specimen preparation for ASR acceleration’), the restraint stress was increased. The ASR halting stage is indicated by the interval between the dashed vertical lines in Figures 6–8. Except for the expansion in the x direction for the 1D specimens and in the x and z directions for the 2D specimens, the 3D expansion was measured before the onset of the second acceleration phase, showing limited growth during the ASR pause stage. Subsequently, as shown in Figures 7 and 8, clear anisotropy owing to the restraint direction became evident in the 1D and 2D specimens during the second acceleration stage, as reflected in the 3D expansion variation rates and final expansion.
Expansion progression of 1D specimens. A full-colour version of this figure can be found on the ICE Virtual Library (Link to Emerald InsightLink to the website of emerald.)
Expansion progression of 1D specimens. A full-colour version of this figure can be found on the ICE Virtual Library (Link to Emerald InsightLink to the website of emerald.)
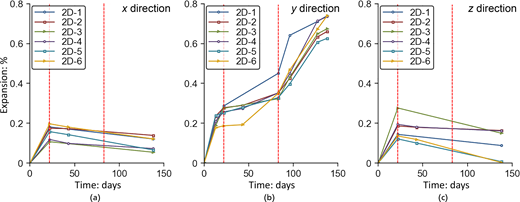
As shown in Figure 6, expansion of the three free specimens in each direction stabilised at an average value of 0.42%. For the 1D specimens (Figure 7), the z-direction expansion exhibited a minimal increase after applying the second restraint, resulting in a significantly lower final value compared with the other directions. For the 2D specimens (Figure 8), the y-direction expansion increased to approximately 0.70%, while the x- and z-direction expansions remained below 0.20% by the end of ASR acceleration process. The expansion in the restrained direction was almost completely suppressed during the second acceleration stage. This anisotropic expansion aligns with the findings reported elsewhere (Berra et al., 2010; Kawabata et al., 2021), further confirming that a stress exceeding 3.0 MPa could be sufficient to induce expansion anisotropy under 1D and 2D restraint conditions.
Compression tests
The measured stress–strain curves of all the specimens under compression testing are shown in Figure 9. The compressive behaviour of the three free specimens exhibited little uniformity. The 1D and 2D specimens exhibited two distinct compressive behaviour patterns. Considering the cutting direction (Figure 4) and anisotropic expansion (Figures 7 and 8) of the 1D and 2D specimens, it can be observed that compressive loading along the dominant expansion direction of the specimen typically resulted in a lower compressive strength or elastic modulus, whereas loading perpendicular to this direction tended to yield higher values.
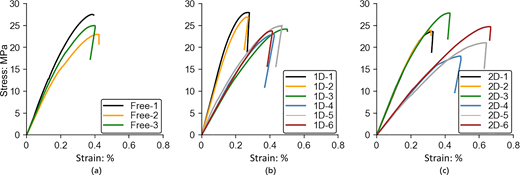
Compressive behaviour: (a) free specimens; (b) 1D specimens; (c) 2D specimens. A full-colour version of this figure can be found on the ICE Virtual Library (Link to Emerald InsightLink to the website of emerald.)
Compressive behaviour: (a) free specimens; (b) 1D specimens; (c) 2D specimens. A full-colour version of this figure can be found on the ICE Virtual Library (Link to Emerald InsightLink to the website of emerald.)
To further investigate the impact of the loading direction on the specimens' compressive behaviour, their mechanical properties were analysed for various expansion forms calculated from different directions, as shown in Figures 10 and 11. These expansion forms included the average expansion, the loading-direction expansion and the expansion perpendicular to the loading direction, which were calculated as:
where refer to the expansion in the three directions and refers to the loading direction.
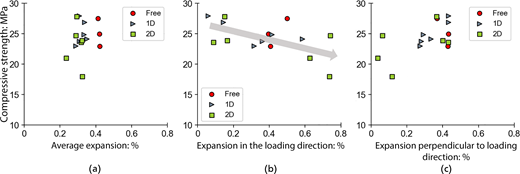
Relationship between compressive strength and expansion: (a) averaged; (b) in the loading direction; (c) perpendicular to loading direction
Relationship between compressive strength and expansion: (a) averaged; (b) in the loading direction; (c) perpendicular to loading direction
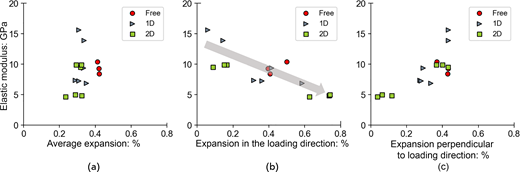
Relationship between elastic modulus and expansion: (a) averaged; (b) in the loading direction; (c) perpendicular to loading direction
Relationship between elastic modulus and expansion: (a) averaged; (b) in the loading direction; (c) perpendicular to loading direction
The expansion perpendicular to the loading direction includes contributions from two directions, and may differ significantly. However, this difference was not considered in this analysis; instead, the average value (Equation 4) was used.
The relationships between compressive strength and average expansion, loading-direction expansion and expansion perpendicular to the loading direction are shown in Figures 10(a)–10(c), respectively. Similarly, the relationships between the elastic modulus and these three expansions are shown in Figures 11(a)–11(c), respectively. As shown in Figures 10(a) and 11(a), despite similar average expansion levels across all specimens, significant differences in the mechanical properties were found. This underscores the need for mechanical degradation assessment in ASR-deteriorated specimens beyond reliance on the average expansion alone. Figures 10(b) and 11(b) show the negative correlation between mechanical properties and the loading-direction expansion, as highlighted by the trend arrows in the figures. Conversely, a positive correlation between mechanical properties and expansion perpendicular to the loading direction is shown in Figures 10(c) and 11(c). This phenomenon suggests that expansion along the loading direction induces a higher mechanical degradation than that perpendicular to the loading direction. Furthermore, these findings highlight the importance of considering both anisotropic expansion and loading direction when evaluating ASR-induced mechanical degradation, particularly under restrained conditions.
When the specimens were restrained, the restrained-direction expansion tended to be suppressed and transferred to the non-restrained direction. That is, fewer cracks were generated orthogonal to the restraint direction, whereas more cracks were generated parallel to the restraint direction. The results shown in Figures 10 and 11 suggest that the specimens experiencing comparable volumetric expansion displayed different mechanical responses based on the crack orientation relative to the loading direction. Accordingly, it can be inferred that the specimens with cracks predominantly parallel to the loading direction exhibit better mechanical properties, whereas those with cracks primarily orthogonal to the loading direction exhibit poorer mechanical properties. This crack orientation effect is further investigated and confirmed using crack pattern analysis in the next section.
Crack pattern analysis
Figure 4 shows that the crack orientations on the observation surface were expected to exhibit a single distribution in free specimens relative to the compressive loading direction, whereas the 1D and 2D specimens were anticipated to show three and two distinct distributions, respectively. Representative specimens from each of the above six crack orientation patterns are shown in Figure 12. The complete set of patterns for all the specimens is available in the online supplementary material (Figures S1–S3). For a clearer crack visualisation and considering the edge damage during specimen preparation, an 8 × 8 cm2 region from the central area of each sample was extracted for display purposes. Crack patterns are displayed with vertical edges aligned along the loading direction and the segmented cracks are highlighted in red. Specimen names followed by O or P indicate the anticipated dominant crack orientations as orthogonal or parallel to the loading direction on the crack observation surface, respectively, based on restraint conditions. By comparing the results shown in Figures 4 and 12, it can be seen that oriented cracks were generated, as expected, according to the restraint direction. The mechanical properties of these selected specimens are listed in Table 2, revealing lower mechanical properties for the specimens characterised by orthogonal cracks relative to the loading direction, particularly within the same restraint group.
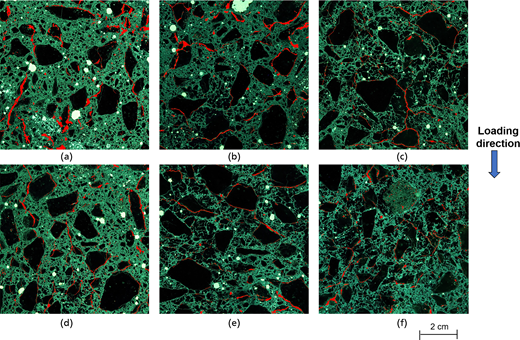
Crack patterns of selected specimens: (a) 1D-1 (P); (b) 1D-4 (O); (c) 1D-6 (O+P); (d) 2D-3 (P); (e) 2D-6 (O); (f) Free-2 (O+P). A full-colour version of this figure can be found on the ICE Virtual Library (Link to Emerald InsightLink to the website of emerald.)
Crack patterns of selected specimens: (a) 1D-1 (P); (b) 1D-4 (O); (c) 1D-6 (O+P); (d) 2D-3 (P); (e) 2D-6 (O); (f) Free-2 (O+P). A full-colour version of this figure can be found on the ICE Virtual Library (Link to Emerald InsightLink to the website of emerald.)
Compressive strength and elastic modulus of selected specimens
| Compressive strength: MPa | Elastic modulus: GPa | ||
|---|---|---|---|
| 1D-1 (P) | Figure 12(a) | 27.96 | 15.64 |
| 1D-4 (O) | Figure 12(b) | 22.97 | 7.36 |
| 1D-6 (O+P) | Figure 12(c) | 23.75 | 7.26 |
| 2D-3 (P) | Figure 12(d) | 27.83 | 9.92 |
| 2D-6 (O) | Figure 12(e) | 24.72 | 5.01 |
| Free-2 (O+P) | Figure 12(f) | 22.96 | 8.41 |
Crack size distribution
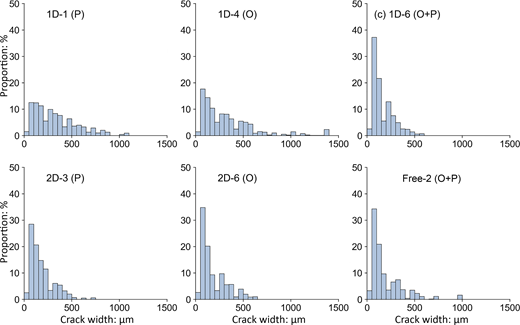
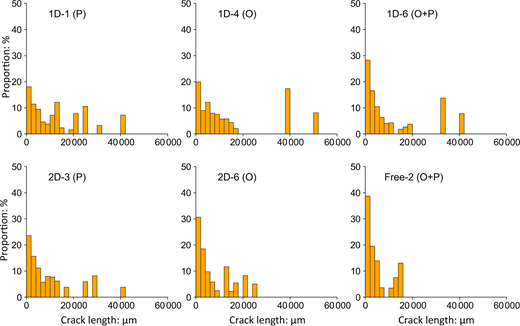
Figures 13 and 14 show the width and length distributions of the specimens shown in Figure 12, respectively. The crack width and length distributions of all the specimens tested in this study are provided in Figures S4 and S5 of the online supplementary material. The vertical axes in Figures 13 and 14 represent the area of cracks within a specific width or length range relative to the total cracking area. The crack behaviour was successfully quantified through image analysis. Despite variations in the mechanical properties of the specimens in the same restraint group, the crack lengths and widths tended to be distributed in similar ranges. Specimen 2D-3 exhibited larger cracks, even though its mechanical properties were better than those of specimen 2D-6. Moreover, the 1D specimens exhibited greater maximum crack lengths and widths than the 2D specimens, despite their mechanical properties being generally higher. Consequently, although the crack information, including width and length, was identified to have an impact on ASR-induced degradation in previous studies (Giaccio et al., 2008; Ji et al., 2024), the results of this work indicate that crack width or length tended to have a limited effect on the mechanical properties of the tested specimens. In the works of Giaccio et al. (2008) and Ji et al. (2024), the identified cracks were under 500 μm wide and under 7500 μm long, with specimen expansion in any direction not exceeding 0.4%. However, in the present study, the final expansion level was significantly higher, with the maximum expansion under unrestrained conditions reaching 0.6%. The detected crack widths and lengths were also larger, with widths of approximately 1500 μm and lengths of up to 60 000 μm. Based on a comparison with previous studies, it can be assumed that, once cracks exceed a certain dimension, further variations may not affect the mechanical properties.
Crack orientation distribution
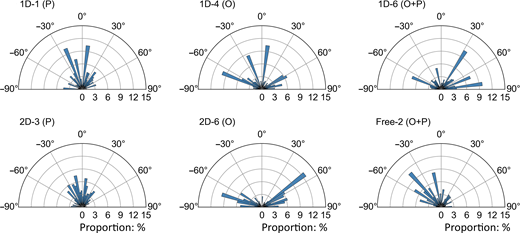
Figure 15 shows the crack orientation distributions of the specimens shown in Figure 12, where the angular axis represents the crack orientation and the radial axis denotes the area of cracks with a specific orientation relative to the total crack area. The crack orientation distributions of all the specimens tested are shown in Figure S6 of the online supplementary material. It is worth noting that 0° indicates the loading direction. As shown in Figure 15, the cracks in specimen 1D-1 were predominantly concentrated at approximately 0°, with a few cracks orthogonal to the loading direction. Concurrently, this specimen exhibited the highest compressive strength and elastic modulus among the analysed 1D specimens, as shown in Table 2. In contrast, specimen 2D-6 lacked cracks parallel to the loading direction, with most cracks oriented orthogonally within the ranges (−90°, −60°) and (60°, 90°), resulting in its lower mechanical properties, particularly the lowest elastic modulus of all the specimens. Analysis of the combined crack orientation distribution (Figure 15) and mechanical properties (Table 2) revealed that specimens with a higher proportion of cracks near 0° typically had higher compressive strength and elastic modulus. Conversely, specimens with a predominance of cracks near −90° or 90° tended to exhibit lower mechanical properties. Therefore, when the volumetric expansion of these specimens was similar, the specimens’ mechanical properties were closely affected by the crack orientation.
To further investigate the quantitative correlation between crack orientation and mechanical properties, each crack was divided into parallel and orthogonal components by projecting it onto the loading direction and the direction perpendicular to loading:
where are the area and orientation of a single crack, respectively, and is the total number of cracks.
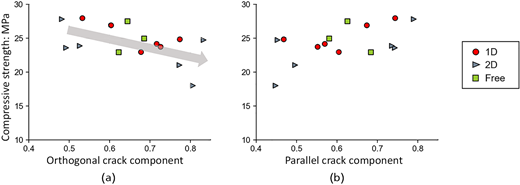
Figure 16 shows the relationship between compressive strength and crack orientation, while Figure 17 shows the relationship between the elastic modulus and crack orientation. As indicated by the trend arrows in Figures 16(a) and 17(a), a clear negative correlation between orthogonal cracks and mechanical properties was observed. In contrast, the correlation between parallel cracks and mechanical properties was the opposite, likely owing to the inverse relationship between the proportion of parallel and orthogonal cracks. These results suggest that orthogonal cracks have a more detrimental effect on the mechanical properties than parallel cracks. At equivalent expansion levels, an increase in the number of orthogonal cracks was associated with a more significant degradation in mechanical properties.
Relationship between compressive strength and (a) orthogonal cracks and (b) parallel cracks
Relationship between compressive strength and (a) orthogonal cracks and (b) parallel cracks
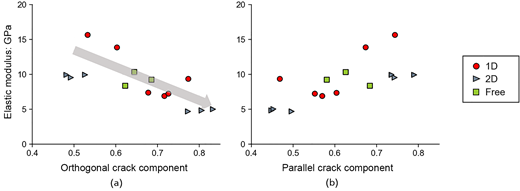
Relationship between elastic modulus and (a) orthogonal cracks and (b) parallel cracks
Relationship between elastic modulus and (a) orthogonal cracks and (b) parallel cracks
Impact of crack patterns on ASR-induced mechanical degradation
Impact of crack orientation
Based on the experimental results, the anisotropic expansion induced by the anisotropic restraint resulted in pronounced directional cracking in the ASR-deteriorated specimens. Under similar volumetric expansion conditions, a significant negative correlation was observed between the mechanical properties and orthogonal crack components. Clear and quantitative evidence of the correlation between crack orientation and mechanical properties was found. This suggests that a specimen’s orthogonal crack component should be considered in the evaluation of ASR-induced mechanical degradation.
Concrete structures commonly experience complex restraint conditions, necessitating consideration of crack anisotropy when assessing their remaining capacity. The results from this study suggest that, at the same location within an ASR-deteriorated concrete structure, the estimated remaining capacity could vary depending on the angle between the primary cracks and the loading direction. Neglecting the detrimental effect of cracks orthogonal to the loading direction may lead to overestimation of the structure’s capacity, making the maintenance strategy inappropriate and posing safety risks. Furthermore, the evident negative trend between the mechanical properties and orthogonal crack components indicates that this parameter, as defined in Equation 6, can serve as a reliable index for evaluating the anisotropic mechanical degradation under ASR deterioration in engineering practice. This crack index can be extracted from the crack patterns of drilled core samples. By considering various loading scenarios, this can facilitate a more reliable estimation of deterioration level.
To improve the accuracy of deterioration predictions, numerical models should incorporate the influence of crack orientation. However, existing ASR models (Joo and Takahashi, 2021; Takahashi et al., 2018; Vo et al., 2021) primarily correlate ASR-induced mechanical degradation with cracks parallel to the loading direction, overlooking orthogonal cracking. This omission contradicts the findings of this work. Therefore, the impact of the orthogonal crack component should be further integrated into ASR models for a more accurate assessment.
Future research should thoroughly investigate the mechanisms underlying the negative impact of orthogonal cracks on ASR-induced mechanical degradation under restraint conditions by analysing crack behaviour and areal strain evolution under compression. A clearer understanding of these mechanisms would enhance both structural inspection strategies and the long-term prediction of ASR-induced deterioration in concrete structures.
Impact of crack pattern variability
Beyond the impact of crack orientation, the mechanical properties of specimens under similar restraint and loading conditions can exhibit significant differences, likely owing to crack pattern variability. As shown in Figure 9(a), the three free specimens exhibited distinct compressive behaviours, even though they were all being non-restrained conditions and experienced similar expansion levels. As shown in Figure 18, the cracks on these specimens exhibited varying patterns in terms of crack spacing, dimensions or density. Previous experimental studies on ASR (Gong et al., 2020; Sanchez et al., 2017) also noted inconsistencies in the mechanical properties of ASR-deteriorated specimens. This inconsistency is likely attributable to variability in ASR-induced crack patterns.
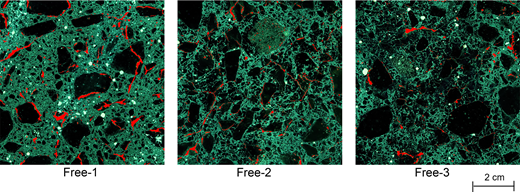
Variation in crack patterns in specimens under similar conditions. A full-colour version of this figure can be found on the ICE Virtual Library (Link to Emerald InsightLink to the website of emerald.)
Variation in crack patterns in specimens under similar conditions. A full-colour version of this figure can be found on the ICE Virtual Library (Link to Emerald InsightLink to the website of emerald.)
Conclusion
A comprehensive experimental study was conducted to reveal the effect of crack orientation on the ASR-induced mechanical degradation of specimens under various restraint conditions. Based on the results, the main findings of this study can be summarised as follows.
Using a newly developed restraint fixture, anisotropic expansion was introduced to specimens after they were subjected to ASR acceleration. Expansion transfer according to the restraint direction was clearly observed.
By cutting the specimens in halves from various directions after ASR acceleration, their anisotropic compressive behaviour was thoroughly investigated and directly correlated with the corresponding crack pattern.
Despite similar volumetric expansions, specimens with higher expansions in the loading direction exhibited lower values of compressive strength and elastic modulus, whereas those with higher expansions perpendicular to the loading direction exhibited higher compressive strength and elastic modulus.
Quantitative crack orientation distributions and their relationships with compressive behaviour were obtained for specimens across various restraint groups. A higher orthogonal crack component proportion relative to the loading direction resulted in a lower compressive strength and elastic modulus. The orthogonal crack component defined in this study was found to be a reliable parameter for assessing anisotropic mechanical degradation under ASR. Extracting this parameter while considering various loading scenarios could enable more reliable estimations of deterioration levels of concrete structures.
Further research is needed to explore the mechanisms underlying the negative impact of orthogonal cracks and integrate them into ASR models for a more precise damage assessment of ASR-deteriorated structures.
