Recommendation systems are a fundamental tool for hotels to adopt a differentiating competitive strategy. The main purpose of this work is to use machine learning techniques to treat imbalanced data sets, not applied until now in the tourism field. These techniques have allowed the authors to analyse the influence of imbalance data on hotel recommendation models and how this phenomenon affects client dissatisfaction.
An opinion survey was conducted among hotel customers of different categories in 120 different countries. A total of 135.102 surveys were collected over eleven quarters. A longitudinal design was conducted during this period. A binary logistic model was applied using the function generalized lineal model (GLM).
Through the analysis of a representative amount of data, the authors empirically demonstrate that the imbalance phenomenon is systematically present in hotel recommendation surveys. In addition, the authors show that the imbalance exists independently of the period in which the survey is done, which means that it is intrinsic to recommendation surveys on this topic. The authors demonstrate the improvement of recommendation systems highlighting the presence of imbalance data and consequences for marketing strategies.
The main contribution of the current work is to apply to the tourism sector the framework for imbalanced data, typically used in the machine learning, improving predictive models.
Introduction
Hotels are experiencing very intense competition due, in part, to the emergence of new business models (peer to peer accommodation) that are being marketed as substitute products and, in part, due to the existence of many hotels with similar characteristics and services (Jasinskas et al., 2016). Similarly, the COVID19 pandemic has led to a change in consumers' perceptions of certain health safety-related attributes (Terzić et al., 2022) that have contributed to an increased competition and a demand for a different offer (Dwivedi et al., 2022). In this context, recommendation systems become fundamental tools for hotels to adopt a differentiating competitive strategy (Chang et al., 2016). In fact, the imbalance phenomenon is related to the lack of accurate data and model results for client dissatisfaction, affecting to the design of future hotel marketing campaigns and trademark reputation development. The importance of client dissatisfaction for hotel recommendation models is a key element in the current work, as there is a relationship between dissatisfaction and loyalty. Griffin (1997) considers the benefits of customer loyalty for a company as an increase in their willingness to try other product lines after the company has improved its position in the market (relative to competitors) and experienced a sales increase.
Within this context, a study covering hotel stays for 120 countries and eleven trimesters was carried out to understand the existence of imbalance data and its effects on recommendation models. The methodology consists of a longitudinal design conducted during eleven trimesters, based on an anonymous questionnaire made available to hotel clients.
We have applied a generalized lineal model (GLM), a well-known binary logistic model widely used in the research context (Pampel, 2000). The main reason for using this technique is, in addition to its proven effectiveness, its high level of explainability. The weights that GLM models assign to each of their variables are easily interpretable as measures of the importance that the model assigns to each of the explanatory variables. In this way, non-experts in this type of techniques have access to an understanding of the model used (Barredo-Arrieta et al., 2020).
The main contribution of the current work is to address in the tourism recommendation task the existence of imbalanced data, remarking the importance of treating the issue. Our study reviews the econometric techniques that can be used to solve these problems and to build accurate models to improve hotel marketing strategies. The hypothesis formulation is derived from the theoretical background and the existing literature, followed by the methodology and the results. The paper concludes with a discussion on the implications of our findings and conclusions.
Theoretical context
Hotels attributes are key to customer positive experience as they directly affect customer satisfaction and consequently influence loyalty (Gallarza et al., 2016; Baniya and Thapa, 2017; Bergel et al., 2019; Kunja et al., 2021; Luong et al., 2020; Nguyen et al., 2022) and future intentions to purchase (Akinci and Aksoy, 2019; Bergel et al., 2019). After the current situation caused by the COVID-19 pandemic, technology innovation is likely to play a key role in the hotel industry recovery, primarily focussing on guest interaction with employee's reduction and enhanced cleaning (Heinonen and Strandvik, 2020; Shin and Kang, 2020).
The relationship between satisfaction and recommendation has been extensively studied in the specialized tourism sector literature (Bowen and Chen, 2001; Kandampully and Suhartanto, 2000; Oh, 1999; Raza et al., 2012; Oklevik et al., 2018; Sukhu et al., 2019; Luong et al., 2020; Serra-Cantallops et al., 2018). Most research focuses on how satisfaction affects recommendation (Serra-Cantallops et al., 2018; Luong et al., 2020; Nguyen et al., 2022) rather than focussing on the importance of imbalanced data assessment in the hotel recommendation models and its impact on the decision-making process.
The existing literature makes use of raw data, without considering the imbalance between the larger number of satisfied customers and the smaller number of unsatisfied customers as a drawback. This imbalance of data has been proven to lead to flaws in the prediction algorithms used in machine learning (Fernández Hilario et al., 2018). Therefore, it is not known how the imbalance data affects the prediction models and this generates inaccuracies in the results in the accommodation field. While it is true that there are some studies that identify the existence of imbalanced data in hotels (Chawla et al., 2002, 2004; Li and Sun, 2012; Fernández-Muñoz et al., 2019) none of them go as far as applying it to predictive models.
Customer satisfaction and recommendation systems in tourism
According to some authors, the satisfaction of tourists is directly related to their attempt to revisit or recommend the establishment (Zeithaml et al., 1996; Yoon and Uysal, 2005; González et al., 2007; Moliner et al., 2015; Luong et al., 2020). It should be borne in mind that a satisfied customer does not have to be loyal and customer loyalty does imply satisfaction (Oliver, 1999; Gallarza et al., 2016; Baniya and Thapa, 2017; Serra-Cantallops et al., 2018). A typical approach to measure satisfaction and loyalty in the industry is the Net Promoter Score (Reichheld, 2003).
Many studies refer to this behaviour of recommending to others as Word Of Mouth (WOM) intention (Dabholkar et al., 1995; Luong et al., 2020) and electronic Word of Mouth (eWOM) recommendation (Ladhari and Michaud, 2015). Marketing studies point to the strength of WOM and eWOM as possessing greater effectiveness than traditional advertising (Cantallops and Salvi, 2014; Kotler et al., 2010). The WOM and eWOM are generated according to the level of satisfaction or quality perceived during the service. Thus, satisfied customers are those who have had a positive experience and want to share it. By contrast, unsatisfied customers are those who have had a bad experience and want to share their discomfort for the service received (Caruana and Schembri, 2016). Customer instability is an aspect that relates to loyalty. When a client has had an unsatisfactory experience, he can respond either by not returning to the establishment, complaining or spreading a negative WOM/eWOM (Aguilar-Rojas et al., 2015).
Customer loyalty has become a very powerful marketing tool for companies (Abdul-Rahman and Kamarulzaman, 2012; Jasinskas et al., 2016; Baniya and Thapa, 2017). Some authors state that, from an economical viewpoint, it is more beneficial to retain existing customers than to attract new ones (Oliver, 1999; Jasinskas et al., 2016). Griffin (1997) sums up the benefits of customer loyalty for a company as follows: sales increase, market positioning improves relative to competitors, marketing costs decrease, customers are less price sensitive and will be more likely to try other product lines.
As far as customer dissatisfaction is concerned, it has been approached from a marketing point of view (Berezina et al., 2016). This perspective points out that while satisfaction relates to positive attitudes towards the brand and the intention to buy back, dissatisfaction relates to negative attitudes (few buyback intentions and negative opinions) (Harrison‐Walker, 2001).
Most of these investigations are based on cases where the relationship between client and service provider is satisfactory (Bozzo, 2008). However, customer dissatisfaction can play an important role as it helps us to identify those areas of the hotel that require future improvement (Berezina et al., 2016). In other words, to ensure customer satisfaction it is essential to identify their dissatisfaction (Gazzola et al., 2019; Dinçer and Alrawadieh, 2017).
In the same line of thought and based on the asymmetric relationships approach, Mittal et al., 2001 stated that the product/service attributes' negative performance may have more influence on satisfaction than a positive performance. To measure the asymmetric impacts of the hotel service dimensions on customer satisfaction Davras and Caber (2019) propose the penalty-reward-contrast analysis method. The results show that the Entertainment Services are the only ones that generate such dissatisfaction if they are missing. Bi et al. (2020) use the same method, but their study is aimed at evaluating the asymmetric effects of attribute performance (AP). The results demonstrate the existence of asymmetry in the customer satisfaction regarding the market segments.
Regarding the relationship of customer dissatisfaction and recommendations, it should be mentioned that most of the research in hotels has been done from a qualitative perspective. Most of the studies focus on conducting content analysis in which the discourse of customers is analysed. Among them, the study by Berezina et al. (2016) analyses and compares the reviews of satisfied and dissatisfied clients through a text-mining approach. The results reveal that satisfied customers tend to cite the most intangible aspects of the service while dissatisfied customers refer to the tangible aspects (attributes). Furthermore, there is an important research work in customer dissatisfaction based on content analysis from TripAdvisor recommendations and other 2.0 platforms. The said work suggests that the existence of asymmetry in hotel Ratings (Fong et al., 2016), in the form of dual-valence reviews (an extreme rating, e.g. “excellent” or “terrible”), may also be associated with reviews featuring both positive and negative comments.
The abovementioned studies (Mittal et al., 2001; Davras and Caber, 2019; Bi et al., 2020) analyse the attribute asymmetry and the results in client satisfaction measurement but they do not consider the existence of imbalance data. They categorize the importance of attributes for customer satisfaction based on how necessary these attributes are for the customer (Mittal et al., 2001). However, the method to differentiate between these attributes or how the reviews are assigned to these attributes (Fong et al., 2016) is purely qualitative.
The imbalance phenomenon in tourism data
Big data allows us to make this distinction without the intervention and interpretation of the researcher (Bagherzadeh et al., 2021; Samara et al., 2020). The existence of imbalance data is related to a quantitative analysis of the sample or data collected, and its treatment or not will produce competitive advantage differences among the companies and their marketing campaigns. Quality hotels studies assume there is an equilibrium between the number of satisfied customers (who would recommend the hotel) and unsatisfied customers (who would not recommend the hotel), but this is usually far from true (Fernández-Muñoz et al., 2019). The existence of imbalanced samples in which the number of satisfied customers is larger than the number of unsatisfied customers directly affects the predictive capacity of the models and has implications for hotel management, development of marketing campaigns, construction of a brand image and the development of competitive advantage. As a result of this we consider Hypothesis 1.
There is an imbalance between the number of satisfied and dissatisfied customers.
Over the years, many authors have analysed the relationship between satisfaction and recommendation. Customer satisfaction has been measured through a number of attributes that have varied in the different models proposed. Beyond these attributes, in this section we analyse the different methodologies that have been applied to measure customer satisfaction and their willingness to recommend. Dörtyol et al. (2014) analysed the most important dimensions when recommending and determining the attributes that most influence hotel recommendation in Turkey. Based on their findings, the attributes are “Hotel employees and problem solving”, “transportation”, “food quality and reliability”, “climate and hygiene” and “level of price”. Using a similar methodology based on regression analysis, Baniya and Thapa (2017) evaluated the relationship between satisfaction, intention to revisit and recommendation for international hotels. They measured customer satisfaction through a series of attributes. On one hand, they evaluated the quality of the service measured through business facility and value; on the other, they evaluated the service offered at Room and Front Desk through Food and Recreation service and Security. Then, they used the same methodology to relate customer satisfaction to loyalty. The results obtained indicated that the tourist satisfaction of the hotels predicts client intention of recommending and loyalty.
Table 1 shows a summary of the most relevant tourism studies on imbalanced data.
Data pre-processing techniques and machine learning models to address the imbalance data in general not only in tourism.
The first general reference on a solution to the imbalance phenomenon is the work by Chawla et al. (2002), where a methodology based on the creation of synthetic samples is used to balance the dataset at hand. Regarding the literature on the treatment of imbalanced data in the tourism sector using machine learning techniques, the review paper by Guerra-Montenegro et al. (2021) shows that, up to that date, only a remarkable paper was found: Li and Sun (2012) focused on firm failure prediction. In such work, nearest neighbour techniques jointly with a Support Vector Machine (SVM) approach are used to generate additional samples of the minority class.
In 2014, Xu et al. (2014), based on the work by Chawla et al. (2002), use a synthetic minority over-sampling technique for the prediction of financial distress of Chinese tourism and hospitality firms. In 2018, Fernández Hilario et al. (2018) performed a study showing that the imbalance in the data from recommendation questionnaires affects the prediction accuracy of the models used, especially the prediction provided by unsatisfied clients, tending to consider them as satisfied customers. In 2022, Ma (2022) used another variation of the Chawla et al. (2002) methodology by pre-processing the minority class using a k-means clustering technique. In this case, the aim was to predict planification strategies within a tourism management system. And finally, in Hoffmann et al. (2022) different machine learning algorithms are compared to measure their accuracy on the prediction of accommodations' sustainability.
Although the previous studies that identify the existence of imbalanced data in the tourism sector, only the work by Fernández-Muñoz et al. (2019) is focused on the prediction of recommendations from quality attributes of the hotels. Therefore, there are strong reasons to consider the validation of Hypothesis 2.
The imbalance between the number of satisfied and dissatisfied customers affects the accuracy of statistical techniques typically used to predict client recommendation preferences.
In summary, the main objective of this paper is to show systematically how the imbalance phenomenon affects to the prediction accuracy of machine learning techniques. The studies listed in Table 1 are focused on techniques and not on data. As a novelty, in this work, we concentrate on the data perspective and the systemic imbalanced structure of data obtained from recommendation questionnaires in the tourism sector.
Methodology
Data collection procedure
The sample collects the opinions of clients on 5 attributes at holiday and urban hotels of different categories in various countries. These opinions have been collected by means of a survey that is different from websites such as Tripadvisor where opinions are collected only from those customers who intend to write a review, prioritizing those who are either very satisfied or very dissatisfied. In this case, a greater diversity of opinions is collected.
The questionnaire is focused basically on recollecting customers' evaluations about their quality perceptions. Five main general aspects of the stay: costumer service (Nunkoo et al., 2019); price (Han and Hyun, 2015); cleanliness (Malik et al., 2020; Nunkoo et al., 2019); facilities; recommendation (Bowen and Chen, 2001; Kandampully and Suhartanto, 2000; Oh, 1999; Raza et al., 2012; Oklevik et al., 2018; Sukhu et al., 2019; Luong et al., 2020; Serra-Cantallops et al., 2018).
The customer's perceptions were recollected together with the following data about the main features of the hotels: stars; typology, urban or vacation; country.
The data provide opinions obtained at hotels from around the world (America, Africa, Asia, Europe and Australia), with a total of 135,102 opinions from customers during eleven consecutive trimesters. In contrast to other research that focuses on a single area of study (González et al., 2007), this article addresses the issue with field work covering 120 countries from all continents. The average number of stays per trimester at 104 hotels is 12,282.
A longitudinal design was conducted during eleven trimesters. The study was based on the answers to an open questionnaire made available to hotel clients, either personally or by e-mail, immediately at the end of their stay. The survey was anonymous and voluntary, with no ethical approvals needed and the participants did not have any reward. Due to the large amount of completed questionnaires, those with missing data were removed. The data was analysed using the statistical software R (R Development Core Team, 2008) and stored and administered by company HOTELS QUALITY (Link to the website). It is also important to remark that more recent data show similar patterns, but due to confidentiality reasons, only the data corresponding to the period 2015–2017 were available. For the same reason, the data have been masked preserving the relevant information to carry out the current analysis.
Tables 2–5 describe the sample from different perspectives. Tables 2 and 3 show the absolute frequency distribution of the hotels involved in this study, whereas Tables 4 and 5 present the absolute frequency distribution of the customers stays. Finally, Table 6 includes the positive and negative proportion of recommendations given by the clients.
A systematic high imbalance of data can be observed in Table 6. In particular, the proportion of positive answers ranges from 0.95 to 0.97 whereas the proportion of negative answers goes from 0.3 to 0.5. Although there are many studies in the literature using predictive methods for recommendation data, none reports this systematic imbalance. Li and Sun (2012) analyse cases in which the data set only reports negative cases in a proportion of 2%. Hirokawa and Hashimoto (2018) consider a prediction model with very bad results because they have only 10% of negative cases.
In this regard, some previous studies present isolated solutions to solve this, but it is not assumed as an endemic situation within data coming from recommendation surveys (Fernández-Muñoz et al., 2019; Li and Sun, 2012).
Instrument and measurement
The questionnaire is organized in two sections. Firstly, descriptive statistics such as the typology (urban or vacational) and the number of hotels stars (from two to five) were collected. Secondly, the clients answer to questions about four general attributes related to their stay, namely: customer services, general cleanliness, facilities and quality–price ratio. Likert's scale was used to measure the clients' attributes perception ranging from 1 to 6 (1 = very poor, 2 = poor, 3 = fair, 4 = good, 5 = very good and 6 = excellent).
The election of attributes is based on the consumer decision-making process (CDP) model stated that customers get influenced by some special elements in products and thus end up purchasing in corresponding to their needs and preferences.
Chang and Wong (2005) stated that hotel attributes can be either intangible or tangible characteristics or physical attributes (elements that can be seen) such as price, facilities, location, the existence of choices, WOM, advertising, a familiar name and past experience, etc. Intangible elements for a hotel can be characteristics such as security, dependability, service quality, reputation and staff behaviour. This inherent feature of the service makes customer recommendations a very important tool when deciding to buy a product (Gellerstedt and Arvemo, 2019). In this sense Kim et al. (2019), in their study about hotel industry in Korea, revealed in the luxury and upscale hotels a significant gap between the importance of the attributes and their satisfaction. This gap is even larger when confronting intangible attributes against tangible attributes, generating differences in the positive WOM and revisit intention. Bodet et al. (2017) highlight the importance of cleanliness and facilities as basic attributes in their cross-country and cross-hotel study for a Tetraclasse model.
All the studies based on hotel attributes show that customers prefer various attributes (instead of a single one) and similar features of accommodation facility.
Baniya and Thapa (2017) highlight the importance of service quality, room and front desk as the most important hotel attributes that lead to international tourist satisfaction in Nepal. They stated the relationship between satisfaction and loyalty and the fact that with superior performance of the two attributes the tourists are likely to revisit the Nepal (Pokhara) hotels and generate positive WOM.
In order to analyse customer recommendation, a dichotomous recommendation variable was included in this second part of the questionnaire (0 = no recommendation, 1 = recommendation). In our analysis, the previous four general attributes constitute the independent variables while the dichotomous one constitutes the dependent variable.
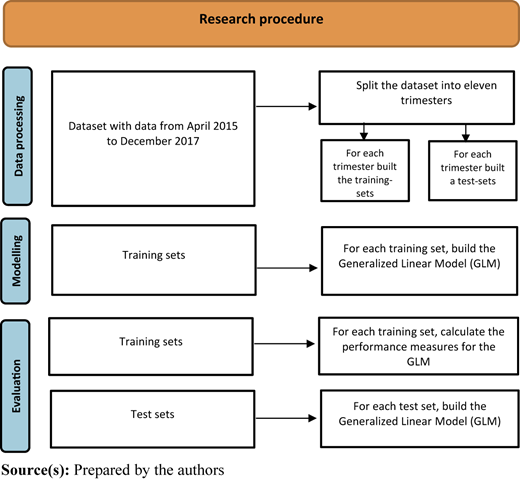
The data have been divided divide into a training and testing dataset: 70% of the data were used to train the model and 30% of the data to test the model, obtaining similar results for both cases. For the sake of space, we only show the results for the training data set. Figure 1 shows the flowchart describing the investigation procedure.
Analysis
For each of the eleven trimesters a binary logistic model (Hosmer and Lemeshow, 2000; Kleinbaum and Kleim, 2002; Long, 1997; Pampel, 2000) has been executed using the “GLM” function included in the R software, which has been parametrized to reflect the dichotomous characteristic of the dependent variable. Given that this work is focused on the systemic structure of data, we choose the GLM model due to its well-known simplicity and effectiveness and no pre-processing data techniques are used. We use this model to determine whether the recommendation variable can be explained in terms of the set of independent attributes. In such model, the probability of recommendation is given by P(Y = 1), whereas the non-recommendation probability P(Y = 0) equals 1-P(Y = 1). In the case at hand, the hypothesis is that X1, X2, X3 and X4 (respectively, customer services, general cleanliness, facilities and quality–price ratio) are four influential factors on response attribute Y (the recommendation variable). The logistic regression model represents the ratio of recommendation and non-recommendation probabilities through its natural logarithm:
Results
In this section, we analyse the performance of the predictive method using a battery of well-known measures. A detail analysis and description of such measures can be consulted in De Diego et al. (2022). Next, we describe such measures. For the sake of simplicity, we consider a binary classification problem with positive (+1) and negative (−1) labels:
True Positive (TP): a true positive takes place when a datum is correctly classified into class +1 while belonging to class +1.
True Negative (TN): a true negative takes place when a datum is correctly classified into class −1 while belonging to class −1.
False Positive (FP): a false positive takes place when a datum is wrongly classified into class +1 while belonging to class −1.
False Negative (FN): a false negative takes place when a datum is wrongly classified into class −1 while belonging to class +1.
Accuracy (ACC): proportion of correctly classified data, that is, .
Positive Predictive Value (PPV): also known as precision, proportion of true positives out of all data predicted as positive, that is, .
True Positive Rate (TPR): also called sensitivity or recall, proportion of true positives out of all positive data, that is, .
Negative Predictive Value (NPV): proportion of true negatives out of all data predicted as negative, that is, .
True Negative Rate (TNR): also known as specificity, proportion of true negatives out of all negative data, that is, .
Positive F1 score (): joint measure of positive accuracy defined as the harmonic mean of PPV and TPR, that is, .
Negative F1 score (): joint measure of negative accuracy defined as harmonic mean of NPV and TNR, that is, .
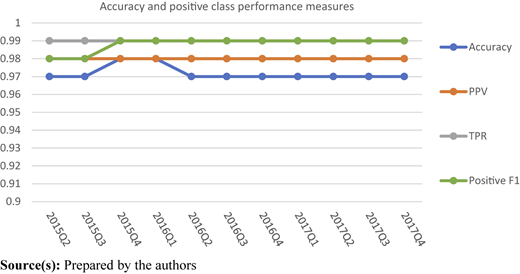
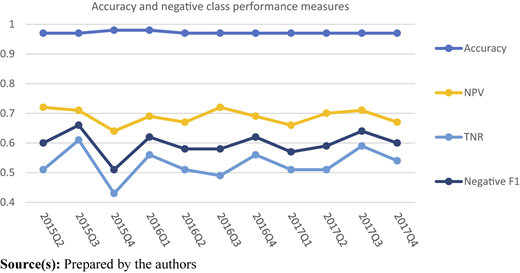
Table 7 shows the evaluation measures for each trimester since April 2015 to December 2017. It can be observed that systematically every trimester the Positive Predictive Value and True Positive Rate measures take very high values close to 1, whereas the Negative Predictive Value and True Negative Rate clearly reach lower values (ranging TPR from 0.64 to 0.72 and TNR from 0.49 to 0.61). This performance is also reflected in the Positive F1 score (a summary of PPV and TPR) and Negative F1 score (a summary of NPV and TNR). Therefore, and describe the performance of the predictive method for each class separately.
Nevertheless, the measurement of Accuracy is clearly affected by the imbalance of the data. The fact that the number of positive instances is much larger than the number of negative samples implies that the weight of the True Positive instances masks the bad performance of the predictive method for the negative class in the Accuracy measure. These results are coherent with the descriptive statistics in Table 6, where systematic high imbalance of data was reported.
Figures 2 and 3 summarize these findings. In Figure 2, it is apparent that the systematic performance measures related to the positive class, that is, PPV, TPR and , tend to reach values close to one, whereas in Figure 3 it can be observed that the performance measures related to the negative class, that is, NPV, TNR and , tend to reach lower values. However, the overall summary measure, Accuracy (shown in both figures), is clearly aligned with performance measures related to positive class, losing its a priori overall descriptive capacity.
Finally, although not included for the sake of space, it is important to remark that an analysis of the data categorize either by countries or by continent provides similar results.
Discussion and conclusions
The results show the importance of applying an unbalanced data approach when assessing the perceptions of dissatisfied customers and defining differentiating strategies in hotels (Griffin, 1997; Chang et al., 2016) in a context of an increasingly demanding consumer (Dwivedi et al., 2022).
In this regard, the study has checked two main hypotheses regarding the importance of data collection from recommendation surveys in the hotel sector. Both faced current most important challenges to understand the tourism market that affect significantly to the decision-making process such as marketing and promotion strategies. In this vein, Li et al. (2010) highlight the importance to incorporate negative association rules in marketing and they provide a novel mining approach to estimate the confidence of targeted association rules (positive and negative) in their analysis of Outbound Tourism in Hong Kong.
Many authors who have analysed attribute asymmetry (Mittal et al., 2001; Davras and Caber, 2019; Bi et al., 2020 and Fong et al., 2016; Kim et al., 2019) have revealed a significant gap between the importance of the attributes and their satisfaction, most important in the intangible attributes against tangible attributes. however, there are hardly any studies of customer satisfaction that take into account the imbalance data in their studies (Fernández-Muñoz et al., 2019; Li and Sun, 2012). Therefore, the importance of the hypotheses we propose.
Concerning to hypothesis 1, which refers to the existence of unbalanced data between satisfied and dissatisfied customers, we have shown that there is a generalized imbalance in the data collected from the opinions of hotel clients. This imbalance is shown to be inherent in the data collection process and therefore seldom addressed in the academic literature. Li and Sun (2012) and Hirokawa and Hashimoto (2018) are good examples of this.
Through the analysis of a representative amount of data, we empirically demonstrate that the imbalance phenomenon is systematically present in hotel services recommendation surveys. In addition, we show that such imbalance exists independently of the period in which the survey is done, which means that it is intrinsic to recommendation surveys on this topic.
Similarly, there are many studies that analyse the relationship between customer satisfaction and recommendation (Bowen and Chen, 2001; Kandampully and Suhartanto, 2000; Oh, 1999; Raza et al., 2012; Oklevik et al., 2018; Sukhu et al., 2019; Luong et al., 2020; Serra-Cantallops et al., 2018) none of them consider the imbalance of the data in the predictive model.
With regards to hypothesis 2, we have shown that imbalance in the dataset clearly affects the predictability that results from construction of models with such data. An inadequately constructed model undoubtedly produces inadequate results for decision making. In this sense, we empirically demonstrate that the quality of the results obtained using statistical prediction procedures is markedly affected by such a phenomenon.
We identify that the most affected prediction results are those related to unsatisfied customers that provide negative recommendations. It is observed that systematically, throughout all trimesters, the overall accuracy and measures associated to data related to satisfied customers providing positive recommendation (PPV, TPR and ) are very high (close to 1). However, measures associated to data related to unsatisfied customers providing negative recommendations (NPV, TNR and ) are clearly lower.
In fact, TNR takes systematically values ranging from 0.5 to 0.6. This means that the model considers at least 40% of dissatisfied customers as satisfied customers, not taking into account the overall accuracy measure. In a well-posed model, the , and accuracy measures are expected to reach similar values. Since and describe the performance of the predictive method for each class separately (but accurately), our recommendation is to use both measures jointly to correctly describe the overall performance of predictive methods built from imbalanced samples.
As a consequence of the above, if there is imbalance in the data obtained from recommendations, and this mainly affects negative recommendations, we do not have certainty about the adequacy of the attributes in the definition for those who make negative recommendations (Bi et al., 2020; Davras and Caber, 2019). Moreover, the probability that some of the attributes are not critical (or the most important) for those who make negative recommendations is very high.
Once the imbalance problem has been detected, corrective actions should be carried out. In the tourism environment, a reduced literature is available, usually focused on a particular instance of problem. A recent approach is presented in Fernández-Muñoz et al. (2019), where a balanced sample is built by means of a subsample procedure on the majority group, that is, the set of customers providing a positive recommendation. With this technique, the overall error and the particular error for each class become similar. However, the approach is not systematically applied to a long period of trimesters and should therefore be considered a cross sectional design with non-concluding results.
There are more sophisticated strategies such as synthetic minority over-sampling technique (SMOTE) developed by Chawla et al. (2002). In this case, the strategy followed by the authors is to build synthetic samples of the minority groups, that is, the set of customers providing a negative recommendation in order to obtain a balanced dataset. As far as we know, this approach has not been applied to data coming from recommendation surveys within the tourism sector and therefore constitutes a promising research line.
Implications
We have shown the importance and the implications of imbalanced data for hotel prediction models and the influence it may have on the decision-making process for hotels.
The analysed data shows that there is a systematic imbalance in all semesters. This imbalance leads to an error in the prediction of dissatisfied customers. That is, if we base the prediction on imbalanced data, we drag that error into the prediction. As it has been proven in studies that analyse customer satisfaction and their intention to recommend, the imbalance data consideration is not usually applied. It would therefore be convenient to do so in order to make predictions that are more adjusted to the reality of the sample.
The hotel prediction models require an accurate design of the attributes to correctly reflect the most important characteristics of their products and services to capture client's attention. Otherwise, if dissatisfied client perception is not well defined (because the imbalance data does not allow to correctly measure that perception), it is possible that hotels will end up developing ineffective campaigns that will not capture client's attention. Thus, clients will remain dissatisfied (or even become more dissatisfied) as there are doubts about the products and services they view negatively and on which they base their negative recommendation.
This situation, which directly affects the predictive capacity of the model, has other implications clearly related to hotel management, development of competitive offers, construction of brand image and development of competitive advantage. The definition of competitive offers based on attributes that affect negative recommendations may be one of the implications. A poor definition of the characteristics of a dissatisfied client would become a pervasive problem.
The application of an imbalanced data approach improves the detection of dissatisfied customers and as expressed in the literature, this can help to detect the main deficiencies in the service and improve customer perception of quality. It can also help to detect those attributes that most influence the customer recommendation in a more precise way, being very useful for the design of customer loyalty campaigns and the design of relationship marketing strategies. These findings could, for instance, be applied to marketing campaigns focused on hotel image improvement among dissatisfied customers.
Regarding further research a similar analysis should be done comparing the results with other machine learning models, and then, select the most accurate one for imbalanced data. Also, the analysis could be extended introducing resampling or pre-processing techniques to handle the imbalance problem.
Limitations
The sample is composed of four attributes, but the model can, however, be enriched with more attributes, as other authors do. In order to reach a larger sample of hotels, the model was reduced to 4 attributes in order to assess customer satisfaction. However, in future developments, it would be convenient to introduce attributes that are already present in other studies, such as the attitude of the hotel staff, to complement the model.
The results of this work present some threats to validity that should be mentioned: First, data were collected from a non-probabilistic sampling conditioned to commercial agreements between hotels and the polling contractor. Second, in the survey, the questionnaire was self-administered, and, therefore, only the opinion of volunteers is taken into account. This fact could partly explain the imbalance in the dataset, as satisfied customers tend to participate more responsively in this type of questionnaires, third, the weight of four and five start hotels was significantly higher than the weight of hotels with three stars or less; and finally, after the COVID-19 pandemic, it would be advisable to replicate the analysis in order to check the validity of the findings.