Skip to article sections
Purpose

This study challenges the homogeneous treatment of banks in prior literature by investigating how the determinants of profitability vary across different groups of 70 Indian scheduled commercial banks (SCBs) from 2017–18 to 2022–23, aiming to uncover heterogeneous profitability dynamics.

Design/methodology/approach

Using a classification-based heterogeneity approach, SCBs are categorised into groups on the off-balance sheet exposure to total liabilities ratio (OBS), net profit to total assets ratio, net NPA to net advances ratio, lending to sensitive sectors as a percentage of total advances, and business per employee and profit per employee. Profitability (ROA, ROE) is then analysed using panel regressions selected through diagnostic, with robustness confirmed by dynamic system GMM estimations.

Findings

The drivers of profitability vary significantly across bank profiles. Capital adequacy is a critical positive driver for banks with high NPAs but is not statistically significant for stronger banks. On the other hand, poorer asset quality (higher NPAs) is associated with higher ROE, suggesting a short-term risk-return trade-off specific to the Indian market. Bank size exhibits economies of scale for ROA but diseconomies for ROE. Operational efficiency is a consistently significant determinant across most groups.

Research limitations/implications

Future research should extend this classification framework to analyse specific regulatory shifts (the Basel III transition) and incorporate non-banking financial companies to provide a broader systemic perspective.

Practical implications

The findings demonstrate that a uniform approach to bank management and regulation is inadequate. We provide empirical insights for tailoring strategies to specific bank profiles, such as weaker banks prioritising capital augmentation, to enhance performance and support systemic financial stability.

Originality/value

This study contributes to the literature by applying a classification-based heterogeneity framework to Indian SCBs, addressing a key limitation of prior studies that treat banks homogeneously.

The Indian banking sector (IBS) is firmly tied to the country's economic design. Over the past few decades, this sector has been operative in a volatile and uncertain environment, such as nationalisation, deregulation, consolidation, structural change, and digitalisation (Ghosh, 2016), justifying the need to explore the potential determinants of the IBS profitability as an essential aspect of banks' performance. Forcing a more comprehensive study on banks' social responsibilities, there is still a need to study how they remain profitable in the long run and efficient resource utilisation while maintaining financial structures' stability (Barua, Roy, & Raychaudhuri, 2016; Bodla & Verma, 2011). Scheduled Commercial Banks (SCBs) formed the foundation of the IBS in India, and therefore, the study of their performance is highly determinative of the country's well-being.

A vast literature is available identifying the drivers of bank profitability, including bank-specific and macroeconomic factors (Dietrich & Wanzenried, 2011; Naceur & Omran, 2011) across groups globally and Indian banks (Al-Homaidi, Tabash, Farhan, Almaqtari, & McMillan, 2018; Almaqtari, Al-Homaidi, Tabash, & Farhan, 2019; Arumugam & Jothikumar, 2017; Desai, 2021), in particular, there still exists a critical gap in analysing the complex relationship of these factors and the variations in impact across various groups specific to the Indian context. A vast majority of the prior studies, researched on bank homogeneously, thus failing to take into consideration the heterogeneity in the banking system. This homogenisation risks overlooking the specific factors that drive profitability for different types of banks, based on their size, business model, risk profile, and other characteristics. Thus, conducting this study becomes important because of specific issues in the IBS, considering the sample period of our study, such as rising NPAs and increasing competition resulting from technology adoption (Sengupta & Vardhan, 2017).

Despite the numerous studies investigating bank profitability, including cross-country comparisons involving emerging markets (Ozili, 2021), an area lacking the interaction of bank-specific and macroeconomic factors shapes performance across bank groups in the peculiarity of the IBS. Classification of Indian SCBs is done based on parameters with financial and operational significance such as off-balance sheet exposure to total liabilities ratio (OBS), net profit to total assets ratio, net NPA to net advances ratio, lending to sensitive sectors as percent of total advances, business per employee (BPE), and profit per employee (PPE), as they study factors like Return on Assets (ROA) and Return on Equity (ROE) and how such mechanisms vary among these distinct groups. This analysis is important for understanding the concept of heterogeneous profitability dynamics, as different bank groups may achieve profitability through different avenues, given their distinct characteristics and operating environments, thereby recognising heterogeneity within the banking system.

Bank profitability is analysed using a variety of underlying theories that provide alternative insights into the key determinants of firm performance. This paper integrates these schools of thought to develop hypotheses about the determinants of profitability in the heterogeneous Indian banking industry. This research is guided by theoretical paradigms, such as the Structure-Conduct-Performance (SCP) paradigm, which posits that a firm's performance is influenced by the industry's external structure, including market concentration and the microeconomic environment (Bain, 1951). This school of thought supports the incorporation of macroeconomic variables. By contrast, the Efficient Structure Hypothesis (ESH) claims that performance is caused by firm-specific efficiencies (Berger, 1995; Demsetz, 1973). The ESH suggests that banks with better management, lower costs, and stronger capital bases will be more profitable, irrespective of the market structure. Then, Agency Theory (Jensen & Meckling, 1976) addresses the intrapersonal conflict of interest between managers and shareholders that may manifest as operational inefficiency or suboptimal risk-taking, both of which are considered detrimental to profitability. This paper combines these perspectives by considering both bank-specific and macroeconomic factors. Furthermore, to contextualise the divergent impacts of macroeconomic shocks and credit risk on shareholder returns, this study also draws upon the Fisher effect (Fisher, 1930) and the fundamental Risk-Return Trade-off. The Fisher effect provides a theoretical basis for understanding how highly leveraged institutions, such as banks, might pass inflationary pressures on to borrowers, potentially insulating nominal equity returns in the short term. Concurrently, the risk-return trade-off framework is essential for examining whether banks engaging in higher-risk lending, often manifested in higher non-performing assets, extract a short-term nominal premium. Integrating these mechanisms allows for a much more nuanced, multidimensional interpretation of profitability dynamics.

2.2.1 Bank-specific variables

A major relationship between capital adequacy, bank size, risk, and profitability has been identified. Capital adequacy using the capital-to-risk-weighted assets (CRAR) has a role in absorbing losses and conveying information that reduces the funding cost (Alshebmi, Adam, Mustafa, Thomran, & Fathelbab, 2020; Al-Homaidi et al., 2018) propose, high levels of capital offer a competitive edge to make loans, investments and low capitalisation raises the probability of firms' failure and financial instability. Trade-off theory (Kraus & Litzenberger, 1973) posits that banks' balance the tax advantages of debt with the cost of financial failure. Existing empirical literature on the CRAR – Profitability nexus is inconclusive (Gupta & Mahakud, 2020; Salike & Ao, 2018; Song, Cheng, & Wu, 2019), with studies in Indonesia have similar observations (Haron, Nomran, Abdullah Othman, Md Husin, & Sharofiddin, 2021). These differences are attributed to variations in regulatory regimes, bank ownership, and bank sizes across the papers, hence the need for future research to examine these factors.

Literature review observes positive size-profitability relationships (Neves, Proença, & Dias, 2020), while others observe negative or insignificant (Shehzad, de Haan, & Scholtens, 2013). Some empirical research on Indian banks has also produced inconclusive findings (Al-Harbi, 2019; Gazi, Nahiduzzaman, Harymawan, Al Masud, & Dhar, 2022), giving importance to the bank-specific and macroeconomic environment, whereas (Tecles & Tabak, 2010) found that large banks were most efficient in Brazil. Ambiguity is not limited to India; similar debates with mergers and acquisitions, career opportunities are supposed to emerge, as well as cost-investment economies, diversification of funding resources, and enhancing the profitability of hierarchy-related tactical plans (Al-Homaidi et al., 2018; Balani, 2019). But over-scaled, large, complicated structures result in diseconomies of scale (Stančić, Čupić, & Obradović, 2014).

The strong credit risk assessment, diversification, and effective management of Non-performing Loans (NPLs) are elements of effective asset management that enhance the understanding of risk-return trade-offs (Al-Homaidi et al., 2018). High NPL ratios affect earnings and assets, leading to lower profitability (Abdelmoneim & Yasser, 2023), a finding similarly supported by studies from South Africa (Razermera, Brijlal, & Jwara, 2024) and Brazil (Takahashi & Vasconcelos, 2024). But the similar studies on Indonesian state-owned banks exhibit a significant negative relationship between NPLs and profitability (Priharta & Gani, 2025). Nonetheless, the aggressive pursuit of short-term returns in the asset portfolio increases risk-taking, which threatens the long-term accumulation of these assets and profits (Trang, Duong, & Binh, 2024). A review of the literature provides empirical evidence generally supporting the notion (Al-sadi, 2022; Kosumi & Zharku, 2024), highlighting a significant relationship between asset management ratios and bank profits. However, understanding the effectiveness of employing particular Asset Management (AM) practices by SCB groups, depending on Net Performing Assets (NPA) ratios and lending to sensitive sectors, remains a research question.

Agency theory (Jensen & Meckling, 1976) suggests potential conflicts of interest between management and shareholders, which impact efficiency. Although a lower expense-income ratio is viewed by most as having a positive effect on profitability, it is not same for the different groups of banks (Rawlin, Ramachandran, & Dev, 2023; Salami, Tanrivermiş, Sarea, & Tanrivermis, 2023), an erosion of asset quality indicates more non-performing loans thereby resulting in more provisions for loans losses and less interest income. Several researchers have highlighted the need to efficiently control credit risk (Al-Homaidi et al., 2018; Apau & Sibindi, 2023; Barakat et al., 2024; Pham, Hoang, & Pham, 2022; Brogi & Langone, 2015) analysed the effect of bank capital and asset quality on profitability and established a significant relationship between them. Another stream focuses on changes in the legal framework on asset characteristics and, accordingly, the profitability of banks (Assous, 2022; Belkhir, Grira, Hassan, & Soumaré, 2019; Duong & Dang, 2023). Common sources of funds, such as deposits, provide stability but also hinder high-return activities (Berger & Bouwman, 2009). Conversely, they increase liquidity and operational efficiency, thereby increasing profits (Dietrich & Wanzenried, 2011). On the merit of the “too big to fail” and moral hazard consideration, this means that government encouraging banks to engage in excessive risk-taking behaviours (Lesche, 2021). This is particularly crucial in the Indian context, where there is a restricted openness model of institutional share, which has a stressed concentration on deposit mobilisation (Zopounidis & Kosmidou, 2008). Current studies reveal that the relationship between deposit and profitability is conditioned by the level of bank characteristics and macroeconomic environment (Al-Homaidi, Almaqtari, Yahya, & Khaled, 2020; Chang & Talley, 2016). Conceptually, Off-Balance Sheet Exposure (OBSE) activities are involved in generating income, increasing fee-based income, optimising resources, and even improving profitability (Saif-Alyousfi, 2022). However, their complexity and inherent risks offset these gains (Nguyen, Parsons, & Argyle, 2021). Studies on BRICS economies concluded that the decision to undertake activities is influenced by ownership and governance structures (Bagh, Hunjra, Guo, & Bouri, 2025). The heterogeneity of banking models is also evident in Indonesia, where (Fajriana, Roni, Syamni, Taniro, & Saputra, 2021) found that determinants of profitability for foreign banks differ significantly from domestic banks. The branch network scale is driven by trade-offs of factors such as revenue growth and cost containment (Liang, Ching, & Chan, 2013) Nevertheless, new forms of financial services delivery, such as digital banking and Internet and mobile banking services, question the traditional value of branch offices (Di Febo & Angelini, 2022; Kowalewski, 2023). Transaction cost economics has significant potential as a conceptual tool for evaluating the effectiveness of various banking channels. Higher levels of digitalisation improved financial performance and bank valuations in the Indonesian banking sector (Avianto, Siregar, Ratnawati, & Siregar, 2024). Therefore, there needs to be an optimal mix of physical and digital channels.

H1.

Bank-specific factors significantly influence bank profitability.

2.2.2 Macroeconomic variables

Macroeconomic factors exert considerable influence on bank profitability. GDP expansion, associated with higher credit usage rates, works for profitability (Borio & Lowe, 2002). This is in accord with the Keynesian theory (Keynes, 1937) of aggregate demand, pointing out that overall demand in the economy is positively related to the demand for credit. However, this relationship not always hold linear but it has been proven that this relationship exists. It emphasises the significance of appropriate credit risk management during economic growth and closely corresponds to the Austrian business cycle theory (Von Mises, 1953), which asserts that economies are unsustainable.

According to traditional theory, the scenario shows a direct relationship between interest rates and bank profitability, as higher interest rates imply higher interest income. But the relationship is not always direct. Higher interest rates also reduce loan demand and increase the cost of funds, thereby eroding the benefits of Net Interest Margins (NIMs) (Borio, Gambacorta, & Hofmann, 2017). Also, the nature of the relationship between short- and long-term interest rates has a profound impact on the profitability of banking institutions. Inflation (INF) has a complex and potentially divergent relationship with bank profitability, depending on the metric used (ROA vs ROE). Historically, moderate inflation was thought to entice economic activity and nominal profits (Flannery, 1981). However, while inflation increases operational costs and can degrade overall asset efficiency (ROA), its impact on shareholder returns (ROE) may be positive, specifically due to the Fisher effect (Fisher, 1930) and the highly leveraged nature of banks. Banks may pass inflationary pressures to borrowers via higher nominal interest rates while simultaneously benefiting from the diminished real value of their liabilities (deposits), creating a temporary, nominal boost to equity returns. Exchange rate fluctuations have widespread effects on the net interest margin, trading income, and foreign-currency balance-sheet assets and liabilities (Bouhider, 2021; Kolcunova & Havranek, 2018). Covered and uncovered interest rate parity are important theories explaining exchange rate fluctuations and their relation to interest rates. This paper also discusses how the macroeconomic factors influence varied groups of SCBs in India.

H2.

Macroeconomic factors significantly influence bank profitability.

2.2.3 Heterogeneous effects and bank classifications

We hypothesise that the relationships established in H1 and H2 do not exist uniformly across the diverse Indian Banking Sector (IBS). Rather, the strength and direction of these profitability drivers will be significantly influenced by a bank's specific operational and risk profile (e.g. its NPA ratio, OBS exposure, and employee productivity). By segmenting the sector, this investigation aims to provide empirical evidence of heterogeneous profitability dynamics, demonstrating that banks with different profiles must follow distinct paths to achieve profitability.

H3.

The impact of bank-specific and macroeconomic determinants on profitability is heterogeneous, varying significantly across a bank's specific classification profile.

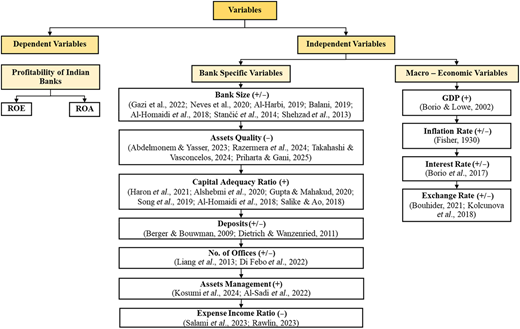
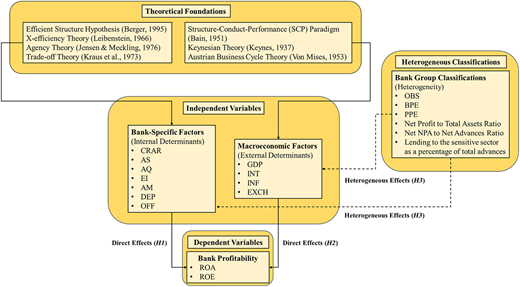
The theoretical arguments and the hypotheses developed are summarised in the conceptual framework presented in Figure 1. This framework provides a visual representation of our research model.

The study analyses balanced panel data of 70 SCBs (12 public sector banks, 21 private sector banks, and 37 foreign banks) (Annexure Table 1) for the study period from 2017–18 to 2022–23. This study period is highly relevant to the Indian banking landscape due to the implementation of the Insolvency and Bankruptcy Code and the adoption of digital banking post-demonetisation.

The primary source of bank-specific variables (Figure 2) related to financial data is the Reserve Bank of India's (RBI) “Statistical Tables relating to Banks in India”. Macroeconomic variables data (Figure 2), including the annual average Consumer Price Index (CPI) and the exchange rates of the Indian Rupee against other major currencies (SDR, USD, GBP, EUR, and JPY), were collected from the RBI's “Handbook of Statistics on Indian Economy”. The annual estimates of India's Gross Domestic Product (GDP) at constant prices (2010–12 series) were obtained from the Ministry of Statistics and Programme Implementation (MOSPI). Bank group-wise Weighted Average Lending Rates (WALR) on outstanding rupee loans were also obtained from the RBI.

For the study period, a consolidated approach has been adopted due to bank mergers. Vijaya Bank and Dena Bank are considered as one Bank of Baroda from all years of analysis, as these two banks were merged with Bank of Baroda on April 1, 2019. Any other mergers during this period were handled similarly, using consolidated figures to ensure data consistency.

3.2.1 Dependent variables:

The profitability of SCBs in India is measured by two proxies, ROA measures a bank's measures a bank's profitability of its total assets. Whereas ROE measures a bank's profitability from the perspective of its shareholders.

3.2.2 Explanatory variables

3.2.2.1 Bank-specific variables

Capital Adequacy Ratio (CRAR): This study investigates the CRAR-profitability relationship for Indian SCBs, considering variations across different bank groups.

Bank Size (AS): AS aims to explore the relationship between bank size and the profitability of different SCB groups and scale advantages for groups of banks classified, and regulatory pressures between different bank groups are crucial for formulating appropriate policy recommendations. This is the proxy variable for the bank's operations.

Asset Quality (AQ): This is an indicator for a bank's credit risk, measured by the Gross Non-Performing Assets (GNPA) ratio. Therefore, a higher AQ value indicates a higher proportion of non-performing assets, signifying poorer asset quality. The findings will provide insights into Indian banks' asset quality and strategies to improve profitability and financial stability.

Asset Management (AM): A higher asset management ratio typically indicates greater profitability. A key area for investigation is the exploration of asset management practices on the overall financial performance of Indian SCBs.

Deposit Ratio (DEP): This study examines the effects of the deposit ratio on the profitability of different SCB groups, considering the degree of OBS exposure and other relevant factors.

Expense-Income Ratio (EI): A study of the factors affecting expense-income ratios within various SCB groups to throw light on the optimisation of operating costs and income generation in the Indian scenario.

Number of Offices (OFF): Investigating the interplay between branch networks, digital banking adoption, and profitability to study, larger branch networks translate to higher profitability for Indian SCBs, and does the growing use of digital channels diminish the importance of physical presence.

3.2.2.2 Macroeconomic variables

Economic Activity (GDP): This study examines the loan portfolio of a bank's diagnostic to its capacity to react to fluctuations in Gross Domestic Product growth. Such aspects are significant for making correct decisions on the future development and the management of potential risks. It is measured as the annual percentage growth rate of India's real GDP at constant prices.

Inflation Rate (INF): This study examines the volatility of the profitability of banks that are exposed to inflation-sensitive products during inflationary periods. It is measured as the annual percentage change in the Consumer Price Index (CPI) for India.

Interest Rate (INT): In this study, the degree of sensitivity to changes in interest rates across different bank groups is examined, which are defined by their size, the maturity of the assets and liabilities, and the business models they employ. It is proxied by the WALR on outstanding rupee loans for SCBs, as published by the RBI.

Exchange Rate (EXCH): A study of levels of profitability volatility in banks that have international operations because of exchange rate volatility. The extent to which various hedging techniques prevent the effects of exchange rate risk, and the implications of these techniques on profitability. It is measured as the annual average exchange rate of the Indian Rupee (INR) against the US Dollar (USD).

3.2.3 Classification of SCBs into different groups

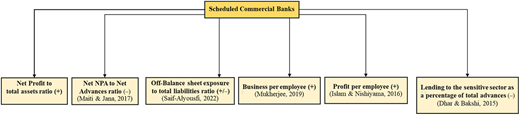
To conduct the subgroup heterogeneity analysis, the SCBs were systematically classified into two equal-sized groups (“High” and “Low”) for each of the six selected financial and operational indicators (Figure 3). The classification threshold was the overall sample median for each variable. Specifically, a binary rule was applied, if a bank's value for a given indicator exceeded the sample median, it was assigned to the “High” subgroup; if the value was below or equal to the median, it was assigned to the “Low” subgroup. Separate panel regressions were then run for each subgroup. The median was deliberately selected as the classification threshold because it ensures statistically balanced sub-samples and is highly robust to distortions from extreme outliers (Hair, Black, & Babin, 2010), thereby guaranteeing reliable and transparent comparative analysis across the distinct bank profiles. The six classification criteria applied using this median-split methodology are as follows:

Off-Balance Sheet Exposure to total liabilities ratio (OBS): Banks are categorised into “High OBS” (ratios above the sample median) and “Low OBS” (ratios below the sample median). Using the median ensures equal group sizes, enabling a robust direct comparison of profitability drivers across banks with varying off-balance-sheet exposures.

Net Profit to Total Assets Ratio: As this ratio is calculated in net profit accrued per total assets, it is a relative measure of profitability. Generally, a bank is in proportion to its asset size. On this basis, banks are classified as “High Net Profit” and “Low Net Profit.” It allows for comparing profitability determinants in more versus less profitable banks in terms of return on assets.

Net NPA to Net Advances Ratio: The net non-performing asset (NPA) ratio, which divides net NPAs by total advances (loans), a low ratio is considered healthy as it means a lower credit risk in loans (Maiti, Kumar Jana, & Kumar Jana, 2017). According to NPA performance based on net NPA ratios, “Strong” for low NPA banks and “Weak” for high NPA banks. Such classification allows the study to know whether the profitability determinants differ significantly for banks concerning asset quality.

Business per Employee (BPE): BPE = Total Business/Number of employees. Total Business includes deposits and advances. BPE gives a clear picture of operational efficiency and also shows how much productivity is obtained for each employee (Mukherjee, 2019). High BPE and Low BPE, this classification makes it possible to use employee productivity to compare the profile of profitability drivers in high and low-employee productivity banks.

Profit per Employee (PPE): High PPE and Low PPE by using the median value of PPE for the entire sample period classified helps to examine the correlation of human capital efficiency (Islam & Nishiyama, 2016) with the profitability of different bank groups.

Lending to Sensitive Sector as Percentage of Total Advances: Banks with Sensitive Sector Exposure greater than the median percentage for the entire sample period are labelled as “High Sensitive Sector Exposure”, while those with Sensitive Sector Exposure below the median are labelled as “Low Sensitive Sector Exposure”. Classifying banks based on this exposure is crucial, as heightened lending to sensitive, high-risk sectors has been strongly associated with increased non-performing assets and altered risk-return profiles among Indian banks (Dhar & Bakshi, 2015).

To study the determinants of SCB profitability in India, two panel regression models are constructed. The selection of determinants is grounded in a theoretical framework and empirical evidence found during the literature review. The models hypothesised that the profitability of banks is dependent on bank-specific variables and macroeconomic variables as follows:

(1)
(2)

where i refers to an individual bank, t refers to the year, β′s and γ′s are the coefficients of determinant variables, µi refers to the unobserved bank-specific effect, and ε is the error term. All other variables are as defined in the variable definitions and measurements section 3.2.

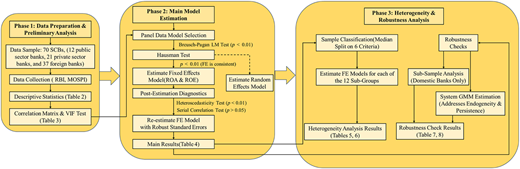
The empirical analysis was conducted following a systematic, multi-step process to ensure the selection of an appropriate model and the robustness of the results, as illustrated in the Methodological Flowchart (Figure 4). A comprehensive suite of diagnostic tests was performed to ensure the selection of an appropriate model and the robustness of the statistical inference. The purpose, result, and resulting methodological decision for each test are summarised in Table 1. First, pre-estimation diagnostic tests were performed. All variables were tested for stationarity using the Levin-Lin-Chu (LLC) panel unit-root test; the results confirmed all variables are stationary at the level. Multicollinearity was then assessed using the Variance Inflation Factor (VIF). While the VIFs for most variables were low, Inflation and Exchange Rate showed elevated values (Max VIF = 8.70 and 6.71, respectively). Although these values remain below the strict critical threshold of 10 (Gujarati & Porter, 2009), the individual coefficients of the macroeconomic variables will be interpreted with caution. Second, the appropriate panel data model for the full sample was selected. A Breusch-Pagan Lagrange Multiplier (LM) test (Breusch & Pagan, 1979) was highly significant (p < 0.01), rejecting the use of a simple Pooled OLS model. Subsequently, the Hausman test (Hausman, 1978) yielded a highly significant result (p < 0.01). This confirms that for the overall sample, the Fixed Effects (FE) model is the correct and consistent baseline estimator. Third, post-estimation diagnostics were conducted on the FE model. A modified Wald test for groupwise heteroscedasticity (Greene, 2008) and a Wooldridge test for autocorrelation (Wooldridge, 2010) were performed. Both tests yielded highly significant results (p < 0.01). To address both heteroscedasticity and serial correlation and ensure reliable statistical inference, all models were estimated using heteroskedasticity-robust standard errors clustered at the bank level (White, 1980). Fourth, the essence of this study's contribution lies in its classification-based analysis. To investigate group-specific heterogeneity, a separate Hausman test was conducted for each of the 12 subgroups. While the FE model was necessary for most groups, the Hausman test was insignificant for certain more homogeneous subgroups (e.g. “Low Profitability”). This indicates that for these specific clusters, a Random Effects (RE) or Pooled OLS model is both consistent and more efficient. The specific model chosen for each subgroup, as determined by this rigorous testing procedure, is reported in Table 5. Lastly, a set of robustness tests was conducted to validate the main findings. Robustness checks were additionally performed using System GMM estimations (Arellano & Bover, 1995) and analysis of a sub-sample of domestic banks. This multi-step approach ensures the results are statistically valid and robust.

Table 2 presents descriptive statistics for 70 SCBs from 2017–18 to 2022–23. The average ROA and ROE are 0.77% and 2.92%, respectively, indicating modest profitability in the sample. CRAR averages 29.66%, showing healthy capital levels. The average number of offices (1861.63) potentially indicates diverse operational scales within the sector. The wide range of exchange rates and GDP growth highlights currency fluctuations and a volatile economic environment during the period.

Table 3 presents the correlation matrix, which provides a preliminary analysis of the linear relationships among the determinants. As expected, ROA and ROE are strongly and positively correlated, a higher ROA is associated with an improved ROE. Whereas CRAR and ROA show weak but positive correlation, and there is no statistically meaningful correlation with ROE, these have different meanings. Contrary to the evidence found in Shehzad et al. (2013) regarding economies of scale, AS reportedly have weak negative correlations with both ROA and ROE. AQ is directly related to lower profitability; as expected, poor asset quality (higher NPLs) is associated with lower returns. Strong negative correlation between GDP growth and inflation. Other significant findings include a very strong positive association between inflation and exchange rate, and very strong negative associations between inflation and interest rate and exchange rate. The study employed a second test to check for the multicollinearity issue, which is the Variance Inflation Factor (VIF) for the independent variable. These values are below the most common critical threshold of 10 (Gujarati & Porter, 2009), indicating there is no multicollinearity issue in the independent variables.

Table 4 presents the estimated coefficients and standard errors from the fixed-effects panel regressions for both ROA and ROE.

Using fixed-effects panel regressions, an empirical analysis has been conducted to provide insights into the major factors driving profitability for SCBs in India.

4.2.1 Capital adequacy and profitability

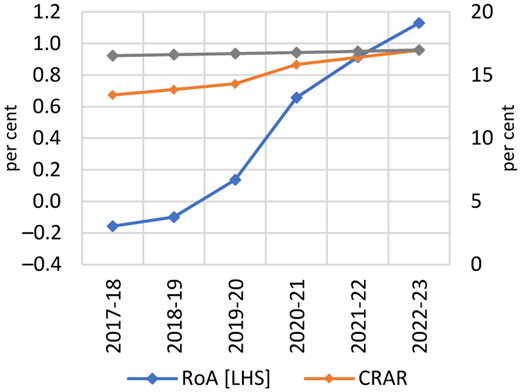
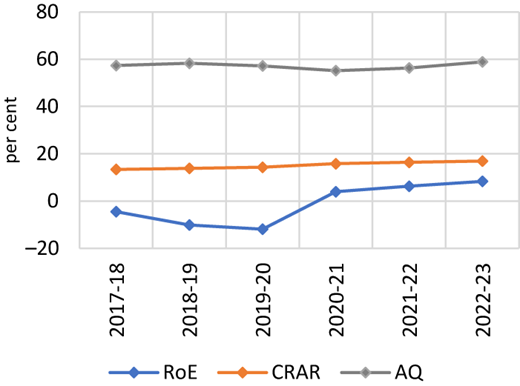
CRAR, has a positive and statistically significant relationship with both, ROA and ROE. Specifically, 1% increase in CRAR is associated with a 0.017 % increase in ROA and a 0.129 % increase in ROE, ceteris paribus (Charts 1 and 2). These findings align with earlier research (Alshebmi et al., 2020; Al-Homaidi et al., 2018) and provide strong support for the Efficient Structure Hypothesis. This suggests that better-capitalised banks leverage their financial strength to achieve lower funding costs and expand their profitable lending activities.

4.2.2 Asset quality and profitability

The positive and significant relationship between AQ and ROE (Chart 2) indicates that higher NPAs (poorer asset quality) are associated with higher ROE. While this finding contradicts traditional credit risk theories, which generally posit that effective credit risk management minimises losses and optimises profits (Almaqtari et al., 2019; Sayani, Kishore, & Kumar, 2017), it likely reflects a risk-return trade-off specific to the Indian market. Banks engaging in riskier, high-yield lending may temporarily inflate nominal shareholder returns despite rising credit risk, highlighting the aggressive pursuit of short-term returns (Trang et al., 2024). Conversely, there is no statistically significant relationship between AQ and ROA. This divergence suggests that while shareholders may capture a risk premium, overall asset profitability (ROA) is not significantly affected by NPA levels in this aggregate model. This indicates that short-term profitability and long-term financial stability do not move together in the banking sector, an unexpected result that warrants further investigation.

4.2.3 Bank size and profitability

A positive and statistically significant relationship between AS and ROA is in line with the theory of economies of scale (Al-Homaidi et al., 2018; Balani, 2019), a dynamic reflected in the movement shown in Chart 1. This implies that larger banks in India gain advantages from economies of scale, higher operational efficiency, lower funding costs due to diversification, and market power. In contrast, the relationship between AS and ROE is positive but statistically insignificant. This finding supports our theoretical expectation of a non-linear relationship and implies that the benefits of scale do not translate directly into higher returns for shareholders. This is due to diseconomies of scale arising from the more complex management of larger institutions (Stančić et al., 2014), a concept explained by Agency Theory, and the influence of otherwise negative factors on the ROE of larger banks.

4.2.4 Operational efficiency, branch network, and profitability

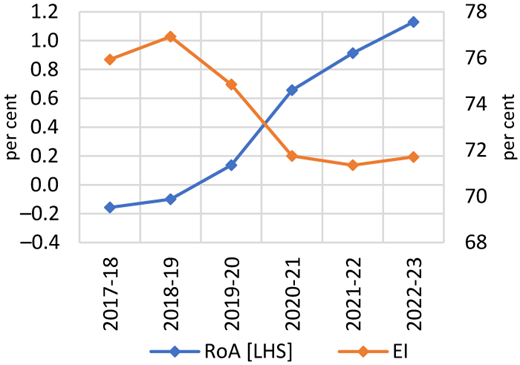
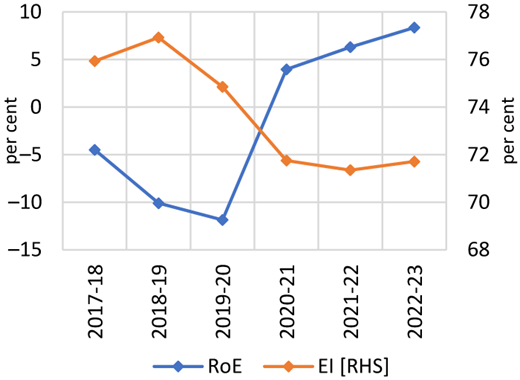
EI and the OFF both have negative relationships with ROA and ROE, indicating that higher operational efficiency is associated with lower expense-to-income ratios, thereby enhancing overall profitability. The inverse relationship between EI and profitability is visually demonstrated in Charts 3 and 4. This strongly supports our hypothesis (H1) and aligns with X-efficiency theory (Leibenstein, 1966). The negative effects stem from larger branch networks incurring high operational costs and, secondly, from the increasing use of digital banking channels in India, which reduces the value of physical branches.

4.2.5 Macroeconomic factors and profitability (H2)

Among the macroeconomic variables, Inflation (INF) has a significant positive impact on ROE but is not statistically significant for ROA. This apparent divergence is explained by the highly leveraged nature of banking institutions and the Fisher effect (Fisher, 1930). On the asset side, inflation drives up operational costs and challenges borrower repayment capacity, suppressing overall asset efficiency (ROA). Conversely, on the equity side, banks act as net debtors (borrowing via deposits). During inflationary periods, banks can pass costs onto borrowers through higher nominal lending rates faster than deposit rates adjust. Because equity forms a small fraction of a bank's balance sheet relative to its massive liabilities, this widening nominal spread, combined with the shrinking real value of deposit debt, temporarily inflates nominal shareholder returns (ROE), insulating them in the short term. The insignificant impact of GDP growth on ROA contradicts the predictions of the Structure-Conduct-Performance (SCP) paradigm and prior literature (Al-Qudah, 2020; Doǧan & Yildiz, 2023). However, in the Indian banking sector during the 2017–2023 sample period, Indian SCBs were undergoing a massive structural balance-sheet cleanup. This era was characterised by the aggressive recognition of legacy NPAs initiated by the RBI's Asset Quality Review (AQR) and by significant financial haircuts taken by banks through Insolvency and Bankruptcy Code (IBC) resolutions. Consequently, these severe, internal provisioning cycles largely decoupled bank profitability from broader macroeconomic growth trends. The burden of resolving past asset quality issues overshadowed the benefits of current economic expansion, rendering GDP growth statistically insignificant as an independent driver during this specific reformative period.

Finally, the insignificance of both the INT and EXCH across the models provides further institutional insights. For interest rates, the effect on profitability is often a double-edged sword, while higher rates can increase interest income, they simultaneously raise the cost of funds and elevate default risk (NPAs). These opposing forces frequently cancel each other out in aggregate linear models. Regarding exchange rates, the insignificance highlights the effectiveness of the Reserve Bank of India's (RBI) strict regulatory framework. Because Indian SCBs are subject to stringent Net Open Position Limits (NOPL) and mandatory hedging requirements, their core profitability remains largely insulated from direct foreign exchange volatility.

Among the explanatory variables under consideration, variables which have significant impact in the profitability (i.e. ROA and ROE) in different bank groups the summary is given in Table 5 and the model estimation result is shown in Table 6.

The regression results reveal diverse factors influencing the profitability of SCBs, with variations observed across different bank groups. The findings, summarised in Tables 5 and 6, provide strong support for our central hypothesis (H3) and reveal distinct, heterogeneous profitability dynamics. While CRAR consistently shows a positive and significant impact on both ROA and ROE across almost all bank classifications, aligning with the Efficient Structure Hypothesis, the influence of other key variables varies dramatically depending on the bank's profile. A deeper analysis of the classifications reveals distinct strategic patterns that strictly align with our empirical outputs. For banks with higher OBS exposure, capital adequacy (CRAR) positively impacts ROA, while asset management (AM) and operational expenses (EI) exhibit an inverse relationship. For highly profitable banks, scale and efficiency dominate, AS, AM, and CRAR are significant positive drivers for ROA, while the expense ratio (EI) is strongly negative. A clear strategic divide emerges concerning the net NPA ratio. Stronger banks (low NPA) rely heavily on efficient AM and scaled AS to drive ROA, while showing negative sensitivity to DEP. In stark contrast, weaker banks (high NPA) show massive sensitivity to CRAR and deposit mobilisation (DEP), reflecting intense regulatory pressures to improve capital adequacy and secure stable funding just to maintain baseline operations. Across human capital metrics (BPE and PPE), the EI consistently exerts a negative impact, underscoring that stringent cost control remains a universal driver of profitability regardless of employee productivity levels.

Regarding AQ, for banks with high lending to sensitive sectors, poorer asset quality (higher AQ) and higher deposits positively affect ROA. As noted in the full-sample analysis, this counter-intuitive finding, where higher NPAs correlate with higher returns, highlights a pronounced risk-return trade-off specific to the Indian market. It suggests that banks engaging in riskier, targeted lending are extracting higher yields, temporarily inflating nominal returns. However, AQ's impact on overall operational efficiency (ROA) remains largely insignificant for most other groups, suggesting that the direct drag of poor asset quality is being masked by India-specific factors such as complex NPA recognition norms and directed lending burdens.

As shown for AS, the relationship between bank size and profitability is complex. While it exhibits a positive effect on ROA across several groups, indicating economies of scale, its impact on ROE is often insignificant or even significantly negative (as seen in the Low OBS group). This negative impact on shareholder returns likely reflects diseconomies of scale and higher complexity in larger institutions, supporting the non-linear theoretical expectation for bank size. Furthermore, a higher number of offices (OFF) generally indicates systematically lower profit due to diseconomies of scale associated with branch networks and a decreasing reliance on physical branches.

Macroeconomic factors were found to have heterogeneous impacts on profitability. Notably, INF consistently increases ROE across the sub-groups. As established in our primary analysis, this aligns with the dynamics of the Fisher effect. Highly leveraged Indian banks appear to successfully pass inflationary pressures onto borrowers through higher nominal lending rates, thereby protecting and temporarily inflating nominal shareholder returns, even during periods of macroeconomic stress. Contrary to some existing literature (Borio & Lowe, 2002) and the predictions of the SCP paradigm, the impact of GDP growth on ROA across most bank groups is non-significant. However, this lack of significance reflects the specific structural realities of the Indian banking sector during the 2017–2023 sample period. Intensive, bank-specific cleanup efforts, such as the RBI's Asset Quality Review and massive provisioning due to Insolvency and Bankruptcy Code (IBC) resolutions, largely decoupled bank profitability from broader macroeconomic business cycles during these years.

To confirm the soundness of our primary conclusions and to factor in the possible problem of persistence of profitability and endogeneity, we once again estimate our models with a step System Generalised Method of Moments (GMM) estimator (Arellano & Bover, 1995). Table 7 shows the results.

The GMM estimations are validated by a rigorous series of diagnostic tests. Because our data exhibits heteroscedasticity, the robust Hansen test of overidentifying restrictions is the appropriate metric for instrument validity. The Hansen test is insignificant for both the ROA model (p = 0.900) and the ROE model (p = 0.205), indicating that we cannot reject the null hypothesis and confirming that our instrument set is valid. Furthermore, we report the Arellano-Bond tests for serial correlation. As expected by mathematical construction, the test for first-order serial correlation (AR(1)) is significant for both models (p = 0.015 for ROA; p = 0.029 for ROE). Crucially, the test for second-order serial correlation (AR(2)) is insignificant for both models (p = 0.263 for ROA; p = 0.659 for ROE). This clearly demonstrates the absence of second-order serial correlation in the residuals, thereby validating the GMM specification. The GMM results provide several important insights. First, the coefficient on the lagged dependent variable is positive and highly significant in the ROE model (β = 0.385, p < 0.001), confirming that bank profitability is a persistent and dynamic process. This finding alone justifies using a dynamic model for this robustness check. Second, a critical observation from the System GMM output is that, after controlling for dynamic persistence and potential endogeneity, the statistical significance of most bank-specific and macroeconomic variables diminishes. In the ROA model, only the Deposit Ratio remains weakly significant. In the ROE model, none of the explanatory variables, aside from lagged ROE, remain statistically significant. Notably, the impact of INF loses statistical significance under the GMM model compared to the Fixed Effects model. This confirms that the positive impact of inflation on nominal shareholder returns (the Fisher effect) observed in the static model is a short-term phenomenon. Once the dynamic, long-term persistence of profitability is accounted for, inflation does not contribute to sustainable returns, resolving the apparent inconsistency between the static and dynamic models.

This shift in significance does not invalidate our primary Fixed Effects results, rather, it offers a more nuanced, dynamic interpretation. Our main Fixed Effects model effectively identifies the key static factors associated with establishing long-term baseline profitability levels across banks. However, the GMM results demonstrate that in a dynamic, year-to-year context, a massive portion of a bank's current profitability variation is simply absorbed by its past performance (persistence). The influence of the other variables, while critical for establishing a bank's overall profitability tier (as seen in FE), has a less pronounced immediate, short-term impact once the strong dynamic momentum is accounted for mathematically.

An examination was carried out to eliminate the risk that our key results might be affected; therefore, we refitted our main Fixed Effects models using a sub-sample of just the 33 domestic (public and private) banks in our sample. The comparative results for the ROA and ROE models are provided in Table 8.

The investigation, considering the domestic banks sub-sample to a great extent, substantiates the strength of various fundamental results. In both ROA and ROE, the EI still has a robust, statistically significant negative effect. This supports our main findings that high operational efficiency is a source of profitability among Indian banks, which is also in line with the X-efficiency theory that focuses on the managerial effectiveness in managing costs (Berger & Bouwman, 2009).

This robustness test not only verifies the soundness of our fundamental findings on capital and efficiency but, more to the point, it upholds the main objectives of this paper. It shows that the drivers of profitability are not homogeneous and that the more homogenous the sample of domestic banks that are studied, the more specific strategic priorities with their focus on asset quality and deposit mobilisation, which proves the necessity of a heterogeneous profitability classification-based method.

The determinants of the profitability of SCBs in India were examined in this study, where profits are defined through measures of ROA and ROE using a balanced panel data set with a new approach based on classification. The influence of bank-specific and macroeconomic factors on profitability is investigated, accounting for the heterogeneity of the IBS. The analysis proves that CRAR exerts a positive impact on profitability for most bank groups, which is in line with the trade-off theory (Kraus & Litzenberger, 1973) and studies conducted in India and other emerging nations like South Africa (Alshebmi et al., 2020; Maduane & Tsaurai, 2016), this finding supports our first hypothesis (H1) and the Efficient Structure Hypothesis which shows the importance of strong capitalisation for bank performance. Asset quality had a mixed effect, surprisingly, higher NPAs were associated with higher ROE, suggesting a short-term risk-reward premium in the market, while their impact on ROA was statistically insignificant. The size of the bank was complex; it shows a positive influence on ROA, indicating economies of scale and an insignificant effect on ROE, which is attributed to diseconomies of scale (Stančić et al., 2014) developed by larger institutions. This dual finding aligns with our non-linear theoretical expectation, which implies that banks must critically consider the trade-off between size and efficiency. Operational efficiency captured in this study by the expense-income ratio is regarded as the last significant determinant of profitability (Song et al., 2019), elaborating the significance of cost management attached to it, this is consistent with X-efficiency theory, and the same results were observed in studies across Sub-Saharan Africa (Sarpong-Kumankoma, Abor, Aboagye, & Amidu, 2018). The number of offices negatively affected the profitability (Mukherjee, 2019), the increasing importance of digital channels makes it imperative to reform the branch network. Macroeconomic factors revealed mixed outcomes. The positive impact of inflation on ROE suggests a Fisher effect dynamic, while the generally insignificant impact of GDP growth across groups contrasts with the simple predictions of the SCP paradigm, likely reflecting the dominance of structural cleanup efforts in the Indian banking sector during the sample period.

A key contribution of this study is its classification-based approach, which unveiled heterogeneity and provided strong support for our central hypothesis (H3). Analysing profitability determinants across the SCB groups detailed in Figure 3 supports the concept of heterogeneous profitability dynamics. The findings from the study offer various insights to the stakeholders. For bank managers, it's a guide that profitability is not uniform and that strategies should be tailored to the bank's specific profile. Banks with high OBS exposure would benefit from stricter regulatory oversight of OBS activities and robust risk management practices. Banks with high NPAs should prioritise implementing more stringent credit appraisal processes and NPL resolution mechanisms. For banks with low profitability, expense reduction and revenue diversification initiatives must be explored, and banks with a high concentration of branches in specific geographic areas should implement strategies to adjust to regional economic fluctuations and deploy technological solutions (Di Febo & Angelini, 2022; Kowalewski, 2023) to improve their cost efficiency. It is important to note that a dynamic System GMM robustness check confirmed that profitability is highly persistent. While our main Fixed Effects model successfully identifies the key static factors that establish a bank's long-term profitability level, our GMM results show that in a dynamic, year-to-year context, past performance is the dominant driver.

The results of this research, especially the empirical evidence supporting heterogeneous profitability dynamics, provide highly targeted value to bank managers and regulators by linking operational realities to economic theory. Crucially, the findings indicate that a one-size-fits-all approach is inadequate, strategies must be tailored to a bank's specific profile.

For bank management, the implications are direct. Consistent with the Efficient Structure Hypothesis, we find that for banks with high NPAs, CRAR is the primary driver of profitability. Managers of these institutions must prioritise aggressive capital augmentation and de-risk their balance sheets to restore market confidence and lower funding costs. Conversely, for private-sector banks, profitability is highly sensitive to AQ and deposit mobilisation. Given the unexpected positive association observed between NPAs and nominal returns, which highlights the theoretical risk-return trade-off, these banks must carefully balance the aggressive pursuit of high-yield loans with prudent, long-term credit risk management to prevent sudden default shocks from erasing shareholder gains. For Public Sector Banks, where traditional fundamentals proved less significant, the overwhelming negative influence of the Expense-Income ratio points directly to X-efficiency theory. For these banks, survival and profitability mandate an intense managerial focus on stringent cost control and streamlining operational inefficiencies.

For policymakers and regulators, such as the RBI, these results strongly advocate for a shift towards differentiated oversight rather than standardised, industry-wide mandates. A regulatory strategy that appreciates the distinct operational structures of public, private, and foreign banks is essential. For instance, implementing precision-targeted, stringent capital requirements specifically for banks with weaker asset portfolios may prove a far more effective tool for ensuring systemic financial stability than enacting blanket capital increases across the entire banking sector.

Limitations: This study was primarily conducted on publicly available financial data, which might not capture all aspects of bank operations and management quality. The potential for unobserved variable bias and endogeneity, though addressed with robustness checks, should be acknowledged. Furthermore, while our robustness checks utilising System GMM confirmed the absence of second-order serial correlation, they highlighted that bank profitability is highly persistent, thus, much of the short-term variation is absorbed dynamically, leaving the static, long-term drivers captured by our primary Fixed Effects model. The study focuses specifically on SCBs in India and a limited time frame; hence, generalising the findings to other banking sectors and periods should be done cautiously. Finally, due to data constraints, this study did not include variables for bank governance or market competition, which the literature suggests may also be important determinants of profitability.

Future Research Directions based on the findings and limitations of this study, several specific avenues for future research emerge:

FRD1: Future research could explore the nuanced influence of specific asset management practices on bank profitability by employing qualitative data, such as management surveys and case studies, to gain deeper, firm-level insights that quantitative panel data cannot capture.

FRD2: Researchers should extend this novel classification-based framework to analyse the impact of major, specific regulatory shifts, such as the full transition to Basel III norms or the long-term effects of demonetisation. This would reveal how differently categorised bank groups absorb and recover from systemic policy shocks.

FRD3: Given the rapidly evolving financial landscape, it is crucial to investigate the impact of increasing competition from Non-Banking Financial Companies (NBFCs) and FinTech platforms. Future studies should incorporate NBFCs into the dataset to provide a broader, systemic perspective on profitability across the entire Indian financial sector.

The views expressed in the paper are those of the authors and not of the institutions to which they belong.

The authors thank the journal's anonymous reviewers for their incredibly helpful comments on improving the article.

The supplementary material for this article can be found online.
Abdelmoneim
,
Z.
, &
Yasser
,
M.
(
2023
).
The impact of bank performance and economic growth on bank profitability: Camel model application in middle-income countries
.
Banks and Bank Systems
,
18
(
3
),
205
220
. doi: .
Al-Harbi
,
A.
(
2019
).
The determinants of conventional banks profitability in developing and underdeveloped OIC countries
.
Journal of Economics, Finance and Administrative Science
,
24
(
47
),
4
28
. doi: .
Al-Homaidi
,
E. A.
,
Tabash
,
M. I.
,
Farhan
,
N. H. S.
,
Almaqtari
,
F. A.
, &
McMillan
,
D.
(
2018
).
Bank-specific and macro-economic determinants of profitability of Indian commercial banks: A panel data approach
.
Cogent Economics and Finance
,
6
(
1
),
1
26
. doi: .
Al-Homaidi
,
E. A.
,
Almaqtari
,
F. A.
,
Yahya
,
A. T.
, &
Khaled
,
A. S. D.
(
2020
).
Internal and external determinants of listed commercial banks’ profitability in India: Dynamic GMM approach
.
International Journal of Monetary Economics and Finance
,
13
(
1
),
34
67
. doi: .
Al-Qudah
,
A.
(
2020
).
Macroeconomic and bank-specific variables and the liquidity of Jordanian commercial banks
.
The Journal of Asian Finance, Economics and Business
,
7
(
12
),
85
93
. doi: .
Al-sadi
,
A.
(
2022
).
The impact of asset management on achieving bank profitability
.
Periodicals of Engineering and Natural Sciences (PEN)
,
10
(
5
),
5
13
.
Almaqtari
,
F. A.
,
Al-Homaidi
,
E. A.
,
Tabash
,
M. I.
, &
Farhan
,
N. H.
(
2019
).
The determinants of profitability of Indian commercial banks: A panel data approach
.
International Journal of Finance and Economics
,
24
(
1
),
168
185
. doi: .
Alshebmi
,
A. S.
,
Adam
,
M. H. M.
,
Mustafa
,
A. M. A.
,
Thomran
,
M.
, &
Fathelbab
,
O. E. A.
(
2020
).
Assessing the non-performing loans and their effect on banks profitability: Empirical evidence from the Saudi Arabia banking sector
.
International Journal of Innovation, Creativity and Change
,
11
(
8
),
2020
.
Available from:
 Link to the website
Apau
,
R.
, &
Sibindi
,
A. B.
(
2023
).
The effect of bank-specific dynamics on profitability under changing economic conditions: Evidence from Ghana
.
Banks and Bank Systems
,
18
(
4
),
169
180
. doi: .
Arellano
,
M.
, &
Bover
,
O.
(
1995
).
Another look at the instrumental variable estimation of error-components models
.
Journal of Econometrics
,
68
(
1
),
29
51
. doi: .
Arumugam
,
S.
, &
Jothikumar
,
J.
(
2017
).
Bank specific, industry specific and macro economic determinants of profitability of public sector banks in India: 2010-2016 a panel data approach
.
International Journal of Agricultural and Statistical Sciences
,
13
,
655
662
.
Assous
,
H. F.
(
2022
).
Prediction of banks efficiency using feature selection method: Comparison between selected machine learning models
.
Complexity
,
2022
(
1
), 3374489. doi: .
Avianto
,
W.
,
Siregar
,
H.
,
Ratnawati
,
A.
, &
Siregar
,
M. E.
(
2024
).
Analysis of valuation determinants of commercial banks with digital services in Indonesia
.
Revista de Gestão Social e Ambiental - RGSA
,
18
(
3
), e06570. doi: .
Bagh
,
T.
,
Hunjra
,
A. I.
,
Guo
,
Y.
, &
Bouri
,
E.
(
2025
).
Corporate capital structure in BRICS economies: An integrated analysis of ESG, firm, industry, and macroeconomic determinants
.
International Journal of Finance and Economics
,
30
(
3
),
2682
2704
. doi: .
Bain
,
J. S.
(
1951
).
Relation of profit rate to industry concentration: American manufacturing, 1936–1940
.
Quarterly Journal of Economics
,
65
(
3
),
293
324
. doi: .
Balani
,
H.
(
2019
).
Assessing the introduction of anti-money laundering regulations on bank stock valuation an empirical analysis
.
Journal of Money Laundering Control
,
22
(
1
),
76
88
. doi: .
Barakat
,
H. A.
,
Elwahab
,
S. A.
,
Yassin
,
N. M.
,
Ibrahim
,
S. M. M.
,
Ismail
,
M. H.
, &
Eldin
,
N. W. S.
(
2024
).
Asset quality and banks performance: A panel data analysis of commercial banks
.
Risk Governance and Control: Financial Markets and Institutions
,
14
(
3
),
111
. doi: .
Barua
,
R.
,
Roy
,
M.
, &
Raychaudhuri
,
A.
(
2016
).
Structure, conduct and performance analysis of Indian commercial banks
.
South Asian Journal of Macroeconomics and Public Finance
,
5
(
2
),
157
185
. doi: .
Belkhir
,
M.
,
Grira
,
J.
,
Hassan
,
M. K.
, &
Soumaré
,
I.
(
2019
).
Islamic banks and political risk: International evidence
.
The Quarterly Review of Economics and Finance
,
74
,
39
55
. doi: .
Berger
,
A. N.
(
1995
).
The profit-structure relationship in banking--tests of market-power and efficient-structure hypotheses
.
Journal of Money, Credit and Banking
,
27
(
2
),
404
431
. doi: .
Berger
,
A. N.
, &
Bouwman
,
C. H. S.
(
2009
).
Bank liquidity creation
.
The Review of Financial Studies
,
22
(
9
),
3779
3837
. doi: .
Bodla
,
B.
, &
Verma
,
R.
(
2011
).
Performance of scheduled commercial banks in India:- an application of D.E.A.
 
Decision - A Journal of IIM Calcutta
,
38
,
5
77
.
Borio
,
C.
, &
Lowe
,
P.
(
2002
).
Asset prices, financial and monetary stability: Exploring the nexus
.
Available from:
 Link to the website
Borio
,
C.
,
Gambacorta
,
L.
, &
Hofmann
,
B.
(
2017
).
The influence of monetary policy on bank profitability
.
International Finance
,
20
(
1
),
48
63
. doi: .
Bouhider
,
R.
(
2021
).
Econometric study of the effect of deposits on Islamic banks profitability: Evidence from Malaysia
.
Economics Bulletin
,
41
(
3
),
1292
1302
.
Available from:
 Link to the website
Breusch
,
T. S.
, &
Pagan
,
A. R.
(
1979
).
A simple test for heteroscedasticity and random coefficient variation
.
Econometrica
,
47
(
5
),
1287
1294
. doi: .
Brogi
,
M.
, &
Langone
,
R.
(
2015
).
Bank profitability and capital adequacy in the post-crisis context
.
Financial Crisis, Bank Behaviour and Credit Crunch
,
95
109
. doi: .
Chang
,
Y. L.
, &
Talley
,
D. A.
(
2016
).
Bank risk in a decade of low interest rates
.
Journal of Economics and Finance
,
41
(
3
),
505
528
. doi: .
Demsetz
,
H.
(
1973
).
Industry structure, market rivalry, and public policy
.
The Journal of Law and Economics
,
16
(
1
),
1
9
. doi: .
Available from:
 Link to the website
Desai
,
R.
(
2021
).
Impact of priority sector lending on financial profitability: Segment wise panel data analysis of Indian banks
.
Management and Accounting Review
,
20
(
1
),
19
37
. doi: .
Dhar
,
S.
, &
Bakshi
,
A.
(
2015
).
Determinants of loan losses of Indian banks: A panel study
.
Journal of Asia Business Studies
,
9
(
1
),
17
32
. doi: .
Di Febo
,
E.
, &
Angelini
,
E.
(
2022
).
The impact of Internet banking on performance and branches: Crisis or change in practice?
 
Global Business Review
. doi: .
Dietrich
,
A.
, &
Wanzenried
,
G.
(
2011
).
Determinants of bank profitability before and during the crisis: Evidence from Switzerland
.
Journal of International Financial Markets, Institutions and Money
,
21
(
3
),
307
327
. doi: .
Doǧan
,
M.
, &
Yildiz
,
F.
(
2023
).
Testing the factors that determine the profitability of banks with a dynamic approach: Evidence from Turkey
.
Journal of Central Banking Theory and Practice
,
12
(
1
),
225
248
. doi: .
Duong
,
T. M. P.
, &
Dang
,
V. D.
(
2023
).
Market structure and bank performance: A comprehensive picture of Vietnam
.
Banks and Bank Systems
,
18
(
3
),
74
86
. doi: .
Fajriana
,
R.
,
Roni
,
M.
,
Syamni
,
G.
,
Taniro
,
A.
, &
Saputra
,
J.
(
2021
).
Determinant factors that affect foreign banks profitability: An evidence from Indonesia
. In
Proceedings of the 11th Annual International Conference on Industrial Engineering and Operations Management Singapore
.
Available from:
 Link to the website
Fisher
,
I.
(
1930
).
The theory of interest as determined by impatience to spend income and opportunity to invest it
.
Macmillan
.
Available from:
 Link to the website
Flannery
,
M. J.
(
1981
).
Market interest rates and commercial bank profitability: An empirical investigation
.
The Journal of Finance
,
36
(
5
),
1085
1101
. doi: .
Gazi
,
M. A. I.
,
Nahiduzzaman
,
M.
,
Harymawan
,
I.
,
Al Masud
,
A.
, &
Dhar
,
B. K.
(
2022
).
Impact of COVID-19 on financial performance and profitability of banking sector in special reference to private commercial banks: Empirical evidence from Bangladesh
.
Sustainability
,
14
(
10
),
6260
. doi: .
Ghosh
,
S.
(
2016
).
Productivity, ownership and firm growth: Evidence from Indian banks
.
International Journal of Emerging Markets
,
11
(
4
),
607
631
. doi: .
Greene
,
W. H.
(
2008
).
Econometric analysis
.
Pearson/Prentice Hall
.
Available from:
 Link to the website
Gujarati
,
D. N.
, &
Porter
,
D. C.
(
2009
).
Basic econometrics
( (5th ed.) ).
New York
:
McGraw Hill
.
Available from:
 Link to the website
Gupta
,
N.
, &
Mahakud
,
J.
(
2020
).
Ownership, bank size, capitalization and bank performance: Evidence from India
.
Cogent Economics and Finance
,
8
(
1
), 1808282. doi: .
Hair
,
J. F.
,
Black
,
W. C.
, &
Babin
,
B. J.
(
2010
).
Multivariate data analysis: A global perspective
.
Pearson Education
.
Available from:
 Link to the website
Haron
,
R.
,
Nomran
,
N. M.
,
Abdullah Othman
,
A. H.
,
Md Husin
,
M.
, &
Sharofiddin
,
A.
(
2021
).
The influence of firm, industry and concentrated ownership on dynamic capital structure decision in emerging market
.
Journal of Asia Business Studies
,
15
(
5
),
689
709
. doi: .
Hausman
,
J. A.
(
1978
).
Specification tests in econometrics
.
Econometrica
,
46
(
6
),
1251
1271
. doi: .
Islam
,
M. S.
, &
Nishiyama
,
S. -I.
(
2016
).
The determinants of bank profitability: Dynamic panel evidence from South Asian countries
.
Journal of Applied Finance and Banking
,
6
(
3
),
1
6
.
Available from:
 Link to the website
Jensen
,
M. C.
, &
Meckling
,
W. H.
(
1976
).
Theory of the firm: Managerial behavior, agency costs and ownership structure
.
Journal of Financial Economics
,
3
(
4
),
305
360
. doi: ,
Available from:
 Link to the website
Keynes
,
J. M.
(
1937
).
The general theory of employment
.
The Quarterly Journal of Economics
,
51
(
2
),
209
223
. doi: .
Kolcunova
,
D.
, &
Havranek
,
T.
(
2018
).
Estimating the effective lower bound on the Czech national bank’s policy rate
.
Finance a Uver - Czech Journal of Economics and Finance
,
68
(
6
),
550
577
.
Available from:
 Link to the website
Kosumi
,
A.
, &
Zharku
,
L.
(
2024
).
Bank-specific, economic and legal determinants of profitability in the Republic of North Macedonia
.
Access to Justice in Eastern Europe
,
7
(
2
),
212
233
. doi: .
Kowalewski
,
O.
(
2023
).
Organizational mode choices of multinational banks abroad
.
Global Finance Journal
,
57
, 100863. doi: .
Kraus
,
A.
, &
Litzenberger
,
R. H.
(
1973
).
A state-preference model of optimal financial leverage
.
The Journal of Finance
,
28
(
4
),
911
922
. doi: .
Leibenstein
,
H.
(
1966
).
Allocative efficiency vs ‘X-efficiency.’
.
The American Economic Review
,
56
(
3
),
392
415
.
Available from:
 Link to the website
Lesche
,
T. F.
(
2021
). Too-big-to-fail in banking. In
Springer Gabler Wiesbaden, Finanzwirtschaft, Banken Und Bankmanagement I Finance, Banks and Bank Management
. doi: .
Liang
,
H. Y.
,
Ching
,
Y. P.
, &
Chan
,
K. C.
(
2013
).
Enhancing bank performance through branches or representative offices? Evidence from European banks
.
International Business Review
,
22
(
3
),
495
508
. doi: .
Maduane
,
R.
, &
Tsaurai
,
K.
(
2016
).
The link between capital structure and banking sector performance in an emerging economy
.
Risk Governance and Control: Financial Markets and Institutions
,
6
(
4-2
),
291
297
. doi: .
Maiti
,
A.
,
Kumar Jana
,
S.
, &
Kumar Jana
,
D.
(
2017
).
Determinants of profitability of banks in India: A panel data analysis
.
Scholars Journal of Economics, Business and Management
,
4
(
7
),
436
445
. doi: .
Mukherjee
,
S.
(
2019
).
Banks’ profitability and extent of their employee outlay nexus - an Indian perspective
.
Indian Journal of Finance
,
13
(
7
),
29
40
. doi: .
Naceur
,
S. B.
, &
Omran
,
M.
(
2011
).
The effects of bank regulations, competition, and financial reforms on banks’ performance
.
Emerging Markets Review
,
12
(
1
),
1
20
. doi: .
Neves
,
M. E.
,
Proença
,
C.
, &
Dias
,
A.
(
2020
).
Bank profitability and efficiency in Portugal and Spain: A non-linearity approach
.
Journal of Risk and Financial Management
,
13
(
11
),
284
. doi: .
Nguyen
,
J.
,
Parsons
,
R.
, &
Argyle
,
B.
(
2021
).
An examination of diversification on bank profitability and insolvency risk in 28 financially liberalized markets
.
Journal of Behavioral and Experimental Finance
,
29
, 100416. doi: .
Ozili
,
P. K.
(
2021
).
Bank profitability determinants: Comparing the United States, Nigeria and South Africa
.
International Journal of Banking and Finance
,
16
(
1
),
55
78
. doi: .
Pham
,
N. H.
,
Hoang
,
T. M.
, &
Pham
,
N. T. H.
(
2022
).
The impact of capital structure on bank profitability: Evidence from Vietnam
.
Cogent Business and Management
,
9
(
1
), 2096263. doi: .
Priharta
,
A.
, &
Gani
,
N. A.
(
2025
).
Credit risk and factors affecting profitability: Empirical evidence from Republic of Indonesia state-owned banks
.
Quality - Access to Success
,
26
(
207
),
161
. doi: .
Rawlin
,
R. S.
,
Ramachandran
,
S. R.
, &
Dev
,
K.
(
2023
).
Framework to optimize profitability of private sector banks in India
. In
ACM International Conference Proceeding Series
(pp. 
356
362
). doi: .
Razermera
,
T.
,
Brijlal
,
P.
, &
Jwara
,
N.
(
2024
).
The impact of risk management on banks’ profitability: A South African perspective
.
International Journal of Economics and Financial Issues
,
14
(
4
),
56
65
. doi: .
Saif-Alyousfi
,
A. Y. H.
(
2022
).
Determinants of bank profitability: Evidence from 47 Asian countries
.
Journal of Economic Studies
,
49
(
1
),
44
60
. doi: .
Salami
,
M. A.
,
Tanrivermiş
,
H.
,
Sarea
,
A. M.
, &
Tanrivermis
,
Y.
(
2023
). Evaluating the robustness of Basel capital accords to combat the effects of COVID-19 pandemic in Islamic banking. In
Islamic Accounting And Finance: A Handbook
(pp. 
745
775
). doi: .
Salike
,
N.
, &
Ao
,
B.
(
2018
).
Determinants of bank’s profitability: Role of poor asset quality in Asia
.
China Finance Review International
,
8
(
2
),
216
231
. doi: .
Sarpong-Kumankoma
,
E.
,
Abor
,
J.
,
Aboagye
,
A. Q. Q.
, &
Amidu
,
M.
(
2018
).
Differences in bank profit persistence in Sub-Saharan Africa
.
African Journal of Economic and Management Studies
,
9
(
4
),
512
522
. doi: .
Sayani
,
H.
,
Kishore
,
P.
, &
Kumar
,
V.
(
2017
).
Internal determinants of return on equity: Case of the UAE commercial banks
.
Banking and Finance Review
,
9
,
47
74
.
Sengupta
,
R.
, &
Vardhan
,
H.
(
2017
).
Non-performing assets in Indian Banks: This time it is different
.
Indira Gandhi Institute of Development Research
.
Mumbai Working Papers. Available from:
 Link to the website
Shehzad
,
C. T.
,
de Haan
,
J.
, &
Scholtens
,
B.
(
2013
).
The relationship between size, growth and profitability of commercial banks
.
Applied Economics
,
45
(
13
),
1751
1765
. doi: .
Song
,
X.
,
Cheng
,
D.
, &
Wu
,
R.
(
2019
).
Comparing the influence of green credit on commercial bank profitability in China and Abroad: Empirical test based on a dynamic panel system using GMM
.
International Journal of Financial Studies
,
7
(
4
),
64
. doi: .
Stančić
,
P.
,
Čupić
,
M.
, &
Obradović
,
V.
(
2014
).
Influence of board and ownership structure on bank profitability: Evidence from South East Europe
.
Economic Research-Ekonomska Istraživanja
,
27
(
1
),
573
589
. doi: .
Takahashi
,
F. L.
, &
Vasconcelos
,
M. R.
(
2024
).
Bank efficiency and undesirable output: An analysis of non-performing loans in the Brazilian banking sector
.
Finance Research Letters
,
59
, 104651. doi: .
Tecles
,
P. L.
, &
Tabak
,
B. M.
(
2010
).
Determinants of bank efficiency: The case of Brazil
.
European Journal of Operational Research
,
207
(
3
),
1587
1598
. doi: .
Trang
,
N. T. T.
,
Duong
,
N. T.
, &
Binh
,
P. N.
(
2024
).
The impact of asset-liability management on the profitability of listed commercial banks in Vietnam
.
International Journal of Economics and Financial Issues
,
14
(
6
),
369
378
. doi: .
Von Mises
,
L.
(
1953
).
The theory of money and credit
.
J. Cape
.
Available from:
 Link to the website
White
,
H.
(
1980
).
A heteroskedasticity-consistent covariance matrix estimator and a direct test for heteroskedasticity
.
Econometrica
,
48
(
4
),
817
. doi: .
Wooldridge
,
J. M.
(
2010
).
Econometric analysis of cross section and panel data
.
The MIT Press
.
Available from:
 Link to the website
Zopounidis
,
C.
, &
Kosmidou
,
K.
(
2008
).
The determinants of banks’ profits in Greece during the period of EU financial integration
.
Managerial Finance
,
34
(
3
),
146
159
. doi: .
Published in LBS Journal of Management & Research. Published by Emerald Publishing Limited. This article is published under the Creative Commons Attribution (CC BY 4.0) licence. Anyone may reproduce, distribute, translate and create derivative works of this article (for both commercial and non-commercial purposes), subject to full attribution to the original publication and authors. The full terms of this licence may be seen at Link to the terms of the CC BY 4.0 licence.

Supplementary data

Data & Figures

Figure 1
A diagram of a conceptual framework for bank profitability.The diagram illustrates a conceptual framework for bank profitability, highlighting theoretical foundations, independent variables, and dependent variables. The theoretical foundations include various theories such as the Efficient Structure Hypothesis, X-efficiency Theory, Agency Theory, Trade-off Theory, Structure-Conduct-Performance Paradigm, Keynesian Theory, and Austrian Business Cycle Theory. The independent variables are divided into bank-specific factors and macroeconomic factors. Bank-specific factors include CRAR, AS, AQ, EI, AM, DEP, and OFF. Macroeconomic factors include GDP, INT, INF, and EXCH. The dependent variables are bank profitability measures, specifically ROA and ROE. The diagram also shows heterogeneous classifications of bank groups, including OBS, BPE, PPE, Net Profit to Total Assets Ratio, Net NPA to Net Advances Ratio, and Lending to the sensitive sector as a percentage of total advances.

Conceptual framework. Source: Authors

Figure 1
A diagram of a conceptual framework for bank profitability.The diagram illustrates a conceptual framework for bank profitability, highlighting theoretical foundations, independent variables, and dependent variables. The theoretical foundations include various theories such as the Efficient Structure Hypothesis, X-efficiency Theory, Agency Theory, Trade-off Theory, Structure-Conduct-Performance Paradigm, Keynesian Theory, and Austrian Business Cycle Theory. The independent variables are divided into bank-specific factors and macroeconomic factors. Bank-specific factors include CRAR, AS, AQ, EI, AM, DEP, and OFF. Macroeconomic factors include GDP, INT, INF, and EXCH. The dependent variables are bank profitability measures, specifically ROA and ROE. The diagram also shows heterogeneous classifications of bank groups, including OBS, BPE, PPE, Net Profit to Total Assets Ratio, Net NPA to Net Advances Ratio, and Lending to the sensitive sector as a percentage of total advances.

Conceptual framework. Source: Authors

Close modal
Figure 2
A diagram of dependent and independent variables affecting the profitability of Indian banks.The diagram illustrates the relationship between dependent and independent variables affecting the profitability of Indian banks. The dependent variables are return on equity and return on assets. The independent variables are categorized into bank-specific variables and macro-economic variables. Bank-specific variables include bank size, assets quality, capital adequacy ratio, deposits, number of offices, assets management, and expense income ratio. Macro-economic variables include gross domestic product, inflation rate, interest rate, and exchange rate. Each variable is supported by references from various studies.

Dependent and independent variables. Source: Authors

Figure 2
A diagram of dependent and independent variables affecting the profitability of Indian banks.The diagram illustrates the relationship between dependent and independent variables affecting the profitability of Indian banks. The dependent variables are return on equity and return on assets. The independent variables are categorized into bank-specific variables and macro-economic variables. Bank-specific variables include bank size, assets quality, capital adequacy ratio, deposits, number of offices, assets management, and expense income ratio. Macro-economic variables include gross domestic product, inflation rate, interest rate, and exchange rate. Each variable is supported by references from various studies.

Dependent and independent variables. Source: Authors

Close modal
Figure 3
A diagram of the classification of scheduled commercial banks into different groups.The diagram illustrates the classification of scheduled commercial banks into various groups based on different financial metrics. At the top, the diagram starts with the label 'Scheduled Commercial Banks,' which branches out into six different categories. The first category is 'Net Profit to total assets ratio,' indicating a positive relationship. The second category is 'Net NPA to Net Advances ratio,' indicating a negative relationship, with a citation from Maiti and Jana, 2017. The third category is 'Off-Balance sheet exposure to total liabilities ratio,' indicating a positive or negative relationship, with a citation from Saif-Alyoufi, 2022. The fourth category is 'Business per employee,' indicating a positive relationship, with a citation from Mukherjee, 2019. The fifth category is 'Profit per employee,' indicating a positive relationship, with a citation from Islam and Nishiyama, 2016.

Classification of SCBs into different groups. Source: Authors

Figure 3
A diagram of the classification of scheduled commercial banks into different groups.The diagram illustrates the classification of scheduled commercial banks into various groups based on different financial metrics. At the top, the diagram starts with the label 'Scheduled Commercial Banks,' which branches out into six different categories. The first category is 'Net Profit to total assets ratio,' indicating a positive relationship. The second category is 'Net NPA to Net Advances ratio,' indicating a negative relationship, with a citation from Maiti and Jana, 2017. The third category is 'Off-Balance sheet exposure to total liabilities ratio,' indicating a positive or negative relationship, with a citation from Saif-Alyoufi, 2022. The fourth category is 'Business per employee,' indicating a positive relationship, with a citation from Mukherjee, 2019. The fifth category is 'Profit per employee,' indicating a positive relationship, with a citation from Islam and Nishiyama, 2016.

Classification of SCBs into different groups. Source: Authors

Close modal
Figure 4
A flowchart illustrating the stages of a research methodology.The flowchart outlines a research methodology divided into three phases: Data Preparation and Preliminary Analysis, Main Model Estimation, and Heterogeneity and Robustness Analysis. Phase 1 involves data collection from 70 SCBs, including public and private sector banks, followed by descriptive statistics and correlation matrix analysis. Phase 2 includes panel data model selection, Hausman test, estimation of fixed effects and random effects models, post-estimation diagnostics, and re-estimation with robust standard errors to produce main results. Phase 3 focuses on sample classification, robustness checks, sub-sample analysis, and system GMM estimation, leading to heterogeneity analysis and robustness check results.

Methodological flowchart. Source: Authors

Figure 4
A flowchart illustrating the stages of a research methodology.The flowchart outlines a research methodology divided into three phases: Data Preparation and Preliminary Analysis, Main Model Estimation, and Heterogeneity and Robustness Analysis. Phase 1 involves data collection from 70 SCBs, including public and private sector banks, followed by descriptive statistics and correlation matrix analysis. Phase 2 includes panel data model selection, Hausman test, estimation of fixed effects and random effects models, post-estimation diagnostics, and re-estimation with robust standard errors to produce main results. Phase 3 focuses on sample classification, robustness checks, sub-sample analysis, and system GMM estimation, leading to heterogeneity analysis and robustness check results.

Methodological flowchart. Source: Authors

Close modal
Chart 1
A line graph showing the movement of ROA, CRAR, and asset size of SCBs during 2018 to 2023.A line graph with two lines representing the movement of ROA and CRAR of SCBs from 2017 to 2023. The x-axis represents the years from 2017 to 2023, and the y-axis on the left represents the percentage values ranging from negative 0.4 to 1.2 percent. The y-axis on the right represents the percentage values ranging from 0 to 20 percent. The blue line represents the ROA, which starts at approximately negative 0.2 percent in 2017, increases gradually, and reaches around 1.1 percent in 2023. The orange line represents the CRAR, which starts at approximately 0.6 percent in 2017, increases steadily, and reaches around 1.0 percent in 2023. The gray line represents the asset size, which remains relatively stable around 0.9 to 1.0 percent throughout the period. All values are approximated.

Movement of ROA, CRAR and asset size of SCBs during 2018–2023. Source: STRBI, RBI

Chart 1
A line graph showing the movement of ROA, CRAR, and asset size of SCBs during 2018 to 2023.A line graph with two lines representing the movement of ROA and CRAR of SCBs from 2017 to 2023. The x-axis represents the years from 2017 to 2023, and the y-axis on the left represents the percentage values ranging from negative 0.4 to 1.2 percent. The y-axis on the right represents the percentage values ranging from 0 to 20 percent. The blue line represents the ROA, which starts at approximately negative 0.2 percent in 2017, increases gradually, and reaches around 1.1 percent in 2023. The orange line represents the CRAR, which starts at approximately 0.6 percent in 2017, increases steadily, and reaches around 1.0 percent in 2023. The gray line represents the asset size, which remains relatively stable around 0.9 to 1.0 percent throughout the period. All values are approximated.

Movement of ROA, CRAR and asset size of SCBs during 2018–2023. Source: STRBI, RBI

Close modal
Chart 2
A line graph showing the movement of ROE, CRAR, and asset quality of SCBs during 2018 to 2023.A line graph displays the movement of ROE, CRAR, and asset quality of SCBs from 2018 to 2023. The x-axis represents the years from 2017 to 2023, while the y-axis represents the percentage values ranging from negative 20 to 80 percentage. The graph includes three data lines: ROE in blue, CRAR in orange, and asset quality in gray. The ROE line starts at a negative value around negative 10 percentage in 2017 to 2018, dips slightly in 2019 to 2020, and then rises steadily to around 10 percentage by 2023. The CRAR line remains relatively stable, starting just above 10 percentage in 2017 to 2018, and gradually increasing to around 15 percentage by 2023. The asset quality line starts at around 55 percentage in 2017 to 2018, shows a slight decline in 2019 to 2020, and then rises back to around 60 percentage by 2023. All values are approximated.

Movement of ROE, CRAR and asset quality of SCBs during 2018–2023. Source: STRBI, RBI

Chart 2
A line graph showing the movement of ROE, CRAR, and asset quality of SCBs during 2018 to 2023.A line graph displays the movement of ROE, CRAR, and asset quality of SCBs from 2018 to 2023. The x-axis represents the years from 2017 to 2023, while the y-axis represents the percentage values ranging from negative 20 to 80 percentage. The graph includes three data lines: ROE in blue, CRAR in orange, and asset quality in gray. The ROE line starts at a negative value around negative 10 percentage in 2017 to 2018, dips slightly in 2019 to 2020, and then rises steadily to around 10 percentage by 2023. The CRAR line remains relatively stable, starting just above 10 percentage in 2017 to 2018, and gradually increasing to around 15 percentage by 2023. The asset quality line starts at around 55 percentage in 2017 to 2018, shows a slight decline in 2019 to 2020, and then rises back to around 60 percentage by 2023. All values are approximated.

Movement of ROE, CRAR and asset quality of SCBs during 2018–2023. Source: STRBI, RBI

Close modal
Chart 3
A line graph showing the movement of RoA and expense income ratio of SCBs during 2018-2023.A line graph showing the movement of RoA and expense income ratio of SCBs during 2018-2023. The horizontal axis represents the years from 2017-18 to 2022-23. The left vertical axis represents the RoA in percent, ranging from -0.4 to 1.2 percent. The right vertical axis represents the expense income ratio in percent, ranging from 68 to 78 percent. The graph includes two data lines: one for RoA labeled in blue and another for expense income ratio labeled in orange. The RoA line starts at approximately -0.2 percent in 2017-18, increases steadily, and reaches around 1.0 percent by 2022-23. The expense income ratio line starts at around 0.9 percent in 2017-18, peaks at approximately 1.0 percent in 2018-19, and then declines to about 0.2 percent by 2022-23.

Movement of ROA and expense income ratio of SCBs during 2018–2023. Source: STRBI, RBI

Chart 3
A line graph showing the movement of RoA and expense income ratio of SCBs during 2018-2023.A line graph showing the movement of RoA and expense income ratio of SCBs during 2018-2023. The horizontal axis represents the years from 2017-18 to 2022-23. The left vertical axis represents the RoA in percent, ranging from -0.4 to 1.2 percent. The right vertical axis represents the expense income ratio in percent, ranging from 68 to 78 percent. The graph includes two data lines: one for RoA labeled in blue and another for expense income ratio labeled in orange. The RoA line starts at approximately -0.2 percent in 2017-18, increases steadily, and reaches around 1.0 percent by 2022-23. The expense income ratio line starts at around 0.9 percent in 2017-18, peaks at approximately 1.0 percent in 2018-19, and then declines to about 0.2 percent by 2022-23.

Movement of ROA and expense income ratio of SCBs during 2018–2023. Source: STRBI, RBI

Close modal
Chart 4
A line graph showing the movement of ROE and expense income ratio of SCBs during 2018 to 2023.A line graph showing the movement of ROE and expense income ratio of SCBs during 2018 to 2023. The x-axis represents the years from 2017 to 2023, while the left y-axis represents the percentage for ROE and the right y-axis represents the percentage for expense income ratio. The blue line represents ROE, and the orange line represents the expense income ratio. The data points for ROE are as follows: approximately 5 percent in 2017 to 2018, dropping to around negative 10 percent in 2019 to 2020, then rising sharply to around 5 percent in 2020 to 2021, and continuing to increase to approximately 7 percent in 2021 to 2023. The data points for the expense income ratio are approximately 72 percent in 2017 to 2018, increasing to around 76 percent in 2018 to 2019, then decreasing to around 70 percent in 2019 to 2020, and stabilizing around 72 percent from 2020 to 2023. All values are approximated.

Movement of ROE and expense income ratio of SCBs during 2018–2023. Source: STRBI, RBI

Chart 4
A line graph showing the movement of ROE and expense income ratio of SCBs during 2018 to 2023.A line graph showing the movement of ROE and expense income ratio of SCBs during 2018 to 2023. The x-axis represents the years from 2017 to 2023, while the left y-axis represents the percentage for ROE and the right y-axis represents the percentage for expense income ratio. The blue line represents ROE, and the orange line represents the expense income ratio. The data points for ROE are as follows: approximately 5 percent in 2017 to 2018, dropping to around negative 10 percent in 2019 to 2020, then rising sharply to around 5 percent in 2020 to 2021, and continuing to increase to approximately 7 percent in 2021 to 2023. The data points for the expense income ratio are approximately 72 percent in 2017 to 2018, increasing to around 76 percent in 2018 to 2019, then decreasing to around 70 percent in 2019 to 2020, and stabilizing around 72 percent from 2020 to 2023. All values are approximated.

Movement of ROE and expense income ratio of SCBs during 2018–2023. Source: STRBI, RBI

Close modal
Table 1

Summary of econometric diagnostic tests and methodological decisions

Diagnostic testPurposeResultMethodological decision
Levin-Lin-Chu (LLC) Panel Unit Root TestTo test for the stationarity of all variablesAll variables were found to be significant (p < 0.01)The variables are stationary at level
Variance Inflation Factor (VIF)To test for multicollinearity among regressorsMean VIF <5; Max VIF = 8.70 for InflationNo severe multicollinearity detected. Macroeconomic coefficients are to be interpreted with caution
Breusch-Pagan LM Test (Full Sample)To test between a Pooled OLS and a panel effects modelThe test was highly significant (p < 0.01)A panel effects model is required for the full sample
Hausman Test (Full Sample)To select between a Fixed Effects (FE) and Random Effects (RE) modelThe test was highly significant (p < 0.01)The Fixed Effects (FE) model is the consistent and appropriate estimator for the full sample analysis
Modified Wald TestTo test for groupwise heteroscedasticity in the FE modelThe test was highly significant (p < 0.01)Heteroscedasticity is present in the data
Wooldridge TestTo test for first-order autocorrelation in the FE modelThe test was highly significant (p < 0.01)Serial correlation is present in the data
Robust Estimation StrategyTo correct for heteroscedasticity and autocorrelationAll final regression models are estimated using clustered robust standard errors
Hausman/LM Tests (Subgroups)To select the most appropriate model for each of the 12 classified subgroupsTest results varied by subgroup; several were insignificantFor subgroups where the Hausman test was insignificant, a Random Effects (RE) or Pooled OLS model was chosen as the more efficient estimator
Source(s): Authors
Table 2

Descriptive statistics

VariablesMeanStdMinMaxMedian
Dependent variables
ROA (%)0.771.9−9.6217.860.75
ROE (%)2.9213.18−69.5938.474.82
Macroeconomic variables
GDP (%)4.64.91−5.839.056.62
INF (%)5.011.223.416.655.14
INT (%)9.770.977.9211.0910.21
EXCH (%)72.394.8864.4580.3672.56
Bank-specific variables
CRAR (%)29.6632.178.46287.9817.87
AQ (%)48.3816.950.2477.5453.24
DEP (%)64.0122.441.6792.5770.02
AS10.452.494.6515.5210.84
AM7.753.162.2535.817.42
EI72.7520.047.27250.7773.86
OFF1861.633849.9125,08673.00
Source(s): Authors
Table 3

Correlation matrix of key variables

VariableRoARoEGDPINFINTEXCHCRARAQDEPASAMEIOFF
ROA1            
ROE0.643***1           
GDP−0.028−0.0161          
INF0.161*0.273***−0.320***1         
INT−0.103−0.092−0.013−0.633***1        
EXCH0.161*0.263***−0.0670.893***−0.612***1       
CRAR0.185**0.060.030.009−0.130*0.0111      
AQ−0.242**−0.0780.051−0.1070.346***−0.095−0.348***1     
DEP−0.256**−0.103−0.0380.0310.122*0.022−0.595***0.572***1    
AS−0.171−0.09200.0640.0830.069−0.563***0.373***0.542***1   
AM0.410***0.091−0.028−0.0780.242***−0.0790.010.116−0.025−0.0651  
EI−0.623***−0.335***0.064−0.1040.098−0.078−0.0110.252***0.188**−0.018−0.1561 
OFF−0.129−0.1550.0020.008−0.0490.009−0.223***0.282***0.372***0.619***0.010.0651
Variance Inflation Factor (VIF) Values
   1.688.702.466.711.911.852.252.651.161.181.89

Note(s): ***: Significant at the 1% level (p < 0.01), **: Significant at the 5% level (p < 0.05), *: Significant at the 10% level (p < 0.10)

Source(s): Authors
Table 4

Model estimation result and summary for SCBs

Independent variablesDependent variable
ROAROE
EstimateStandard errorp-valueEstimateStandard errorp-value
CRAR0.01700.0053**0.12890.0503*
AQ0.00230.0099 0.20030.0932*
DEP0.01620.0088 0.09840.0827 
AS1.33490.2834***0.56222.6668 
AM0.43820.0377***0.02770.3545 
EI−0.02460.0051***−0.13930.0480**
OFF−0.00060.0002*−0.00990.0022***
GDP0.00400.0147 0.21020.1387 
INT−0.19990.1110 0.18781.0449 
EXCH0.00570.0288 0.14090.2711 
INF0.01150.1344 2.96041.2646*
R-square44.47%21.86%
Adjusted R-square31.37%3.42%
Observations420420
EffectFixedFixed

Note(s): Significance codes: ***p < 0.01, **p < 0.05, *p < 0.10

Source(s): Authors
Table 5

Model estimation result and summary for different bank groups

Independent variablesSCBs with higher off-balance sheet liabilities ratioSCBs with lower off-balance sheet liabilities ratio
Dependent variable
ROAROEROAROE
Estimatep-valueEstimatep-valueEstimatep-valueEstimatep-value
CRAR0.0268**0.3004***0.0108 0.0286 
AQ0.0151 0.1399 −0.0035 0.0834 
DEP0.0133 0.1406 −0.0041 0.0849 
AS0.1584 2.5159*1.7046***−1.7420**
AM−0.1481*−1.9879**0.5572***0.5955*
EI−0.0633***−0.2752***−0.0156*−0.1501***
OFF−0.0002 −0.0029**−0.0009**0.0003 
GDP0.0027 0.1223 0.0223 0.6114**
INT0.1228 2.3000 −0.2657 3.6040**
EXCH0.0882*0.4985 −0.0237 −0.2699 
INF−0.1477 0.9694 0.1676 7.3000***
R-square44.98%20.62%64.00%34.38%
Adj R-square41.93%16.21%54.12%30.74%
Observations210210210210
EffectRandomRandomFixedPooled
Independent variablesSCBs with higher profitability ratioSCBs with lower profitability ratio
Dependent variable
ROAROEROAROE
Estimatep-valueEstimatep-valueEstimatep-valueEstimatep-value
CRAR0.0180*0.0511 0.0023 −0.0185 
AQ−0.0068 0.0912 0.0061 0.0905 
DEP0.0317*0.1537*−0.0035 −0.0625 
AS1.6828***0.8962 −0.1078 −1.6920*
AM0.5393***0.4976 −0.0231 −0.5044 
EI−0.0403***−0.3871***−0.0399***−0.1309**
OFF−0.0008*−0.0019**0.0000 0.0003 
GDP0.0046 0.3471*0.0293 0.3022 
INT0.0661 2.3866*0.0282 2.1080 
EXCH−0.0102 −0.3939 0.0364 0.4634 
INF0.0789 4.8093**0.1501 3.2750 
R-square59.93%29.71%39.31%19.88%
Adj R-square48.94%2.6%35.94%15.43%
Observations210210210210
EffectFixedRandomPooledPooled
Independent variablesStronger SCBs (SCBs with lower NPA ratio)Weaker SCBs (SCBs with higher NPA ratio)
Dependent variable
ROAROEROAROE
Estimatep-valueEstimatep-valueEstimatep-valueEstimatep-value
CRAR0.0008 0.0648 0.1117***1.3052***
AQ0.0019 0.0746 0.0170 0.3988 
DEP−0.0206***−0.0177 0.0636***0.4498*
AS0.1378*6.8662***−0.1664 11.5386 
AM0.4170***0.8718***−0.1419 −2.9931**
EI−0.0333***−0.0374 −0.0860***−1.0261***
OFF−0.0001 0.0014 −0.0005 −0.0130***
GDP−0.0084 −0.0307 0.0142 0.0498 
INT−0.2623 0.3391 0.0044 −2.0751 
EXCH0.0062 −0.1512 0.0549 −0.0028 
INF0.0821 1.2917 −0.1462 0.2075 
R-square75.06%23.00%39.72%49.69%
Adj R-square73.68%1.87%23.18%35.89%
Observations210210210210
EffectPooledFixedFixedFixed
Independent variablesSCBs with higher lending to sensitive sectorSCBs with lower lending to sensitive sector
Dependent variable
ROAROEROAROE
Estimatep-valueEstimatep-valueEstimatep-valueEstimatep-value
CRAR0.0130 0.0448 0.0144 0.0695*
AQ0.0370*0.3047 −0.0220 −0.1281**
DEP0.0600***0.1802 0.0067 0.1512***
AS0.3763 −9.2862 1.8879***0.5575 
AM0.1102 −1.6977 0.4785***0.2420 
EI−0.0417***−0.1986 −0.0169*−0.1287***
OFF−0.0007**−0.0126***0.0001 0.0011 
GDP0.0247 0.3781 −0.0202 0.0886 
INT0.0152 −0.3994 −0.3172 0.1124 
EXCH0.0065 0.0828 0.0039 0.2625 
INF0.2708 5.6977**−0.3255 −0.6149 
R-square49.58%36.88%51.46%24.07%
Adj R-square35.74%19.56%38.14%19.85%
Observations210210210210
EffectFixedFixedFixedRandom
Independent variablesSCBs with higher business per employeeSCBs with lower business per employee
Dependent variable
ROAROEROAROE
Estimatep-valueEstimatep-valueEstimatep-valueEstimatep-value
CRAR0.0024 −0.0030 0.0169 0.1566*
AQ0.0096 −0.0177 −0.0160 0.3404**
DEP−0.0055 −0.0650 0.0555***0.0917 
AS0.0128 0.4303 1.7255***−1.1236 
AM0.0354 0.2604 0.5348***−0.0147 
EI−0.0492***−0.1154*−0.0230**−0.2830***
OFF0.0000 −0.0003 −0.0010**−0.0010 
GDP0.0111 0.2871 0.0098 0.1519 
INT0.1903 2.5463 −0.7016***−2.4195 
EXCH0.0169 −0.3241 0.0481 0.4563 
INF0.2118 5.8018***−0.1826 0.8666 
R-square56.57%20.34%55.89%27.50%
Adj R-square54.16%15.91%43.78%23.47%
Observations210210210210
EffectRandomRandomFixedRandom
Independent variablesSCBs with higher profit per employeeSCBs with lower profit per employee
Dependent variable
ROAROEROAROE
Estimatep-valueEstimatep-valueEstimatep-valueEstimatep-value
CRAR0.0176**0.0346 0.0339***0.1196 
AQ−0.0028 0.0366 0.0529***0.1722 
DEP0.0106 0.0199 0.0296 0.0767 
AS1.8673***0.8977 1.2760**−0.9078 
AM0.5623***0.4058 0.0160 0.0852 
EI−0.0258**−0.2202***−0.0272***−0.2292***
OFF0.0001 −0.0001 −0.0011***−0.0011*
GDP−0.0108 0.1597 0.0111 0.4206 
INT−0.0379 1.9968*−0.3769*0.5028 
EXCH−0.0213 0.0410 −0.0044 0.0781 
INF0.0400 2.7016*−0.0300 4.3570*
R-square61.17%23.62%44.34%29.82%
Adj R-square50.51%19.38%29.07%25.92%
Observations210210210210
EffectFixedRandomFixedPooled

Note(s): Significance codes: ***p < 0.01, **p < 0.05, *p < 0.10

Source(s): Authors
Table 6

Determinants of profitability of different groups of SCBs

Classification variableBank groupSignificant determinants for ROASignificant determinants for ROE
Off-balance sheet exposure to total liabilities ratioSCBs with higher off-balance sheet liabilities ratioCRAR (+), AM (−), EI (−), EXCH (+)CRAR (+), AS (+), AM (−), EI (−), OFF (−)
SCBs with lower off-balance sheet liabilities ratioAS (+), AM (+), EI (−), OFF (−)AS (−), AM (+), EI (−), GDP (+), INT (+), INF (+)
Net profit to total assets ratioSCBs with higher profitability ratioCRAR (+), DEP (+), AS (+), AM (+), EI (−), OFF (−)DEP (+), EI (−), OFF (−), GDP (+), INT (+), INF (+)
SCBs with lower profitability ratioEI (−)AS (−), EI (−)
Net NPA to Net advances ratioStronger SCBs (SCBs with lower NPA ratio)DEP (−), AS (+), AM (+), EI (−)AS (+), AM (+)
Weaker SCBs (SCBs with higher NPA ratio)CRAR (+), DEP (+), EI (−)CRAR (+), DEP (+), AM (−), EI (−), OFF (−)
Lending to sensitive sector as percent of total advancesSCBs with higher lending to sensitive sectorAQ (+), DEP (+), EI (−), OFF (−)OFF (−), INF (+)
SCBs with lower lending to sensitive sectorAS (+), AM (+), EI (−)CRAR (+), AQ (−), DEP (+), EI (−)
Business per employeeSCBs with higher business per employeeEI (−)EI (−), INF (+)
SCBs with lower business per employeeDEP (+), AS (+), AM (+), EI (−), OFF (−), INT (−)CRAR (+), AQ (+), EI (−)
Profit per employeeSCBs with higher profit per employeeCRAR (+), AS (+), AM (+), EI (−)INT (+), INF (+), EI (−)
SCBs with lower profit per employeeCRAR (+), AQ (+), AS (+), EI (−), OFF (−), INT (−)EI (−), OFF (−), INF (+)

Note(s): Sign in the parentheses denotes the sign of the coefficient of the determinant in the regression equation

Source(s): Authors
Table 7

Estimation results from system GMM estimation

Independent variable(1) ROA model (GMM)(2) ROE model (GMM)
Lagged Dependent Var. (L1.ROA/L1.ROE)0.324 (0.210)0.385*** (0.095)
CRAR0.015 (0.034)0.705 (0.507)
AQ−0.053 (0.092)−1.001 (0.973)
DEP0.066* (0.040)1.076 (1.169)
AS (log)−0.653 (1.661)14.141 (21.490)
AM0.218 (0.395)−1.150 (2.877)
EI−0.063 (0.045)−0.490 (0.466)
OFF0.001 (0.002)−0.010 (0.013)
GDP0.039 (0.061)−0.318 (0.680)
INF0.092 (0.666)−6.284 (5.977)
INT0.413 (0.960)2.130 (6.505)
EXCH0.061 (0.092)1.563 (1.135)
Observations350350
Number of Banks7070
Diagnostic Tests  
Hansen Test (p-value)0.90.205
AR(1) Test (p-value)0.0150.029
AR(2) Test (p-value)0.2630.659

Note(s): The table presents results from the two-step System GMM estimation with robust, corrected standard errors. The Hansen test is the preferred test for instrument validity due to the presence of heteroscedasticity. Standard errors are in parentheses. Significance codes: ***p < 0.01, **p < 0.05, *p < 0.10

Table 8

Robustness check results (domestic sub-sample only)

Comparison of ROA determinants (full sample vs domestic banks only)Comparison of ROE determinants (full sample vs domestic banks only)
Independent variable(1) Full sample (N = 70)(2) Domestic banks only (N = 33)Independent variable(1) Full sample (N = 70)(2) Domestic banks only (N = 33)
CoefficientCoefficientCoefficientCoefficient
CRAR0.0170**0.1614***CRAR0.1289*1.1955**
AQ0.00230.0528***AQ0.2003*0.7225**
DEP0.01620.0689***DEP0.09840.5530*
AS (log)1.3349***−0.6407AS (log)0.5622−11.8729
AM0.4382***−0.3905***AM0.0277−5.5983***
EI−0.0246***−0.0715***EI−0.1393**−1.0344***
OFF−0.0006*−0.0003OFF−0.0099***−0.0079
GDP0.0040.0076GDP0.2102−0.0272
INT−0.1999−0.0016INT0.1878−5.4480**
EXCH0.0057−0.0119EXCH0.1409−0.3232
INF0.01150.0619INF2.9604*2.1127
Observations420198Observations420198
Number of Banks7033Number of Banks7033
Within R-squared0.44470.6479Within R-squared0.21860.5377

Note(s): Significance codes: ***p < 0.01, **p < 0.05, *p < 0.10

Source(s): Authors

Supplements

Supplementary data

References

Abdelmoneim
,
Z.
, &
Yasser
,
M.
(
2023
).
The impact of bank performance and economic growth on bank profitability: Camel model application in middle-income countries
.
Banks and Bank Systems
,
18
(
3
),
205
220
. doi: .
Al-Harbi
,
A.
(
2019
).
The determinants of conventional banks profitability in developing and underdeveloped OIC countries
.
Journal of Economics, Finance and Administrative Science
,
24
(
47
),
4
28
. doi: .
Al-Homaidi
,
E. A.
,
Tabash
,
M. I.
,
Farhan
,
N. H. S.
,
Almaqtari
,
F. A.
, &
McMillan
,
D.
(
2018
).
Bank-specific and macro-economic determinants of profitability of Indian commercial banks: A panel data approach
.
Cogent Economics and Finance
,
6
(
1
),
1
26
. doi: .
Al-Homaidi
,
E. A.
,
Almaqtari
,
F. A.
,
Yahya
,
A. T.
, &
Khaled
,
A. S. D.
(
2020
).
Internal and external determinants of listed commercial banks’ profitability in India: Dynamic GMM approach
.
International Journal of Monetary Economics and Finance
,
13
(
1
),
34
67
. doi: .
Al-Qudah
,
A.
(
2020
).
Macroeconomic and bank-specific variables and the liquidity of Jordanian commercial banks
.
The Journal of Asian Finance, Economics and Business
,
7
(
12
),
85
93
. doi: .
Al-sadi
,
A.
(
2022
).
The impact of asset management on achieving bank profitability
.
Periodicals of Engineering and Natural Sciences (PEN)
,
10
(
5
),
5
13
.
Almaqtari
,
F. A.
,
Al-Homaidi
,
E. A.
,
Tabash
,
M. I.
, &
Farhan
,
N. H.
(
2019
).
The determinants of profitability of Indian commercial banks: A panel data approach
.
International Journal of Finance and Economics
,
24
(
1
),
168
185
. doi: .
Alshebmi
,
A. S.
,
Adam
,
M. H. M.
,
Mustafa
,
A. M. A.
,
Thomran
,
M.
, &
Fathelbab
,
O. E. A.
(
2020
).
Assessing the non-performing loans and their effect on banks profitability: Empirical evidence from the Saudi Arabia banking sector
.
International Journal of Innovation, Creativity and Change
,
11
(
8
),
2020
.
Available from:
 Link to the website
Apau
,
R.
, &
Sibindi
,
A. B.
(
2023
).
The effect of bank-specific dynamics on profitability under changing economic conditions: Evidence from Ghana
.
Banks and Bank Systems
,
18
(
4
),
169
180
. doi: .
Arellano
,
M.
, &
Bover
,
O.
(
1995
).
Another look at the instrumental variable estimation of error-components models
.
Journal of Econometrics
,
68
(
1
),
29
51
. doi: .
Arumugam
,
S.
, &
Jothikumar
,
J.
(
2017
).
Bank specific, industry specific and macro economic determinants of profitability of public sector banks in India: 2010-2016 a panel data approach
.
International Journal of Agricultural and Statistical Sciences
,
13
,
655
662
.
Assous
,
H. F.
(
2022
).
Prediction of banks efficiency using feature selection method: Comparison between selected machine learning models
.
Complexity
,
2022
(
1
), 3374489. doi: .
Avianto
,
W.
,
Siregar
,
H.
,
Ratnawati
,
A.
, &
Siregar
,
M. E.
(
2024
).
Analysis of valuation determinants of commercial banks with digital services in Indonesia
.
Revista de Gestão Social e Ambiental - RGSA
,
18
(
3
), e06570. doi: .
Bagh
,
T.
,
Hunjra
,
A. I.
,
Guo
,
Y.
, &
Bouri
,
E.
(
2025
).
Corporate capital structure in BRICS economies: An integrated analysis of ESG, firm, industry, and macroeconomic determinants
.
International Journal of Finance and Economics
,
30
(
3
),
2682
2704
. doi: .
Bain
,
J. S.
(
1951
).
Relation of profit rate to industry concentration: American manufacturing, 1936–1940
.
Quarterly Journal of Economics
,
65
(
3
),
293
324
. doi: .
Balani
,
H.
(
2019
).
Assessing the introduction of anti-money laundering regulations on bank stock valuation an empirical analysis
.
Journal of Money Laundering Control
,
22
(
1
),
76
88
. doi: .
Barakat
,
H. A.
,
Elwahab
,
S. A.
,
Yassin
,
N. M.
,
Ibrahim
,
S. M. M.
,
Ismail
,
M. H.
, &
Eldin
,
N. W. S.
(
2024
).
Asset quality and banks performance: A panel data analysis of commercial banks
.
Risk Governance and Control: Financial Markets and Institutions
,
14
(
3
),
111
. doi: .
Barua
,
R.
,
Roy
,
M.
, &
Raychaudhuri
,
A.
(
2016
).
Structure, conduct and performance analysis of Indian commercial banks
.
South Asian Journal of Macroeconomics and Public Finance
,
5
(
2
),
157
185
. doi: .
Belkhir
,
M.
,
Grira
,
J.
,
Hassan
,
M. K.
, &
Soumaré
,
I.
(
2019
).
Islamic banks and political risk: International evidence
.
The Quarterly Review of Economics and Finance
,
74
,
39
55
. doi: .
Berger
,
A. N.
(
1995
).
The profit-structure relationship in banking--tests of market-power and efficient-structure hypotheses
.
Journal of Money, Credit and Banking
,
27
(
2
),
404
431
. doi: .
Berger
,
A. N.
, &
Bouwman
,
C. H. S.
(
2009
).
Bank liquidity creation
.
The Review of Financial Studies
,
22
(
9
),
3779
3837
. doi: .
Bodla
,
B.
, &
Verma
,
R.
(
2011
).
Performance of scheduled commercial banks in India:- an application of D.E.A.
 
Decision - A Journal of IIM Calcutta
,
38
,
5
77
.
Borio
,
C.
, &
Lowe
,
P.
(
2002
).
Asset prices, financial and monetary stability: Exploring the nexus
.
Available from:
 Link to the website
Borio
,
C.
,
Gambacorta
,
L.
, &
Hofmann
,
B.
(
2017
).
The influence of monetary policy on bank profitability
.
International Finance
,
20
(
1
),
48
63
. doi: .
Bouhider
,
R.
(
2021
).
Econometric study of the effect of deposits on Islamic banks profitability: Evidence from Malaysia
.
Economics Bulletin
,
41
(
3
),
1292
1302
.
Available from:
 Link to the website
Breusch
,
T. S.
, &
Pagan
,
A. R.
(
1979
).
A simple test for heteroscedasticity and random coefficient variation
.
Econometrica
,
47
(
5
),
1287
1294
. doi: .
Brogi
,
M.
, &
Langone
,
R.
(
2015
).
Bank profitability and capital adequacy in the post-crisis context
.
Financial Crisis, Bank Behaviour and Credit Crunch
,
95
109
. doi: .
Chang
,
Y. L.
, &
Talley
,
D. A.
(
2016
).
Bank risk in a decade of low interest rates
.
Journal of Economics and Finance
,
41
(
3
),
505
528
. doi: .
Demsetz
,
H.
(
1973
).
Industry structure, market rivalry, and public policy
.
The Journal of Law and Economics
,
16
(
1
),
1
9
. doi: .
Available from:
 Link to the website
Desai
,
R.
(
2021
).
Impact of priority sector lending on financial profitability: Segment wise panel data analysis of Indian banks
.
Management and Accounting Review
,
20
(
1
),
19
37
. doi: .
Dhar
,
S.
, &
Bakshi
,
A.
(
2015
).
Determinants of loan losses of Indian banks: A panel study
.
Journal of Asia Business Studies
,
9
(
1
),
17
32
. doi: .
Di Febo
,
E.
, &
Angelini
,
E.
(
2022
).
The impact of Internet banking on performance and branches: Crisis or change in practice?
 
Global Business Review
. doi: .
Dietrich
,
A.
, &
Wanzenried
,
G.
(
2011
).
Determinants of bank profitability before and during the crisis: Evidence from Switzerland
.
Journal of International Financial Markets, Institutions and Money
,
21
(
3
),
307
327
. doi: .
Doǧan
,
M.
, &
Yildiz
,
F.
(
2023
).
Testing the factors that determine the profitability of banks with a dynamic approach: Evidence from Turkey
.
Journal of Central Banking Theory and Practice
,
12
(
1
),
225
248
. doi: .
Duong
,
T. M. P.
, &
Dang
,
V. D.
(
2023
).
Market structure and bank performance: A comprehensive picture of Vietnam
.
Banks and Bank Systems
,
18
(
3
),
74
86
. doi: .
Fajriana
,
R.
,
Roni
,
M.
,
Syamni
,
G.
,
Taniro
,
A.
, &
Saputra
,
J.
(
2021
).
Determinant factors that affect foreign banks profitability: An evidence from Indonesia
. In
Proceedings of the 11th Annual International Conference on Industrial Engineering and Operations Management Singapore
.
Available from:
 Link to the website
Fisher
,
I.
(
1930
).
The theory of interest as determined by impatience to spend income and opportunity to invest it
.
Macmillan
.
Available from:
 Link to the website
Flannery
,
M. J.
(
1981
).
Market interest rates and commercial bank profitability: An empirical investigation
.
The Journal of Finance
,
36
(
5
),
1085
1101
. doi: .
Gazi
,
M. A. I.
,
Nahiduzzaman
,
M.
,
Harymawan
,
I.
,
Al Masud
,
A.
, &
Dhar
,
B. K.
(
2022
).
Impact of COVID-19 on financial performance and profitability of banking sector in special reference to private commercial banks: Empirical evidence from Bangladesh
.
Sustainability
,
14
(
10
),
6260
. doi: .
Ghosh
,
S.
(
2016
).
Productivity, ownership and firm growth: Evidence from Indian banks
.
International Journal of Emerging Markets
,
11
(
4
),
607
631
. doi: .
Greene
,
W. H.
(
2008
).
Econometric analysis
.
Pearson/Prentice Hall
.
Available from:
 Link to the website
Gujarati
,
D. N.
, &
Porter
,
D. C.
(
2009
).
Basic econometrics
( (5th ed.) ).
New York
:
McGraw Hill
.
Available from:
 Link to the website
Gupta
,
N.
, &
Mahakud
,
J.
(
2020
).
Ownership, bank size, capitalization and bank performance: Evidence from India
.
Cogent Economics and Finance
,
8
(
1
), 1808282. doi: .
Hair
,
J. F.
,
Black
,
W. C.
, &
Babin
,
B. J.
(
2010
).
Multivariate data analysis: A global perspective
.
Pearson Education
.
Available from:
 Link to the website
Haron
,
R.
,
Nomran
,
N. M.
,
Abdullah Othman
,
A. H.
,
Md Husin
,
M.
, &
Sharofiddin
,
A.
(
2021
).
The influence of firm, industry and concentrated ownership on dynamic capital structure decision in emerging market
.
Journal of Asia Business Studies
,
15
(
5
),
689
709
. doi: .
Hausman
,
J. A.
(
1978
).
Specification tests in econometrics
.
Econometrica
,
46
(
6
),
1251
1271
. doi: .
Islam
,
M. S.
, &
Nishiyama
,
S. -I.
(
2016
).
The determinants of bank profitability: Dynamic panel evidence from South Asian countries
.
Journal of Applied Finance and Banking
,
6
(
3
),
1
6
.
Available from:
 Link to the website
Jensen
,
M. C.
, &
Meckling
,
W. H.
(
1976
).
Theory of the firm: Managerial behavior, agency costs and ownership structure
.
Journal of Financial Economics
,
3
(
4
),
305
360
. doi: ,
Available from:
 Link to the website
Keynes
,
J. M.
(
1937
).
The general theory of employment
.
The Quarterly Journal of Economics
,
51
(
2
),
209
223
. doi: .
Kolcunova
,
D.
, &
Havranek
,
T.
(
2018
).
Estimating the effective lower bound on the Czech national bank’s policy rate
.
Finance a Uver - Czech Journal of Economics and Finance
,
68
(
6
),
550
577
.
Available from:
 Link to the website
Kosumi
,
A.
, &
Zharku
,
L.
(
2024
).
Bank-specific, economic and legal determinants of profitability in the Republic of North Macedonia
.
Access to Justice in Eastern Europe
,
7
(
2
),
212
233
. doi: .
Kowalewski
,
O.
(
2023
).
Organizational mode choices of multinational banks abroad
.
Global Finance Journal
,
57
, 100863. doi: .
Kraus
,
A.
, &
Litzenberger
,
R. H.
(
1973
).
A state-preference model of optimal financial leverage
.
The Journal of Finance
,
28
(
4
),
911
922
. doi: .
Leibenstein
,
H.
(
1966
).
Allocative efficiency vs ‘X-efficiency.’
.
The American Economic Review
,
56
(
3
),
392
415
.
Available from:
 Link to the website
Lesche
,
T. F.
(
2021
). Too-big-to-fail in banking. In
Springer Gabler Wiesbaden, Finanzwirtschaft, Banken Und Bankmanagement I Finance, Banks and Bank Management
. doi: .
Liang
,
H. Y.
,
Ching
,
Y. P.
, &
Chan
,
K. C.
(
2013
).
Enhancing bank performance through branches or representative offices? Evidence from European banks
.
International Business Review
,
22
(
3
),
495
508
. doi: .
Maduane
,
R.
, &
Tsaurai
,
K.
(
2016
).
The link between capital structure and banking sector performance in an emerging economy
.
Risk Governance and Control: Financial Markets and Institutions
,
6
(
4-2
),
291
297
. doi: .
Maiti
,
A.
,
Kumar Jana
,
S.
, &
Kumar Jana
,
D.
(
2017
).
Determinants of profitability of banks in India: A panel data analysis
.
Scholars Journal of Economics, Business and Management
,
4
(
7
),
436
445
. doi: .
Mukherjee
,
S.
(
2019
).
Banks’ profitability and extent of their employee outlay nexus - an Indian perspective
.
Indian Journal of Finance
,
13
(
7
),
29
40
. doi: .
Naceur
,
S. B.
, &
Omran
,
M.
(
2011
).
The effects of bank regulations, competition, and financial reforms on banks’ performance
.
Emerging Markets Review
,
12
(
1
),
1
20
. doi: .
Neves
,
M. E.
,
Proença
,
C.
, &
Dias
,
A.
(
2020
).
Bank profitability and efficiency in Portugal and Spain: A non-linearity approach
.
Journal of Risk and Financial Management
,
13
(
11
),
284
. doi: .
Nguyen
,
J.
,
Parsons
,
R.
, &
Argyle
,
B.
(
2021
).
An examination of diversification on bank profitability and insolvency risk in 28 financially liberalized markets
.
Journal of Behavioral and Experimental Finance
,
29
, 100416. doi: .
Ozili
,
P. K.
(
2021
).
Bank profitability determinants: Comparing the United States, Nigeria and South Africa
.
International Journal of Banking and Finance
,
16
(
1
),
55
78
. doi: .
Pham
,
N. H.
,
Hoang
,
T. M.
, &
Pham
,
N. T. H.
(
2022
).
The impact of capital structure on bank profitability: Evidence from Vietnam
.
Cogent Business and Management
,
9
(
1
), 2096263. doi: .
Priharta
,
A.
, &
Gani
,
N. A.
(
2025
).
Credit risk and factors affecting profitability: Empirical evidence from Republic of Indonesia state-owned banks
.
Quality - Access to Success
,
26
(
207
),
161
. doi: .
Rawlin
,
R. S.
,
Ramachandran
,
S. R.
, &
Dev
,
K.
(
2023
).
Framework to optimize profitability of private sector banks in India
. In
ACM International Conference Proceeding Series
(pp. 
356
362
). doi: .
Razermera
,
T.
,
Brijlal
,
P.
, &
Jwara
,
N.
(
2024
).
The impact of risk management on banks’ profitability: A South African perspective
.
International Journal of Economics and Financial Issues
,
14
(
4
),
56
65
. doi: .
Saif-Alyousfi
,
A. Y. H.
(
2022
).
Determinants of bank profitability: Evidence from 47 Asian countries
.
Journal of Economic Studies
,
49
(
1
),
44
60
. doi: .
Salami
,
M. A.
,
Tanrivermiş
,
H.
,
Sarea
,
A. M.
, &
Tanrivermis
,
Y.
(
2023
). Evaluating the robustness of Basel capital accords to combat the effects of COVID-19 pandemic in Islamic banking. In
Islamic Accounting And Finance: A Handbook
(pp. 
745
775
). doi: .
Salike
,
N.
, &
Ao
,
B.
(
2018
).
Determinants of bank’s profitability: Role of poor asset quality in Asia
.
China Finance Review International
,
8
(
2
),
216
231
. doi: .
Sarpong-Kumankoma
,
E.
,
Abor
,
J.
,
Aboagye
,
A. Q. Q.
, &
Amidu
,
M.
(
2018
).
Differences in bank profit persistence in Sub-Saharan Africa
.
African Journal of Economic and Management Studies
,
9
(
4
),
512
522
. doi: .
Sayani
,
H.
,
Kishore
,
P.
, &
Kumar
,
V.
(
2017
).
Internal determinants of return on equity: Case of the UAE commercial banks
.
Banking and Finance Review
,
9
,
47
74
.
Sengupta
,
R.
, &
Vardhan
,
H.
(
2017
).
Non-performing assets in Indian Banks: This time it is different
.
Indira Gandhi Institute of Development Research
.
Mumbai Working Papers. Available from:
 Link to the website
Shehzad
,
C. T.
,
de Haan
,
J.
, &
Scholtens
,
B.
(
2013
).
The relationship between size, growth and profitability of commercial banks
.
Applied Economics
,
45
(
13
),
1751
1765
. doi: .
Song
,
X.
,
Cheng
,
D.
, &
Wu
,
R.
(
2019
).
Comparing the influence of green credit on commercial bank profitability in China and Abroad: Empirical test based on a dynamic panel system using GMM
.
International Journal of Financial Studies
,
7
(
4
),
64
. doi: .
Stančić
,
P.
,
Čupić
,
M.
, &
Obradović
,
V.
(
2014
).
Influence of board and ownership structure on bank profitability: Evidence from South East Europe
.
Economic Research-Ekonomska Istraživanja
,
27
(
1
),
573
589
. doi: .
Takahashi
,
F. L.
, &
Vasconcelos
,
M. R.
(
2024
).
Bank efficiency and undesirable output: An analysis of non-performing loans in the Brazilian banking sector
.
Finance Research Letters
,
59
, 104651. doi: .
Tecles
,
P. L.
, &
Tabak
,
B. M.
(
2010
).
Determinants of bank efficiency: The case of Brazil
.
European Journal of Operational Research
,
207
(
3
),
1587
1598
. doi: .
Trang
,
N. T. T.
,
Duong
,
N. T.
, &
Binh
,
P. N.
(
2024
).
The impact of asset-liability management on the profitability of listed commercial banks in Vietnam
.
International Journal of Economics and Financial Issues
,
14
(
6
),
369
378
. doi: .
Von Mises
,
L.
(
1953
).
The theory of money and credit
.
J. Cape
.
Available from:
 Link to the website
White
,
H.
(
1980
).
A heteroskedasticity-consistent covariance matrix estimator and a direct test for heteroskedasticity
.
Econometrica
,
48
(
4
),
817
. doi: .
Wooldridge
,
J. M.
(
2010
).
Econometric analysis of cross section and panel data
.
The MIT Press
.
Available from:
 Link to the website
Zopounidis
,
C.
, &
Kosmidou
,
K.
(
2008
).
The determinants of banks’ profits in Greece during the period of EU financial integration
.
Managerial Finance
,
34
(
3
),
146
159
. doi: .

Languages

or Create an Account

Close Modal
Close Modal