The paper aims to explore the use of an augmented reality assistance system to enhance safety in forklift operations by addressing visibility challenges caused by structural and load-induced obstructions. A user study validates the potential of see-through as a driver assistance system on forklifts, and highlights challenges in accuracy, latency and image quality.
The paper opted for a comprehensive user study with 18 participants. The tests were conducted while the forklift was not driving. Participants were allowed to elevate and incline the mast to evaluate the system’s performance. All participants answered 11 questions focusing on performance, usability and optimization. The questionnaire used an 11-point Likert scale (0: strongly disagree, 10: strongly agree) to quantify the personal opinions of the users. Depending on the hypotheses, one-sample or two-sample t-tests were carried out to evaluate the questionnaires.
The paper provides insight into the evaluation of an augmented reality-based driver assistance system for forklifts. The study identified latency and image quality as critical areas for improvement, essential for enhancing user acceptance and operational reliability.
Because of the restriction of the participants to a university environment and the fact that the user study was carried out while the vehicle was not driving, the research results may lack industrial transferability. For this reason, researchers should carry out further investigations in companies, for which considerable safety precautions are necessary.
This paper fulfills an identified need to study how the visibility problem on forklifts can be solved and thus increase safety in intralogistics.
1. Introduction
The economic growth has led to a substantial increase in the demand for in-plant material handling solutions. As the backbone of manual goods handling, forklifts play an essential role in intralogistics and further industries. Over the past few decades, the number of forklifts in operation within companies has increased. This rise in forklift traffic has led to an enhanced need for driver awareness of their surroundings, with the objective of preventing accidents and ensuring operational efficiency. However, the mechanical structure and operational characteristics of forklifts inherently restrict the ability of the operator to maintain complete awareness of the surrounding environment. Visibility is frequently obstructed by vehicle components and load, creating blind spots that pose a significant risk to safety.
In 2022, a total of 35,278 accidents involving forklifts occurred in Germany, with 19,758 specifically involving forklifts (Deutsche Gesetzliche Unfallversicherung e. V., 2023). These statistics underscore the urgent need for improved visibility solutions in forklift operations. Current systems typically use cameras to monitor concealed areas, displaying the feed on monitors within the driver’s cab. While these systems provide some level of assistance, they require the driver to divert his attention from the path of travel to the monitor, which can itself be a safety hazard. For example, drivers react on average 164 ms faster to peripheral warnings, in this case LED strips on the A-pillars of a forklift, than to warnings on a conventional display (vom Stein et al., 2018).
Augmented Reality (AR) technology offers another promising solution to this problem by enabling the direct overlay of a reconstructed scene onto the driver’s field of view (FoV). This allows drivers to observe obstructed areas while leaving clear areas untouched, thereby maintaining a seamless view of the real environment.
This research aims to explore the suitability of an AR-based assistance system specifically designed for forklifts. The system integrates multiple sensors for pose determination, RGB-D cameras for capturing the environment and a head-mounted display (HMD) for visualization. The primary goal of the system is to enhance driver’s visibility and reduce the risk of accidents due to blind spots. By combining these technologies, the AR system can dynamically present a real-time, perspective-corrected overlay that adapts to the driver’s movements and the vehicle’s position. Key performance indicators (KPIs) such as accuracy and latency are critical for ensuring the system’s effectiveness. Accuracy refers to the precise alignment of virtual overlays with the real world, while latency concerns the delay between real-world changes and their representation in the AR system. Both factors are essential for creating an immersive and reliable driver assistance system.
To validate the proposed system, we conducted a user study to assess its suitability and identify any challenges related to image quality, accuracy and latency. Participants included forklift operators and other potential users who evaluated the system’s performance under various scenarios.
The structure of this paper is as follows: Section 2 provides an overview of related work, focusing on existing user studies related to AR and see-through systems. Section 3 presents the results of our user study, highlighting the system’s functionality and user feedback. Finally, Section 4 concludes the paper with a discussion of findings and an outlook on future research directions.
2. Related work
The challenge of limited view due to objects within the human FoV has been a research focus since the 1970s. AR technology, first implemented by Sutherland (1968), offers a solution by allowing virtual, computer-generated information to be visualized within the operator’s FoV using various display technologies. Virtual elements can also obscure objects in the actual scene to augment real-world information. By overlaying occluded information onto view restrictions congruently, the observer is able to see through objects (Mori et al., 2017).
Evaluating usability using questionnaires is one of the most important tools for investigating AR systems (Santos et al., 2015). In the following text, we provide an overview of research activities in the field of user studies in AR in chronological order. Nilsson and Johansson conducted two qualitative user studies, where medical staff used AR systems to receive instructions for operating equipment and assembling surgical tools (Nilsson and Johansson, 2008). Participants were observed during the tasks and completed questionnaires on their experience. The study revealed that users found AR instructions clear, despite challenges like cumbersome hardware.
Reif et al. conducted a user study to evaluate a Pick-by-Vision AR system in a real warehouse environment (Reif et al., 2010). 16 participants completed order-picking tasks using both AR HMDs and traditional paper-based methods. Data was collected through time measurements and questionnaires, showing that AR reduced error rates but required a longer familiarization period.
Wintersberger et al. conducted two driving simulator studies to investigate the impact of AR on user trust and acceptance in fully automated vehicles (Wintersberger et al., 2018). In the first study, AR was used to augment traffic objects in low-visibility conditions (e.g. fog) through windshield displays, while the second study tested the effect of AR when users sat backwards, using HMDs to communicate upcoming driving maneuvers. They used both quantitative measurements and qualitative interviews to assess user responses.
Sadovitch studied that all errors such as latency and inaccuracy significantly reduce the system acceptance in automotive applications (Sadovitch, 2020). Preliminary studies focused on general error patterns and their perception on the basis of questionnaires based on standardized procedures, for example according to van der Laan et al. (1997) and Brooke (1996). The investigations of the developed system were carried out with the help of a specially developed questionnaire.
Quandt and Freitag conducted a systematic review of user acceptance in industrial AR applications, highlighting that despite technological advancements, AR solutions are not widely adopted in industrial practice (Quandt and Freitag, 2021). They identified key factors influencing user acceptance, such as usability, system ergonomics and user interface design.
Rohacz and Strassburger used a questionnaire with 91 participants from the automotive industry to assess AR acceptance in intralogistics planning (Rohacz and Strassburger, 2021). The study found that perceived usefulness and perceived ease of use significantly influence users’ intention to adopt AR in logistics planning.
Papakostas et al. examined AR integration in welding training (Papakostas et al., 2023). Using a modified Technology Acceptance Model (TAM), they identified system quality and ease of use as key factors in AR adoption.
Hussain et al. created the Augmented Reality Sickness Questionnaire (ARSQ) by adapting the existing Simulator Sickness Questionnaire (SSQ) to better capture motion sickness in AR environments (Hussain et al., 2023). A high correlation was found between the results of the ARSQ and the SSQ. The advantage of the new method lies in the small number of items and therefore greater efficiency and effectiveness.
Maio et al. conducted two user studies to assess AR in logistics tasks (Maio et al., 2023). The first study, with 26 participants, gathered qualitative feedback using HMD and Handheld Devices (HHDs). The second study involved 10 participants completing tasks under paper, HMD and HHD conditions. Data from observations and post-task questionnaires revealed a preference for HMDs due to hands-free operation and better task efficiency.
Windhausen et al. conducted two empirical studies to assess the impact of AR smart glasses on worker well-being during order-picking tasks (Windhausen et al., 2024). The first study involved performance metrics, where participants used AR smart glasses to improve speed and accuracy in picking tasks. The second study focused on psychological well-being, using questionnaires to measure job satisfaction and stress levels. The results indicated improvements in task efficiency but mixed effects on worker satisfaction, depending on the individual’s familiarity with the technology.
Sabeti et al. conducted five experiments using both controlled outdoor environments and virtual reality settings to evaluate the effectiveness of AR safety warnings in roadway work zones (Sabeti et al., 2024). The researchers measured worker reaction times using the Simple Reaction Time (SRT) method and vision-based pose tracking. Participants were exposed to different combinations of multimodal AR warnings (visual, auditory and haptic) to determine which combination yielded the quickest response times, with haptic-visual warnings showing the best results.
There are few user studies in the field of AR assistance systems for forklifts. Günthner et al. show that even simple AR functionalities, such as the display of the fork position in counterbalanced forklifts, simplify positioning during load handling (Günthner, 2015). Despite a slightly longer handling time, the system increases precision by visualizing the fork position and mast alignment during operation. Sarupuri et al. investigated the potential of AR to increase operator performance in pallet racking and pick up tasks (Sarupuri et al., 2016). They used a tele-operated miniature forklift within the experiments and evaluated quantitative performance measurements as well as a questionnaire.
Prior research has focused on the acceptance of AR technology in general, few studies focused on the subtopic acceptance of see-through applications. Van Amersfoorth et al. demonstrated that increased translucency reduces average driver reaction time (van Amersfoorth et al., 2019). A driving simulator was used for this by varying the translucency of a vehicle in front and measuring the reaction time for breaking. Lindemann and Rigoll examined the effects of a transparent cockpit on driving performance in a simulator both qualitatively via a questionnaire (Lindemann and Rigoll, 2017a) and quantitatively based on the deviation from an ideal line (Lindemann and Rigoll, 2017b). There were eight participants for this study. In addition, Lindemann et al. further explored the influence of different projection methods in a simulated overtaking scenario (Lindemann et al., 2019). The study comprised 24 participants and used a questionnaire based on the TAM.
Yasuda and Ohama investigated the influence of different levels of visualization by asking 10 participants in a simulated environment whether or not an accident would occur at an actual hidden intersection (Yasuda and Ohama, 2012). In addition to the quantitative evaluation of the results, a Likert scale (Likert, 1932) was used to assess how helpful the form of visualization was. Plopski et al. tested various visualization modes, such as highlighting the outline of occluded objects, for a robot manipulation application with three participants (Plopski et al., 2019).
Prior user studies for driver assistance see-through systems have mainly been carried out in the automotive sector. The intralogistics environment shows special requirements and challenges compared to road traffic. The user moves large loads that lead to large view restrictions. There are narrow travel paths, monotonous scenes and poor lighting conditions. In contrast to applications from the automotive sector, the cameras for recording the environment can move relative to each other and relative to the view restrictions. In addition, there is the challenge of dynamically changing view restrictions. Accordingly, there is a need to conduct a user study to assess the acceptance of AR-based driver assistance see-through systems for forklifts.
3. User study
To evaluate the proposed AR assistance system for forklifts, we conducted a comprehensive user study. This study aimed to assess the system’s performance from the perspective of actual and potential users, focusing on accuracy and latency, overall usability and areas for improvement. The following sections provide an in-depth look at the see-through system, participant demographics, research questions, hypotheses, the questionnaire, scenarios performed during the study, results and discussion.
3.1 See-through system for forklifts
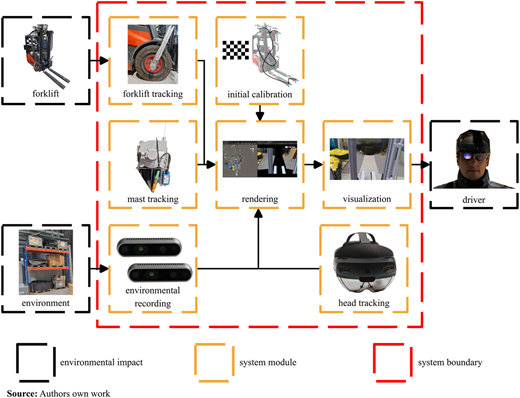
Our proposed AR assistance system for forklifts aims to eliminate view restrictions by integrating multiple sensors, RGB-D cameras and a HMD. Figure 1 shows the schematic overview of our system.
For environmental recording, we use a set of RGB-D cameras strategically positioned on the forklift. The cameras on the mast are oriented to capture the area behind the load, while additional cameras on the forks provide data during storage and retrieval operations in the rack. This multi-camera setup ensures comprehensive environmental coverage, allowing the system to reconstruct the occluded scene accurately.
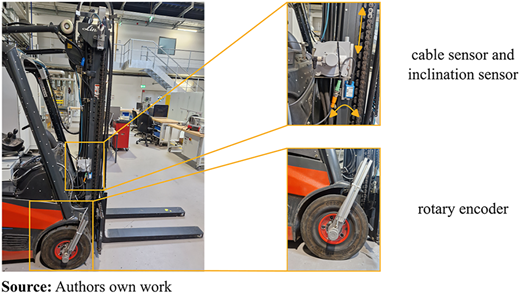
We employ a hybrid tracking approach that combines inside-out tracking from the HoloLens 2 with external sensors mounted on the forklift. The method addresses the challenges posed by the dynamic movements of both the vehicle and the operator. This results in a complete digital twin of the forklift and driver as a unit regarding their geometric relationship. Rotary encoders (resolution of 0.056 mm per pulse) are attached to the forklift’s front wheels, providing precise measurements of the distance traveled based on wheel rotations. We use the two-wheel model proposed by Dudek and Jenkin (2000) to calculate the forklift’s trajectory. An analog inclination sensor mounted on the side of the fork carriage provides a resolution of 0.05° and a static measurement accuracy of ±0.3°. An analog cable sensor measures the lift height, achieving an accuracy of ±1 cm and a repeatability of ±1.5 mm. These sensors’ data are processed and transmitted to a PC via an asynchronous socket, which forwards the data to the Unity application for further processing. Figure 2 shows the mounting positions of the sensors required for complete localization of the vehicle and operator.
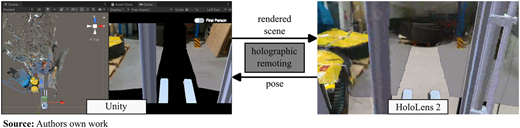
The rendering process in our system is depicted in Figure 3. Camera information is merged with the initial calibration and position sensor data in the Unity application running on an industrial PC. The PC handles the computationally intensive rendering, generating a perspective-corrected image that is sent to the HoloLens 2 via holographic remoting. This approach minimizes the processing load on the HMD.
The HoloLens 2 continuously sends its position data to the PC, which updates the rendered image to reflect the operator’s current view. This dynamic interaction between the HMD and the PC enables the AR system to provide an immersive and accurate overlay, enhancing the operator’s ability to see through view restrictions.
3.2 Demographics
A total of 18 individuals participated in this study. Their ages ranged from 21 to 58 years, with an average age of 35.33 years (median: 30.5 years) and a standard deviation of 11.11 years. Among the participants, 61% reported using vision aids, and 39% had a forklift license. Among the owners of forklift licenses, the frequency of use varied, with 43% using it “a few times a month”, 14% using it “once a week” and 43% using it “several times a week”. Notably, 61% of the participants had never used AR or virtual reality (VR) applications before, and only one participant used such applications several times a week.
3.3 Research questions
Research shows that inaccuracy and latency can affect the acceptance of AR assistance systems by operators (Sadovitch, 2020; Moser, 2014; Yang and Zhang, 2022). In initial preliminary investigations, we were able to quantitatively describe the errors that occur (Overmeyer et al., 2023) by developing various measurement methods and adapting them to the application of our see-through system (Jütte et al., 2022, 2023). These investigations were carried out independently of the operator, as the human eye was simulated by a camera. Based on this, the following research questions aim to investigate the relationship between the quantitative measurement data of the errors, the perception of these errors by the operators and the resulting acceptance of the system:
How is the accuracy of the overlay evaluated in different scenarios?
How is the quality of the overlay evaluated?
How is the current and future usefulness of the system assessed?
What needs to be improved in the system?
Which external factors influence the evaluation of the assistance system?
3.4 Hypotheses
The following hypotheses are based on the above research questions:
The overlay accurately aligns when the system is stationary.
The alignment of the overlay degrades when the mast is in motion.
The overlay’s accuracy further decreases with movement in the hidden scene.
Image quality is insufficient, making it particularly difficult to recognize hidden individuals.
The system demonstrates good color fidelity.
In its current form, the system proves unhelpful.
Optimizing the system could enhance its usefulness.
Reducing latency is the key aspect for optimization, while increasing accuracy and improving image quality are of lesser importance.
The possession of a forklift license has no influence on the evaluation.
The need for a visual aid has no influence on the evaluation.
The age of the participants has no influence on the evaluation.
3.5 Questionnaire
The questionnaire aimed to evaluate the spatial and temporal deviations prevailing in our system from the user’s perspective. All participants answered 11 questions focusing on performance, usability and optimization. An expert from a leading forklift manufacturer helped develop the questions to ensure relevance to the usability of assistance systems. The questionnaire used an 11-point Likert scale (0: strongly disagree, 10: strongly agree) to quantify the personal opinions of the users. We used pre-formulated statements for the different topics. The questionnaire was administered in German. The translated statements are shown in Table 1.
3.6 Scenarios performed in the study
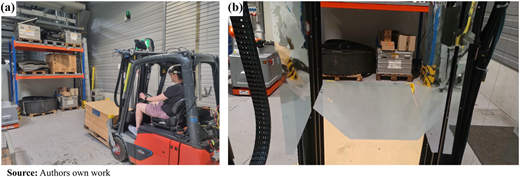
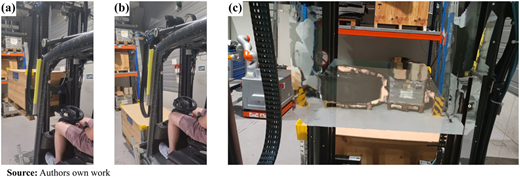
Due to the need for a forklift license for operation and safety regulations, the tests were conducted while the forklift was not driving. Participants were allowed to elevate and incline the mast to evaluate the system’s performance. The view restrictions were simulated using a standard EPAL-pallet with a wooden frame, ensuring that there was a significant view restriction while allowing the participants to compare the real and augmented views. The size of the load was 800 mm x 1,200 mm × 800 mm. At the start, the user took a seat in the forklift and put on the HMD. Next, to confirm the system’s functionality, the user verified that the overlay was operational and approximately in the right position. Following that, the user was instructed to inspect the cabin and turn the head as if the HMD did not exist. After a brief period, questions relating to S1-S3 were posed to the user. Figure 4a shows the external view during this baseline scenario on the left. Figure 4b shows a frame captured from the HMD during the baseline scenario.
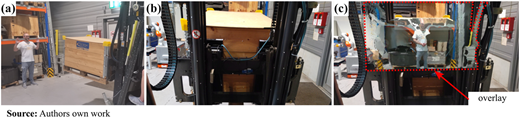
In the lift mast scenario the user was instructed to move the lift mast upward at full speed (0.5 m/s upwards, 0.58 m/s downwards). For this purpose, the user operated a joystick in the vehicle. Then S4 was answered. Figures 5a and b show the downward movement of the lift mast from the view outside the forklift. Figure 5c shows the frame captured from the HMD where the maximum deviation between the overlay of the load and the real load during the movement occurs.
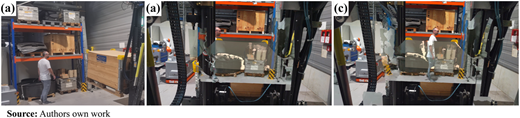
Figure 6a shows the setup during the “standing person” scenario. The operator raised the load to a height where a person in front of the forklift was not visible without the system, as shown in Figure 6b. Then S5 was answered. Figure 6c shows a frame of the HMD during the person standing scenario on the right.
Figure 7a shows the setup during the “crossing person” scenario on the left. The operator lowered the load in comparison to the previous setup so that only the head of the moving person was visible in reality, as shown in Figure 7b. This allowed users to directly see the discrepancy between the overlay and the reality resulting from the latency of the cameras, as shown in Figure 7c. Then S6 was answered. Finally, users evaluated the statements S7–S11 without wearing the HMD.
3.7 Results
We evaluated the hypotheses using the t-test. For H1–H8 we used a one-sided one-sample t-test to evaluate whether ratings were significantly higher or lower than a certain value. For most hypotheses we used the neutral value of 5, the midpoint of the 0–10 Likert scale (0 = strongly disagree, 10 = strongly agree) as a comparative value. For hypotheses H2, H3 and H8, we used the mean value of the evaluation of other statements as a comparative value, as the hypotheses were structured relative to other statements. Whether the t-test was performed on the left or right side depended on the formulation of the hypotheses. To test hypotheses H9 to H11, a significance analysis was carried.
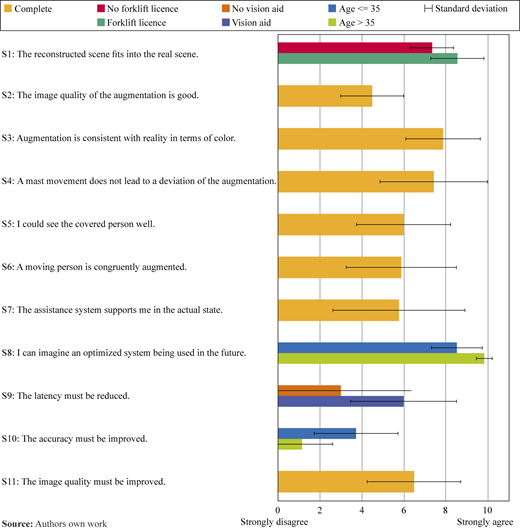
To evaluate H1 we conducted a right-sided t-test for S1 against the neutral value of 5. S1 received strong positive ratings (mean = 7.833, SD = 1.249), indicating that users perceived this feature as performing significantly above neutral expectations (t(17) = 9.628, right-sided p < 0.001). H1 can therefore be confirmed. To evaluate H2, we performed a left-sided t-test of S4 – S1 against 0, to take individual ratings into account. S4 received strong positive ratings as well (mean = 7.444, SD = 2.572). The t-test shows no significance that users rate the accuracy of the display worse when the mast is raised than when it is stationary (t(17) = −0.626, left-sided p = 0.270). H2 is therefore rejected. To evaluate H3, we performed a left-sided t-test of S6 – S1 against 0. S6 was rated neutral on average by users (mean = 5.889, SD = 2.632), indicating that users rate the accuracy of the display significantly worse when there is movement in the scene than when the mast is moving (t(17) = −2.995, left-sided p = 0.004). H3 is thus confirmed.
To evaluate H4 we first conducted a left-sided t-test for S2 and then for S5 against the neutral value of 5. Participants were neutral about the image quality (S2: mean = 4.500, SD = 1.505). The t-test (t(17) = −1.410, left-sided p = 0.088) indicates no significance that the image quality is rated worse than neutral. Participants slightly agreed they could see a covered person well (S5: mean = 6.000, SD = 2.249). The t-test (t(17) = 1.886, left-sided p = 0.962) suggests that there is no significance that this aspect was rated above the midpoint. H4 can therefore be rejected.
The color match of the insertion with reality was highly rated (S3: mean = 7.889, SD = 1.779), showing clear satisfaction in this area (t(17) = 6.891, right-sided p < 0.001). H5 can therefore be confirmed. The perceived helpfulness of the assistance system was rated neutral (S7: mean = 5.778, SD = 3.154), the t-test indicates no significance of users rating the system as unhelpful compared to neutral (t(17) = 1.046, left-sided p = 0.845), rebutting H6. Conversely, participants strongly agreed that an optimized system could be used for view restriction compensation (S8: mean = 9.056, SD = 1.162), with the t-statistic indicating this was rated far above neutral (t(17) = 14.811, right-sided p < 0.001). H7 can therefore be confirmed.
The participants demonstrated a neutral position on the necessity to reduce latency (S9: mean = 4.833, SD = 3.167) and a consensus that image quality must be enhanced (S11: mean = 6.500, SD = 2.229). They were opposed to the necessity of reducing spatial deviation (S10: mean = 2.722, SD = 2.191). To evaluate H8 we performed a right-sided t-test of S9 – S10 against 0. The t-test shows that the participants rate the need to reduce latency significantly higher than the need to reduce geometric deviation (t(17) = 2.998, right-sided p = 0.004). In contrast, the right-sided t-test of S9 – S11 against 0 shows that there is no significance that the participants see a greater need to reduce latency than to increase image quality (t(17) = −1.898, right-sided p = 0.963). H8 is therefore rejected.
A significance analysis was carried out to test hypotheses H9 to H11. For this purpose, Levene’s test, a significance test for the homogeneity of variances, was first carried out. If the p-value of Levene’s test is less than 0.05, it can be assumed that there is a significant difference between the variances of the distribution. The results are summarized in Table 2. As all values are above 0.05, a two-sample t-test was then carried out. The results of the two-sample t-test are summarized in Table 3.
The analysis revealed a significant difference in the “forklift license” group for the statement “The reconstructed scene fits well into the real scene” (S1). The p-value is 0.041, which is below the 0.05 threshold. This indicates a significant difference in the ratings between participants with and without a forklift license. The t-value is 2.220. Individuals with a forklift license rate the alignment of the reconstructed scene at standstill more positively as individuals without a forklift license. The lowest p-value of 0.088 (S5) is above the 0.05 threshold. Therefore, H9 can be partially rejected. The possession of a forklift license had an influence on the evaluation of one statement.
The analysis revealed a significant difference in the “vision aid” group for the statement “The latency must be reduced” (S9). The p-value is 0.046 and the t-value is 2.160. This indicates a significant difference in the ratings between participants with and without a vision aid. Specifically, individuals with a vision aid are more convinced that the accuracy must be improved (S9: mean = 6.000, SD = 2.530) compared to those without a vision aid (S9: mean = 3.000, SD = 3.367). For the other statements, the p-values are above the 0.05 threshold, indicating no significant differences between the groups. Therefore, H10 can be partially rejected. The need for a visual aid had an influence on the evaluation of one statement.
For the “age ( ≤ 35)” group, a few p-values are below the 0.05 threshold, indicating significant differences for some statements. Notably, statements S8 (p = 0.014) and S10 (p = 0.010) have p-values well below the threshold, indicating significant perceptual differences between participants aged 35 or younger (S8: mean = 8.545, SD = 1.214; S10: mean = 3.727, SD = 2.005) and those older than 35 (S8: mean = 9.857, SD = 0.378; S10: mean = 1.143, SD = 1.464). Younger individuals were less likely to imagine an optimized system being used in the future and more likely to agree on the necessity of reducing spatial deviation. For the remaining statements, the p-values are above the threshold, indicating no significant age-related differences. Therefore, H11 can be partially rejected. Age significantly impacted two of the eleven statements.
Figure 8 summarizes the results of the performance, usability and optimization evaluation of the system. For the statements for which there are no significant differences between the groups in the evaluation (S2–S7 and S11), the mean value and the standard deviation across all groups are shown. As there are significant differences in S8 and S10 between people who are 35 years or younger or older than 35, the mean value and standard deviation are shown individually for this group. The same applies to S1 with regard to forklift license, and S9 with regard to vision aid.
3.8 Discussion
Regarding the accuracy of the overlay (RQ1), participants generally agreed that the accuracy of the overlay was satisfactory, both with and without mast movement. However, they were neutral regarding the congruence of a overlayed person in motion. As for the quality of the overlay (RQ2), participants agreed that the color fidelity of the overlay matched reality. The evaluation of image quality yielded neutral responses, indicating neither strong approval nor disapproval. Regarding the system’s current usability (RQ3), participants’ opinions were neutral, with a high standard deviation suggesting uncertainty about the system’s immediate usefulness. However, there was strong agreement that an optimized version could be highly beneficial. In terms of system improvements (RQ4), image quality was identified as a critical area needing enhancement, with participants slightly agreeing on this point. Opinions were neutral regarding the necessity of reducing latency, and there was the least agreement on the need to reduce spatial deviation.
Future research should prioritize improving image quality. Since the average agreement on the congruence of a moving person was lower than the agreement on the minor deviation caused by mast movement, reducing camera recording latency should be prioritized over mast tracking. External factors influencing the assessment (RQ5) revealed that the need for visual aids had a significant impact on the evaluation of the need for improvements regarding latency. Individuals with a vision aid are more likely to rate the necessity for improvements regarding latency higher. Possessing a forklift license did influence the assessment, with licensed operators being more likely to rate the fit of the reconstructed scene higher. Younger participants ( ≤ 35) were more critical about the system’s future usability and more likely to agree on the necessity to reduce geometric deviations than older participants.
Additionally, it is important to acknowledge the limitations of our current study, particularly the sample size of the user study. Future studies should include larger sample sizes to verify the robustness of these findings and explore potential trends in more detail. They should also be carried out with moving forklifts, which means that only test persons with a forklift license would be able to participate. However, this goes hand in hand with very high requirements to ensure safety during the tests. This was not possible in the university environment. The element of surprise should also be investigated. For example, it could be investigated whether the test subjects see a person in front of the forklift or not. Another field of investigation is the different forms of visualization and the possibility for the user to switch between them. For example, although it is beneficial to be able to see through the load when driving, it must at least be possible to see the contour of the load when storing and retrieving. Here, for example, the use of a voice control can be compared with a virtual or physical button.
4. Conclusion and outlook
This study illustrates the potential of AR technology as a viable assistance system for forklift operations, specifically to address the view restrictions inherent to such machinery. We investigated a system that integrates multiple RGB-D cameras, external sensors and a HMD to create a real-time, perspective-corrected overlay, enabling operators to see through view restrictions. The conducted study indicates that while the system performs adequately in terms of color consistency and accuracy when stationary, challenges remain in accuracy during movement and image quality, particularly for identifying individuals behind view restrictions. Participants expressed cautious optimism about the system’s potential, recognizing significant value in a more refined version. The study identified latency and image quality as critical areas for improvement, essential for enhancing user acceptance and operational reliability. Looking ahead, several key areas will guide the future development of this AR-based assistance system.
First, efforts will be concentrated on optimizing latency and image quality. Reducing latency involves minimizing delays in camera data acquisition and processing, which could be achieved by implementing more efficient algorithms and leveraging faster processing hardware. Enhancing image quality requires improving the resolution and clarity of augmented images, possibly through the incorporation of higher-resolution cameras and advanced rendering techniques to provide clearer and more detailed overlays.
Second, enhancing tracking systems is crucial. Developing sophisticated tracking algorithms that can differentiate between vehicle movement and operator head movement will be essential. Advanced machine learning techniques and additional sensors may improve tracking accuracy. Ensuring accurate and real-time registration between virtual and real objects, especially during forklift movement, will enhance the system’s usability and safety.
Third, adopting a user-centric design approach will be essential. Continuously integrating feedback from forklift operators will further refine the system. Conducting extensive user studies with diverse participant groups will help identify specific user needs and preferences. Simplifying the user interface and ensuring that the AR system is intuitive and easy to use will promote wider adoption, including optimizing the HMD fit and comfort for long-term use.
Lastly, scalability and practical implementation must be considered. Collaborating with industry partners to pilot the AR system in real-world environments will provide valuable insights into practical implementation. This collaboration could also facilitate the development of industry standards and best practices for AR-assisted forklift operations. Balancing technological advancements with cost considerations will be crucial to make the system economically viable for widespread adoption in logistics and material handling sectors.
In addition, qualitative methods such as interviews or focus groups could be used to gain a deeper understanding of the user experience and identify the specific needs and expectations of different user groups. This would not only contribute to the improvement of AR systems but also increase their acceptance and usefulness in different application areas.
Funding: This work is part of the research project 20158 N of the Research Foundation Intralogistics/Material Handling and Logistics (IFL) and has been funded by the AiF within the program for sponsorship by Industrial Joint Research (IGF) of the German Federal Ministry of Economic Affairs and Climate Action based on enactment of the German Parliament.
Data availability: The datasets generated during and/or analyzed during the current study are available from the corresponding author on reasonable request.
Declaration of conflicting interests: The authors have no competing interests to declare that are relevant to the content of this article.
Ethical statement: Ethics review board clearance was not required for this study because the collected data, while including demographic information such as age and vision aid requirements, was entirely anonymized. No identifying personal information (e.g. names, contact details or unique identifiers) was collected, and the data cannot be traced back to individual participants. The study was conducted in a university environment, focusing on users’ interactions with a system. All participants were informed about the nature and purpose of the research and voluntarily consented to participate. Data was gathered solely to analyze system usability and was reported in aggregate form, ensuring privacy and confidentiality.