The ability to replicate global supply chain (SC) structures is important for maintaining and improving the operations of global SCs. This structure, while known to specific manufacturers and key suppliers, is not generally published and may not be totally transparent to all stakeholders. This paper presents a methodology for replicating the structure of global SCs with limited, publicly available data.
The proposed SC replication method decomposes the multi-echelon SC into a set of duo-echelon models, each focused on a single commodity, which are reconstituted for a complete representation of the SC for improved computational efficiency. Flows of raw materials, middle products (product components) and end-products for each duo-echelon model are obtained from a developed stacked machine learning method using only publicly available information. The duo-echelon models are integrated into a final multi-echelon, multi-commodity SC representation.
The method was applied to a case study of lithium-ion battery production. The findings underscore the model’s capability to capture complex trade relationships and global SC dynamics. Further, the method outperformed numerous other approaches.
This paper proposes a novel approach to estimating global SC structures, including complexities from their multi-commodity and multi-echelon nature, using publicly available data.
1. Introduction and motivation
The ability to replicate global supply chain (SC) structures is important for maintaining and improving the operations of global SCs. This structure, while known to specific manufacturers and key suppliers, is not generally published and may not be totally transparent to all stakeholders. For some products, the SC structure is complex, as it often relies on raw material suppliers and middle product manufacturers that serve more than one company and product type. This paper presents a method for replicating a SC and estimating key material flows given publicly available information, specifically total demand, Customs, Insurance and Freight (CIF) prices and the Industrial Production Index (IPI).
The proposed SC replication method uses a concept from stacked machine learning (ML) to replicate the flows of raw materials, middle products (product components) and end-products within a SC. The method begins with the study of flows between importers and exporters within the SC. This is completed by decomposing the SC by the importer for each material and middle or end product. For each importer, ML techniques of random forest (RF) and elastic net (ElNet) are trained and used to estimate the flow of materials and products from the importer to potential exporters. Outcomes of RF and ElNet are blended through a stacked model that takes as input the output of the individual RF and ElNet models in a second RF meta-model. Such a meta-model approach is known to enhance predictive accuracy (Bassiouni et al., 2024). The outcome of this stage is a set of trained duo-echelon, importer-based models that can be used to predict future trade flows to exporters given demand and transport price forecasts.
To reconstitute the larger multi-echelon SC network from these components, the duo-echelon, importer-based models are reintegrated, accumulating the flows received from exporters at each importer. After training the duo-echelon models and reconstituting the full multi-echelon SC network, flows can be predicted given predictions of CIF, IPI and the demand for the final material values. CIFs are used to account for the costs associated with importing goods, which affects flow predictions, while IPIs reflect industrial activity levels influencing material demand and production.
The resulting multi-echelon SC network captures the effects of external factors that affect demand on materials flows across a SC beginning with the raw materials and ending with the final products. If an importer country reduces imports from an exporter country, that exporter will need to produce less, decreasing its demand for inputs from the suppliers in the next echelon. The model captures such changes through flow balance at each node, ensuring that the propagation of the effects of demand changes in one echelon are reflected across the SC network.
The resulting multi-echelon, multi-commodity stacked ML model’s effectiveness in replicating a global SC and its flows is demonstrated on a case study of lithium-ion battery (LIB) production, an important element in electric vehicle (EV) batteries. EV batteries are key enablers for transitioning the automotive industry toward a sustainable future. Also in the case study, the method’s effectiveness was compared against alternative potential ML methods of Gradient Boosting (XGBoost), Support Vector Regression (SVR), k-Nearest Neighbors (KNN), Long Short-Term Memory (LSTM) networks and a hybrid model that weights the outcomes of RF and ElNet to create a single amalgamated outcome.
A review of existing methods for modeling SCs with limited information in support of such a study is provided in the next section. Section 3 presents the proposed multi-echelon, multi-commodity SC modeling methodology. Application to the LIB case study and validation of the model are presented in Section 4. The case study illustrates the utility of the proposed methodology and demonstrates its superior performance in comparison to the most relevant gravity-based approach from prior literature. The paper concludes in Section 5 with a discussion of contributions, limitations and extensions.
2. Literature review
Network flow pattern prediction (or estimation), and thus depicting the existing network, has been proposed for modeling air transport (e.g. Mueller, 2023), transit (e.g. Lei et al., 2022), maritime shipping (e.g. Shibuya and Shibasaki, 2023), social networks (e.g. Daud et al., 2020), biological (e.g. Koutrouli et al., 2020) networks and more.
The majority of the network flow pattern prediction works employ one of three methods to depict flows in transportation networks: (1) complex network theory, (2) gravity models and (3) ML models. Ge et al. (2022) utilized complex network theory to analyze port and shipping route networks, revealing structural motifs, such as bypassing and hubbing. In contrast, Gu et al. (2021) applied a gravity model to predict trade patterns in diverse transportation networks, emphasizing factors like distance and economic indicators. Mueller (2023) employed an ML approach with recurrent neural networks (RNNs) to forecast changes in air transport networks over time, demonstrating strengths in temporal predictions. These methodologies contribute to understanding transportation network structure. However, they do not capture that SCs are multi-echelon with dependencies between hierarchies.
Numerous works have developed models for depicting the structure of a SC using publicly available or purchased data. Almost all of these works consider bilateral trade. They generally differ in terms of commodity type, which affects model parameters and predictions. De Benedictis and Taglioni (2011) developed a gravity model to predict total merchandise bilateral trade value between two countries. They modified a general gravity model by adding characteristics, such as whether they share a common language, if they border one another and gross domestic product (GDP). Wohl and Kennedy (2018) embedded neural networks in a similar modeling approach and used features as identified in De Benedictis and Taglioni (2011) to improve predictions of total bilateral import and export trade value for the United States of America (USA). This method was used by others to predict bilateral import and export trade value for other countries, e.g. for Croatia (Jošić and Žmuk, 2022) and China (Dumor and Yao, 2019).
A drawback of these methods is that they use aggregated annual data related to goods movements, especially GDP, and overlook industry-specific influences, including varying regulatory requirements and technological advancements. Cetorelli and Goldberg (2011) and Asprilla et al. (2019) argued for a shift towards more granular, firm-level data and highlight the limitations of depending on traditional economic indicators, such as GDP, distance and a common language. Their work emphasizes the need to incorporate specific features rather than aggregate variables to better understand trade dynamics. Similarly, Gopinath et al. (2014) suggested using industry-level inputs, such as IPI, as an industrial output metric. To address this need, the approach proposed herein takes monthly industry-level metrics, including IPI and CIF, as input. These metrics are product-class specific and capture market effects from changing technologies.
Recent studies have explored ML methods for forecasting material demand and global container throughput – important elements of SCs. For instance, Guo and Mai (2024) used a transformer-based deep learning methodology to forecast rare earth export prices for China. Similarly, Kulshrestha et al. (2024) proposed a multivariate deep learning-based decomposition and ensemble framework to forecast container throughput at the Port of Singapore. They showed significant improvement in forecasting accuracy over traditional econometric approaches. Machine learning predictions can be combined with optimization methods, as demonstrated in Momenitabar et al. (2023). Momenitabar et al. (2023) applied machine learning for demand forecasting and integrated it with a mixed-integer linear programming optimization model for bioethanol SC design.
Other works replicate a unique material’s SC using alternative methods. Nummelin and Hänninen (2016) employed ML techniques, including support vector machines, neural networks and RF, to forecast global bilateral Finnish soft-sawn wood trade by value. This work was extended by Morland et al. (2025), who applied gravity models and artificial neural networks to predict bilateral trade flows for a range of wood-based products across 200 countries. In the boron ore trade, Zhu et al. (2023) employed complex network theory to reveal trends, patterns and future competition scenarios as a function of resource endowment and complex network features (e.g. centrality and betweenness). Their proposed methodologies focus on trade relationships for a single commodity or single raw material. Thus, they need only consider one echelon (a single intermediate or final product or a single material). They also overlook the broader dynamics of competition among exporters and importers within the SC. By analyzing separate trade pairs and only a single echelon, these approaches fail to account for the affects across different echelons and entities of the SC. For example, the material prices in one echelon can influence production and distribution capabilities in higher echelons. Neglecting these interactions inhibits the understanding of how demand fluctuations and transportation costs, for example, can impact the flow of materials and products.
A number of works have developed methods for investigating the restructuring impacts of changing conditions on SC structure. This includes, for example, impacts from increased production capacity (e.g. Acar et al., 2010; Hajibabai and Ouyang, 2013; Chen et al., 2023), disaster events (e.g. Carvalho et al., 2012; Beiki et al., 2020; Zokaee et al., 2021), the COVID-19 pandemic (e.g. Paul and Chowdhury, 2020; Queiroz et al., 2022) and significant price uncertainty (e.g. Abdel-Basset et al., 2020; Mosallanezhad et al., 2021). Most of these works use a stochastic optimization methodology to replicate the SC and how it restructures in the face of such changes. This class of methods requires predefined parameters, such as production capacities and supply and demand distributions. These parameters can be difficult to obtain or estimate due to dependencies on uncertain and fluctuating factors, such as product design changes. Others implemented simulation (e.g. Carvalho et al., 2012) and deterministic methods (e.g. Paul and Chowdhury, 2020) for similar applications. Simulation-based methods suffer from the same issues as do the stochastic modeling methods. Deterministic methods are generally overly simplistic and make assumptions that result in erroneous outcomes. A data-driven methodology that exploits publicly available data sources, along with prediction, as proposed herein, can capture the underlying relations between elements of the SC into the future.
Table 1 categorizes the most relevant works that have proposed methods for developing global SC representations and flow estimates from publicly available data and contrasts these works with this paper. None of these five works is multi-echelon and, therefore, their methods can only replicate simple structures with a single material or product flow. The three that are specific to SCs use annual, country-level data as the key inputs. The latter two works employ finer-level data but aim to replicate air transport and transit networks. These two works provided insights for the developments here.
3. Material and product flow estimation methodology
Multioutput hybrid (for comparison) and stacked ML methods for estimating material and product flows in global SCs are presented in this section. These methods are comprised of three key steps: (1) network representation through decomposition, (2) flow computation and (3) network reconstitution.
3.1 Constructing the SC’s network representation
Constructing an accurate network representation of a SC is critical in understanding the effects of changing conditions on SC structure. This section provides a methodology for network representation construction based on publicly available information.
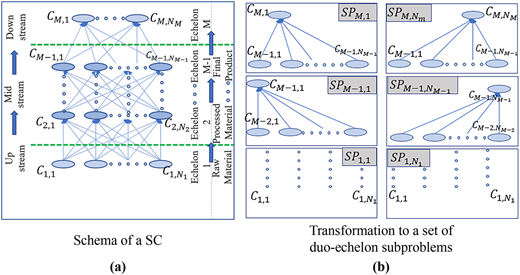
To create the network representation, the flows of materials and products across or between echelons for countries with significant, relevant bilateral trade relationships are modeled (Figure 1a). In prior literature, the flows across each bilateral trade relationship were studied separately. These earlier representations can only capture single-echelon trade activities, thereby omitting portions of the SC and ignoring important contributors to trade flow changes, such as prices in one echelon affecting demand in another echelon. In contrast, herein, multiple echelons are modeled together, capturing how changes in price or demand at one level affect similar quantities in other levels and offering a more complete view of the SC.
Let represent a country involved in trade in echelon as depicted in Figure 1a. In this setup, the uppermost echelon (e.g. where ) includes raw material producers, while the next echelon down (e.g. ) comprises countries that import raw materials and export processed materials. This naming convention continues down through each echelon until the lowest echelon, represented by (), which includes countries importing the final product. Note that the higher the number, the lower the echelon. Moreover, upstream, midstream and downstream levels are defined to coincide with the uppermost, middle and lowermost echelons, respectively.
As depicted in Figure 1b, an importer country at any given echelon can be paired with multiple exporter countries from an upstream, higher-level echelon (lower numerically), e.g. is paired with exporter countries forming individual “subproblems” (denoted as in Figure 1b). Each subproblem represents an importer and all relevant exporters of all commodities of concern at the next highest echelon in the SC hierarchy. This approach, which decomposes the SC into subproblems for each importer and its relevant exporters, enables the analysis of interconnected trade flows across multiple echelons while maintaining computational efficiency. Unlike traditional methods that typically pair countries one-to-one, this method considers the broader network of trade relationships and their dependencies. The resulting set of detailed, duo-echelon subproblems can later be reconfigured into a comprehensive, multi-echelon network by sequentially combining subproblems and adjusting flow balances at each echelon to ensure consistency in relationships throughout the SC.
Decomposition in SC modeling has been successfully used in many past works. Simchi-Levi and Zhao (2011) reviewed methodologies for controlling inventory in general supply networks under uncertainty and highlighted decomposition as a framework for understanding these networks. Gallego and Zipkin (1999) decomposed SCs into single-stage systems to determine lead-time demand, while Zhao and Simchi-levi (2006) broke down multi-product assembly-to-order SCs into single-product subsystems to calculate demand lead times. Similarly, Bhaskar and Lallement (2010) modeled SCs as a set of queueing networks to find minimum response times for processing orders and fulfilling customer demands. The work herein differs in that it decomposes the SC by each importer, allowing for the analysis of interconnected trade flows across levels, rather than isolating them into single echelons as is often the approach. In the next subsection, ML methods are proposed for computing flows in each duo-echelon subproblem for completion of Step 2.
3.2 Flow computation by hybrid and stacked ML method
Stacked and hybrid ML methods are presented for estimating the flows of raw materials (upstream), intermediate products (midstream) and end-products (downstream) within each SC subproblem given total demand volumes, CIF, IPI and flows, all of which are available publicly and are updated monthly with some delays.
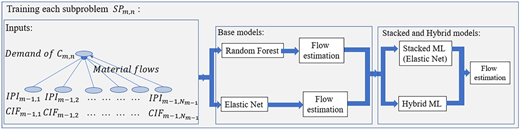
For each such subproblem , two multioutput ML techniques are trained: RF and ElNet algorithms (Figure 2). The former supports nonlinear relationships and extensive dataset interactions (Breiman, 2001), while the latter is known for its regularization properties and ability to manage high-dimensional data with multicollinearity (Zou and Hastie, 2005). This was useful in this study because RF captures complex patterns in trade flows that may not be evident in simpler models, while ElNet effectively handles the large number of features and potential correlations between economic indicators, like IPI, CIF, and demand. These models are trained using input data comprised of IPI, CIF and demand volumes of the importer countries. The outputs of these models are the estimated flows of raw materials, intermediate products and end products within the subproblem.
Each machine learning model uses a set of monthly data for each exporter and importer pair. The input features include (1) CIF price (United States Dollars per ton (USD/ton)), (2) industrial production index (IPI) of the exporting country and (3) total demand from the importing country for the specific material. The output is the predicted monthly trade flow (in tons) from the exporter to the importer. The RF model uses 100 regression trees for each forest and is trained to minimize the mean squared error, allowing the model to detect nonlinear patterns and interactions between the input features. The ElNet model is trained using five-fold cross-validation. It combines L1 (Lasso) and L2 (Ridge) regularization to avoid overfitting and to handle correlation among the input features.
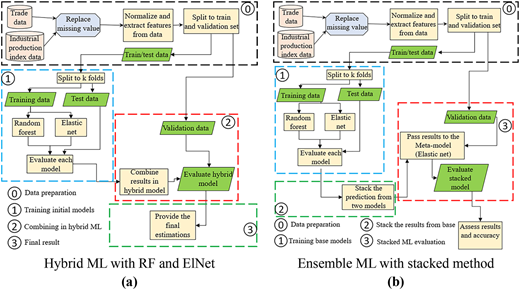
Predictions obtained from these two models are amalgamated in a hybrid ML method as depicted in Figure 3a to enhance predictive accuracy. This fusion of predictions is implemented through a weighted averaging mechanism via Equation (1).
where and are the predictions from the RF and ElNet models, respectively, and α is a weight between 0 and 1.
A second ensemble learning method, a stacked ML method, was also implemented. It is depicted in Figure 3b. Introduced in Wolpert (1992), this technique blends the predictions of multiple base models. In this study, predictions from the RF and ElNet models are combined and used as input into a larger ElNet meta-model to derive a composite prediction.
The stacking process involves two levels: base models and a meta-model. The base models (RF and ElNet) first generate out-of-fold predictions through cross-validation. These predictions are used as input features to train a second-level meta-model, a second ElNet, which learns how to optimally weight the base model outputs to minimize prediction error. The meta-model corrects biases in the base models and improves model generalization, allowing wide applicability.
Various combinations of common ML models were tested for their accuracy as both base and meta-models. These included RF, ElNet, XGBoost, SVR, KNN and LSTM networks. Among these, the combination that yielded the greatest accuracy in flow estimates, as compared with real-world data, involved using RF and ElNet models as base models, with ElNet also serving as the meta-model. Using the same model type in both the base and meta-model has been explored previously, such as in Sill et al. (2009).
Figure 3a illustrates the steps of the hybrid approach that uses a direct weighted average of RF and ElNet predictions. Figure 3b describes how the stacked model forms a two-stage learning system, where the base model outputs are passed as input to a meta-model for final flow volume prediction. This methodology combines complementary strengths of the base models for improved prediction capabilities.
To reduce the risk of overfitting and enhance the consistency and accuracy of flow estimation predictions produced by the models, a number of techniques were employed. The hybrid and stacked ML-based methods for flow estimation were utilized to reduce overfitting. Hybrid methods integrate predictions from multiple models to capture diverse patterns, while stacked methods combine base model predictions into a meta-model for more refined outcomes. In addition, cross-validation was employed to ensure a comprehensive evaluation of base model performance across different subsets of the dataset using key metrics, such as root mean squared error (RMSE), R-squared and mean absolute percentage error (MAPE). Cross-validation helps in assessing how well the model generalizes to unseen data by training and validating the model on various data splits. Also, the final results from hybrid and stacked ML models were tested against a portion of data that was not used in training.
Once the ML models are trained for each of the individual subproblems, the subproblems can be integrated into a comprehensive multi-echelon SC network in Step 3 as described next. Implementation-specific details, including software versions and libraries used for model development, are provided in Appendix A.
3.3 Reconstituting the SC network
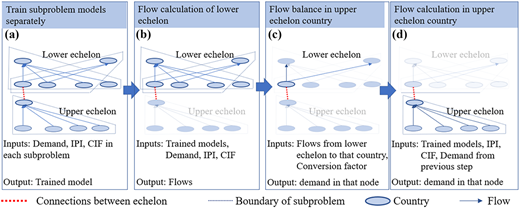
After the models for each importer-based subproblem are trained (Figure 4a), the multi-echelon SC network is reassembled. Assembly starts with the subproblems of the importer countries in the lowest echelon (with the highest number). The demand volumes of each importer and associated CIFs and IPIs (Figure 4b) must be extracted (Figure 4b).
Each lower echelon exporter becomes an importer in the next higher echelon, with demand volume adjusted to ensure flow balance across countries (Figure 4c). This process continues through all echelons until the highest echelon countries (raw material importers) are integrated (Figure 4d). At each echelon, the flow is strictly directional from exporters at a lower echelon to importers at the next higher echelon. It means that the movement of goods or materials in the network always goes upward through the echelons (from raw material producers to intermediate processors to final product importers) without looping back. Thus, the unidirectional nature of flow through the SC from raw material producers through processing and finally to end-product importers is captured.
In reassembly, subproblem outputs are recombined based on flow conservation rules, ensuring consistency of flow volumes across echelons and preserving the validity of model predictions. This process of assembling the SC network using the trained models can be adapted to various types of inputs (e.g. lower-level subproblem demands and IPI and CIF values related to all subproblems). By using actual input values from the most recent year in the dataset, the model can simulate the base case flows in the network for that year. Once this baseline is established, adjustments to inputs allow for the simulation of different scenarios, making it possible to explore how shifts in demand, IPI or CIF might impact flow estimates across the entire SC network.
4. Application to the LIB SC
Rapid growth in global demand for EVs continues to increase (Miao et al., 2022; Gnanavendan et al., 2024) and has led to a sharp surge in demand for materials, such as lithium (Miao et al., 2022), that are vital to EV production. There are several types of EV batteries on the market, including, for example, nickel-metal hydride and LIBs. This study focuses on LIBs, which are widely used in EVs and have more than 50% of the market share (Pesaran et al., 2023). LIBs were selected as the focus of this illustration due to their important role in the production of EVs. LIBs have high energy storage capacity, and their use in EVs is only expected to grow. According to forecasts by the IEA, BloombergNEF and Allied Market Research, global demand for LIBs is projected to increase more than fivefold by 2035, and this expected growth exceeds that of any other battery type (Allied Market Research, 2023; International Energy Agency (IEA), 2024). In response, many governments are advancing strategies to expand LIB production and adoption (Shepardson, 2024).
Understanding the LIB SC is essential in planning EV production and distribution strategies for the future. These factors support the relevance of LIBs as a case study for evaluating potential disruptions and shifts in global trade logistics.
In this section, a case study of LIB production is completed. The case study demonstrates the effectiveness of the proposed SC replication methodology and employs the methodology for the LIB application. Its outcomes are compared with those from the most relevant methodology from prior literature, i.e. a gravity modeling approach.
4.1 Data for model input
4.1.1 LIB SC structure with commodity flows
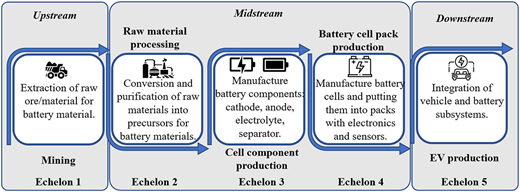
The LIB SC is comprised of five key echelons (Figure 5). The process begins with the mining of essential minerals in the upstream echelon. Once extracted from the earth, the raw materials are refined through raw material processing. Then, battery cell components, such as electrodes and separators, are produced, and battery cells are assembled into packs. These all occur in the midstream echelon. The battery cell packs are integrated into EVs during their assembly in the downstream echelon (Yang et al., 2022). Additional details of the materials involved in LIB production are provided in Appendix B.
4.1.2 LIB SC flows
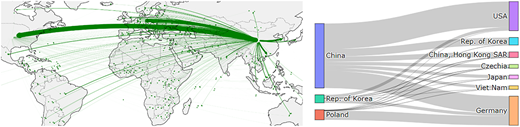
The proposed hybrid and stacked ML methods were applied to estimate the material flows within the LIB SC using the UN COMTRADE dataset for a timeframe that spanning from 2017 to 2023. This dataset provides monthly trade information between countries. The dataset includes essential details, such as net weight of trade and CIF. As depicted in Figure 6, Germany and the USA emerge as the leading importers of these batteries, while China, Korea and Poland produce enough to meet their domestic needs and export the rest. Germany and the USA are, thus, considered downstream or lower-echelon countries.
Identifying Germany and the USA as downstream or lower-echelon, importer countries is important in the model, as it sets the starting point for mapping the countries to different echelons. The modeling process begins with the primary LIB importers at the lower level, and from there, connects them to exporters in the next echelon. This approach allows the systematic mapping of the entire network of countries involved in the LIB SC.
For each subproblem, the top exporter countries that collectively account for 80% of total net weight imports for the importer country are included in the SC representation. For example, in the case of Germany in the lowest echelon, the top six trading partners (China, Poland, the Rep. of Korea, Hungary, the Czech Republic and Japan) collectively contribute to approximately 80% of the net weight of Germany’s total imports. These countries’ characteristics (such as net weight import, CIF and IPI) are included as features of the ML models.
4.2 Data sources
Flows in the network, which refer to the movement of materials between countries as imports and exports (e.g. LIB and raw lithium), along with CIF values and demand for materials (the total import requirements of a lower-echelon importer country within each subproblem), were extracted from the UN COMTRADE portal, while IPI values for each country were extracted from the International Monetary Fund (IMF) Website. The UN COMTRADE dataset covers the period from January 2017 to December 2023 and was utilized for modeling, as weight details are only available starting from January 2017. About 70% of the data was used for training, while the remaining 30% was employed in validation.
Note that IPI is a country-level relative measure that references a base period. Direct comparison of values between two countries can be misleading. For example, in 2023, Norway had an average IPI of approximately 98, while Ireland’s was roughly 256, even though Norway is generally thought to be more industrialized. This is because Ireland’s production increased more than its base year than did Norway’s levels. This indicates that IPI is a better indicator of change than absolute industrial strength.
To prepare data for the models, monthly bilateral trade data were provided in terms of weight (tons/month) and CIF value (USD/ton). Trade volumes with annual volumes of less than 100 kg were excluded to improve data quality by removing negligible transactions that are statistically insignificant, prone to reporting errors and may introduce noise to the model. Total demand for each lower echelon importer country in a subproblem (tons/month) was calculated by summing all imports of the specific material in that subproblem (e.g. raw lithium or processed lithium) from those upper echelon exporter countries that collectively account for 80% of the total imports. To facilitate model processing, total net volume demand weights were scaled by .
While the COMTRADE and IMF datasets provide valuable and publicly accessible information, both are subject to known limitations. COMTRADE data is subject to reporting inconsistencies, delays in availability and misclassification. IMF IPI data often do not fully reflect informal economic activity or short-term structural changes (e.g. short-term tariffs). To mitigate these issues, the analysis focused on high-volume trade relationships and applied thresholds to exclude low-volume outliers. To further enhance the robustness of predictive results, cross-validation was employed in model training.
4.3 Model evaluation and results
4.3.1 Accuracy of different types of decomposition
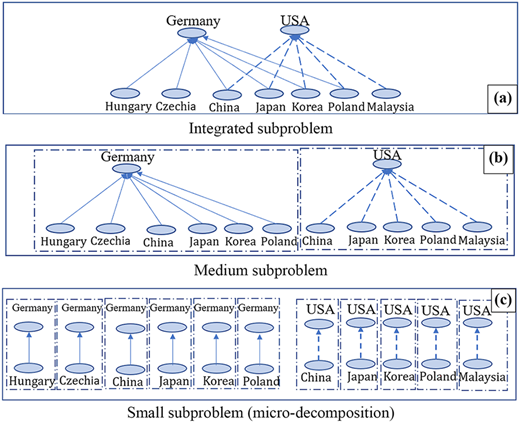
To demonstrate the effectiveness of decomposition in SC analysis, this section focuses on the downstream subproblems of the LIB SC, specifically examining the USA and Germany as major importers of LIB. Together, these countries account for 80% of the overall demand for LIB import. To find the optimal balance between accuracy (measured by R-squared MAPE and RMSE) and interpretability, this section evaluates three types of decomposition using the stacked ML method introduced in Section 3: (1) integrated (Figure 7a), (2) medium (the level of the composition used in this paper (Figure 7b)) and (3) small or micro-decomposition (Figure 7c) subproblems.
The first model, the integrated subproblem, represented in Figure 7a, integrates all relevant features into a single subproblem, specifically the CIF of exporters (e.g. Hungary, Czechia, China, Japan, Korea, Poland and Malaysia), the IPI of both importers (e.g. the USA and Germany) and exporters and the demand for LIB from importers. This holistic approach encompasses flows between multiple importers in one echelon and their exporters within a single model, enabling predictions of global LIB trade flows.
In contrast, the decomposition presented in Figure 7b, the medium subproblem, takes a more segmented approach. Here, the analysis is divided into subproblems, each involving a single importer (either the USA or Germany) and related multiple exporters. This allows for a more focused examination of the trade flows associated with each importer. Unlike the integrated model, the features considered in each subproblem are limited to the participating countries, ensuring that data is not transferred across subproblems.
For an even finer analysis, Figure 7c, a small subproblem, demonstrates the use of micro-decomposition. In this approach, trade flows between each importer-exporter pair are modeled independently. While this method allows for precise tailoring of ML models for specific relationships, it sacrifices some accuracy, because it cannot account for interactions between countries, such as shifts in supply or demand that might impact trade volumes across multiple partners.
The ultimate goal is to identify a decomposition level that provides both accurate predictions and interpretable results. Table 2 presents the prediction accuracy of the stacked ML method (introduced in Section 3) across each decomposition type.
The results in Table 2 reveal that the integrated subproblem demonstrates superior performance compared to small and medium subproblem models. This is attributed to its holistic approach, which includes all importers within a single model and accounts for competition among all countries through, for example, shifts in trade volumes. A drawback of this method is that as the number of countries increase, the model grows substantially in size and complexity. For instance, with 25 importers and 25 exporters in battery cell and processed lithium echelons, respectively, the model must predict 625 flows (one for each importer-exporter pair). Each flow is associated with 625 CIF values (one for each pair), 50 IPI values (25 for importers and 25 for exporters) and 25 demand values (one for each importer). This leads to over 1,300 data points per month. This high volume of data makes the model computationally challenging to solve and difficult to interpret, as having numerous countries and features complicate the process of isolating the effects of individual factors on specific trade flows.
The medium subproblem offers acceptable accuracy and yields more interpretable results. By focusing on individual importers and their primary exporters, it makes it easier to interpret how specific features impact trade flows within each subproblem, as interactions are limited to a smaller set of trading partners. On the other hand, the small subproblem, which examines each importer–exporter pair independently, exhibits the lowest accuracy due to its failure to capture broader interactions across the network.
4.3.2 Accuracy of base and meta-models
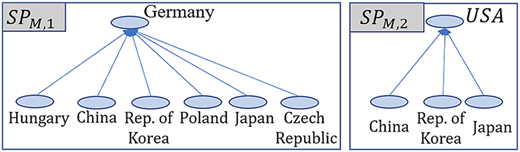
The accuracy of the tested ML models applied to the LIB import subproblems for Germany, the USA and the next upper echelon of LIB exporters (i.e. battery cell importers), which are responsible for exporting battery cells and components, is investigated. Figure 8 illustrates the decomposition of subproblems at the lowest echelon of the SC, specifically showing how the primary LIB importers (Germany and the USA) are connected to their respective top exporters. While the previous section assessed accuracy across the various decomposition strategies, this section focuses specifically on the predictive performance of each individual duo-echelon model of each subproblem.
For Germany, six top exporters of LIBs (China, Poland, the Rep. of Korea, Hungary, the Czech Republic and Japan) are considered here. These exporters contribute to approximately 80% of imported LIB to Germany. Exporters to the USA are China, the Rep. of Korea and Japan. Together, these exporters supply 80% of American demand. The goal is to find the amounts of LIB importers to Germany and the USA from different countries given the total import and the features of the IPI and CIF price of each country.
As shown in the results of Table 3, the stacked ML method outperforms all other tested approaches in terms of RMSE, MAPE and R-squared for both the USA and Germany data. Its high R-squared value and low RMSE and MAPE values indicate its robustness in capturing complex patterns inherent in such data. By combining their outputs, it effectively leverages the strengths of each base model (ElNet and RF), resulting in enhanced predictive performance.
Table 4 offers a detailed examination of the outcomes across various stages of the LIB SC, showcasing the precision of results through RMSE, R squared and MAPE metrics for both the stacked and hybrid ML models. As the hybrid model is second best, results of this model are also included for a point of comparison. The stacked ML models outperform the hybrid ML models not only in downstream but also in the midstream subproblems.
Taking a broader perspective and considering all countries in the SC, performance metrics were collected across all trained import-based subproblems. For this wider set, the 90% confidence interval around the RMSE ranged from 5.78 to 8.23, with a mean value of 7.11. The 90% confidence interval around the R-squared values ranged from 0.70 to 0.81, with an average of 0.75. The 90% confidence interval around MAPE varied between 8.92 and 21.23, with an overall mean of 17.62. The accuracy of the methods for countries included in Table 4 is higher than the larger set, due to their larger volumes of flows and reliance on fewer countries for import. These added results show consistency of prediction accuracy across the full SC structure.
Generally, this application shows the effectiveness of the ML techniques in SC replication and the benefits of a stacked versus hybrid approach in all levels of analysis.
4.3.3 Gravity model baseline
To benchmark the performance of the proposed stacked ML methodology, a gravity model similar to that employed in Sun et al. (2018); Wohl and Kennedy (2018); Jošić and Žmuk (2022) was implemented. This is the main approach previously given in the literature for predicting flows between pairs of countries. The model was developed on an equation that describes the relationship between flows and factors of GDP, distance and tariffs as given in Equation (2). The equation predicts flows given in kilograms between countries and in month , , from annual GDP ( values, distance ( between the countries and trade tariffs at the importer country (. Here, this model is applied to predict monthly LIB import shares between Germany and the USA and their top trading partners.
where is the error term capturing all unobserved influences on bilateral trade flows. is the model intercept, and the ’s are regression coefficients (elasticities) estimated from the data: and are expected to be positive (higher GDP increases trade), negative (greater distance decreases trade) and negative (higher tariffs reduce trade).
To prepare the data and to enable comparison with the results from using the proposed stacked ML methods, data were obtained for the same period. GDP values were linearly interpolated monthly to match monthly trade data frequency. Trade flow given by weight (kilograms) was scaled by for numerical stability. Equation (2) makes use of a natural logarithmic function as in (Wohl and Kennedy, 2018).
The results of this gravity model for each importer country were averaged over all exporter countries . These results are shown in Table 5. From these results, it is clear that the gravity model performs poorly, with negative R2 values and high RMSE and MAPE. This is because traditional gravity models use broad, aggregate indicators that do not capture the detailed month-to-month variations in the LIB SC. This comparison highlights the benefits of the proposed, more detailed, data-driven ML approaches.
5. Conclusions and extensions
This paper introduced an approach for replicating multi-echelon, multi-commodity SC structures using only limited, publicly available data. The methodology is comprised of two main elements: constructing the SC network representation and employing a stacked ML method for flow computation. By decomposing the SC into importer–exporter subproblems, the method enabled the application of ML techniques to accurately capture complex trade dynamics. Its decomposition strategy allows the approximation of complex SC networks at scale. It is further applicable to diverse applications.
The proposed ML technique was compared against multiple alternative ML models, including RF, ElNet, hybrid and stacked models, to predict flows of materials in the LIB SC. Analysis of the global LIB SC can create valuable insights for stakeholders involved in EV battery production, distribution and recycling. The results showed the power of ML for this application, where compared to XGBoost, SVR, KNN, LSTM and hybrid methods, the proposed stacked ML approach demonstrated superior performance.
Additional experiments were run to compare the accuracy of the proposed stacked methods against an extended version of the predominant gravity model approach given in the literature for predicting bilateral materials flows between countries for use in replicating a duo-echelon SC. The results of these added experiments further underscore the value-added from advanced ML techniques to model complex trade relationships and effectively capture global SC dynamics.
Future research could explore additional factors influencing materials flows in SCs, such as geopolitical factors, environmental regulations and technological advancements. Furthermore, the application of advanced ML techniques, such as deep learning and reinforcement learning, might enhance the accuracy and robustness of the flow estimates. Collaboration with industry stakeholders and policymakers could facilitate the implementation of the proposed framework in real-world settings.
We gratefully acknowledge the financial support provided by the US National Science Foundation (Award No: 1927785).
The supplementary material for this article can be found online.