Short-sea shipping (SSS) plays an important role in regional transportation networks by supporting regional trade and improving inter-modality. In particular, countries in north-east Asia, such as China, South Korea and Japan have been served well by local SSS services. While SSS markets in Northeast Asia (NEA) have been developed by bilateral routes with sub-markets, the market structure of each sub-markets varies depending on concentration and competition levels as well as government intervention. The purpose of this paper is to analyse the market structure of SSS markets in the Northeast Asia.
Herfindahl–Hirschman Index (HHI) and concentration ratio are adopted to measure the market concentration from 2013 to 2017 for SSS markets in NEA. Additionally, the balance between supply and demand is investigated by measuring the capacity utilisation factor (CUF) based on slot capacity.
The market structure in the NEA SSS markets is influenced by firms’ behaviour under different levels of governmental intervention. Shipping firms in a market with more governmental intervention in market entry tend to focus on balancing supply and demand rather than increasing market share, whereas firms in a market with less intervention (and more competition) tend to increase their market share by pursuing efficient capacity management.
The period of data set is limited to 2013–2017. Furthermore, prices or revenue for specific routes are not available.
This paper sheds light on the market structure and behaviour of players in SSS market. In addition, the work has value to measure capacity utilisation based on slot capacity.
1. Introduction
Short-sea shipping (SSS) has played a significant role in international transportation since the mid-1990s, as a means to enhance inter-modality and substitute land transport which may cause more pollution, congestion and accidents. Several studies have been conducted to promote SSS from the perspectives of technology, economics and the environment. However, the definition of SSS is still ambiguous and unclear. While some authors understand SSS to include all maritime transport activities among ports of the same country, others classify SSS as a mode of transport alternative to land transport from a modal shift perspective. Another approach regards SSS as the sea-borne traffic of all kinds of cargoes transported by a vessel on regional sea routes in Northern Europe, the Baltic Sea, the Mediterranean and North American and Asian countries (Grammenos, 2010). The European Commission (EC) defined SSS as maritime transport services which are not deep-sea shipping services involving navigation crossing an ocean (ECMT, 2001).
The EC has developed efficient SSS as a crucial transport mode in the region through the Motorways of the Sea policy (Medda and Trujillo, 2010; Arof, 2015). Motorways of the sea have been devised to promote a modal shift from land transport to SSS as well as to improve competitiveness and reduce pollution within the European countries. In addition, SSS is important transport mode connecting countries in the Northeast Asia such as Korea, Japan and China (Arof, 2015).
Market structure studies in the existing literature focussed on deep-sea routes primarily examining the impact of deregulation on the market structure of shipping markets (Sys, 2009; Sys et al., 2011; FMC, 2012; KMI, 2009). Market structure analysis is also important for the development of SSS because it is likely that the number of firms in SSS markets is more limited and SSS involves more governmental influence than deep-sea routes which are highly deregulated. However, the existing literature tends to deal with SSS in terms of policy instruments for modal shift and inter-connectivity. This study, therefore, aims to examine the market structure of SSS in the Northeast Asia (NEA), focussing on trade between Korea and China and between Korea and Japan. To this end, this study measures market concentration and analyses the demand-supply balance using the capacity utilisation factor (CUF) based on the slot capacity of each market. The volume of containerized cargo transported in each market from 2013 to 2017 is used and a formula is developed to calculate CUF based on slot capacity (Ruist and Söderström, 1975; Lam et al., 2007). A correlation analysis between concentration levels and CUF values of each market is also performed to identify the behaviour of market players.
2. Literature review
2.1 Market structure of shipping markets
The structure–conduct–performance (SCP) paradigm defines the performance of an industry based on the structure and behaviour of the market players. Shepherd (1972) summarised previous research and found that market structure is measured by market share, the degree of market concentration, barriers to entry, firm size, growth rate, the existence of leading firms and other factors. Among these, market share is the largest factor affecting a company’s profitability (Shepherd, 1972; Gale and Branch, 1982). Market share and market concentration are the primary means for assessing whether a market is oligopolistic or competitive. Meanwhile, Conduct is the interactive behaviour of companies in the industry. Elements of firms’ behaviour include pricing policy, advertising, R&D, investment for capacity and any activities for cooperating with or competing against other companies in the industry (Bain, 1968). Market share and degree of concentration affect a firm’s profitability more than other elements (Szymanski et al., 1993; Delorme et al., 2002). In an oligopolistic market, as the number of companies is relatively small, the behaviour of a firm directly affects the interests of other firms. Because of the interdependence, firms in an oligopolistic market can predict how their counterparts will react to their actions. According to conjectural variation, firms with a larger market share can create more profit by increasing their market power, exercising oligopolistic power to restrict output in the market and achieving cost reduction through economies of scale (Gale, 1972). Collusion can be strong within a market consisting of a few competitors (Potters and Suetens, 2013). It is suggested that if:
the number of firms in the market is smaller;
the commodity in the market is homogeneous; or
the market is more concentrated in certain firms, the sellers in those markets can easily create a cartel.
As regards the liner shipping, market structure analysis has long been its focus whenever the market is confronted with events such as an economic crisis or deregulation in shipping markets. The market structure of the liner shipping industry consists of several elements including the number of players in the supply field, service level demand and government regulation. In a market structure analysis, the degrees of competition and concentration are evaluated. Using US industry data, Fusillo (2006) suggested the potential impact of the Ocean Shipping Reform Act on the industry’s structure, which is determined by: the concentration, the number of firm entries and exits and their distribution and product differentiation. Using an SCP framework, Lam et al. (2007) studied the level of contestability of the global liner shipping market, focussing on the transpacific, Europe–Far East, and transatlantic routes of the top 20 liner shipping companies. They found that these markets remain contestable despite increasing concentration. Sys (2009) verified that the liner shipping industry is characterised by increased concentration and some trade routes are characterised by a tight oligopoly. However, it was mentioned that the liner shipping market can still be described as a stable competitive market based on the result regarding market share in liner shipping. Ha and Seo (2017) measured the market concentration of the Korean liner shipping market to compare it to that of the global liner shipping market. Although the Herfindahl–Hirschman Index (HHI) index is currently higher than that of the global shipping market, competition is intense owing to the liberalisation and deregulation in both Korea and the global container shipping markets.
Some researchers reviewed the competition and corporation behaviour among liner shipping companies. Lin et al. (2017) found that market size, total profit and competition have increased. However, the degree of coopetition benefits is not large because of the low degree of cooperation. Balliauw (2017) investigated entry and exit in the liner shipping market, defining it as a regular cycle based on Discrete-Time Markov progress. The author concluded that shipowners seek profit through purchasing and selling vessels rather than from operating vessels. Economic performance and efficiency of shipping firms in different markets by cargo types has been studied (Bang et al., 2012; Kang et al., 2016; Woo et al., 2019). Financial risk and credit risk of shipping firms was evaluated and compared: among shipping market by cargo types (Wang et al., 2014) and between shipping and logistics markets (Woo et al., 2020).
2.2 Short-sea shipping and Northeast Asia shipping studies
Since the 1990s, SSS has been actively studied in the transport research as a means of more environmental transportation in Europe. Therefore sustainability, modal shift and the energy efficiency of SSS have received attention of researchers, especially in the Northern Europe region (Hjelle and Fridell, 2012; Johnson et al., 2014; Schøyen and Bråthen, 2015; Johnson and Styhre, 2015). Factors influencing the development of SSS has been extensively investigated at the government level (Paixão and Marlow, 2002; Brooks and Trifts, 2008; Medda and Trujillo, 2010; Arof, 2015). An economic approach to the SSS market was also adopted, focussing on ships’ economies of scale and port productivity (Sauri, 2006; Ng, 2009).
Meanwhile, research on NEA shipping is mainly divided into two region: the Korea–China shipping market and the Korea–Japan shipping market. Studies on the Korea–China shipping market frequently compare competitiveness of the car ferry and the liner shipping routes as they are operated in similar routes. Most studies on the Korea–China shipping market were conducted for the same purpose: to enhance the competitiveness of national shipping companies in this market using market share, capacity utilisation factors or cost data from shipping companies (Ha et al., 1998; Shin and Lee, 2003; Lee et al., 2008; Yang et al., 2012; Park and Ahn, 2018). The literature on the Korea–Japan liner shipping market is mainly focussed on network analysis, transfer problems, or port development based on Hub and Spoke theory. Le and Ieda (2009) proposed a new index to measure the degree of concentration in a port system called the Geo-economic concentration index and evaluated the degree of port concentration in Japan, China and Korea. Park and Choi (2013) examined the relationship between the volume of trade, number of ships and handling volume in the Korea–Japan liner shipping market. Lee (2014) analysed the factors affecting the market conditions in the Korea–Japan liner shipping market and suggested measures for maintaining the business between shipping companies and shippers.
3. Short-sea shipping market in the Northeast Asia
SSS is a crucial transport mode for Korea because of geographical reasons. Korea is close to China through the Yellow Sea and to Japan through the East Sea. As both countries have economic power in the global market, SSS has great economic significance by linking with various ports between countries. SSS also benefits a port that especially handles local products by facilitating trades between regions and countries (Arof, 2015). Meanwhile, SSS can be used as a tool for developing relationships between countries. For instance, Korea and China officially established diplomatic relations in 1992, and a new maritime cooperation framework was formed between the countries under the 13 special articles of a shipping agreement in 1993. Korea and China hold a shipping dialogue annually to determine the development of new shipping routes and deployment of vessels, which is limitedly applied to Korean and Chinese shipping companies (KSA, 2018). Currently, shipping companies from both countries can service a specific route only if they have a right for the service route granted by the dialogue. For instance, if the shipping company “A” has the right to service the routes from Busan to Dalian and Qingdao, it cannot service Incheon–Dalian or Pyeongtaek–Dalian route. In addition, there is an arrangement by shipping companies from both countries that shipping companies from two countries do not handle more than 650TEU in terms of deployed vessel size. Instead, they tend to increase service frequency – twice or three times per week. This is to prevent possible cases of market failure, such as a monopoly or tight oligopoly, or excessive competition. However, it should be noted that these rules are not applied to all the ports in South Korea–China shipping routes and shipping companies that are not based on both countries can operate exempted from the arrangement (KSA, 2018).
Meanwhile, the liner shipping market between Korea and Japan is the oldest liner shipping route for Korean shipping lines (Lee, 2014), and it is a market with free entry and free exit. However, the Korea–Japan liner shipping route operates with a ceiling system only for main routes to stabilise the routes. The system requires paying a fine if a shipping company carries more than the amount arranged by the system. However, this system has only applied to certain routes with heavy competition and shipping companies registered with this system (KSA, 2018). Therefore, the characteristics of the two markets are markedly distinct in terms of competition level and government intervention.
4. Methodology and data
4.1 Data collection
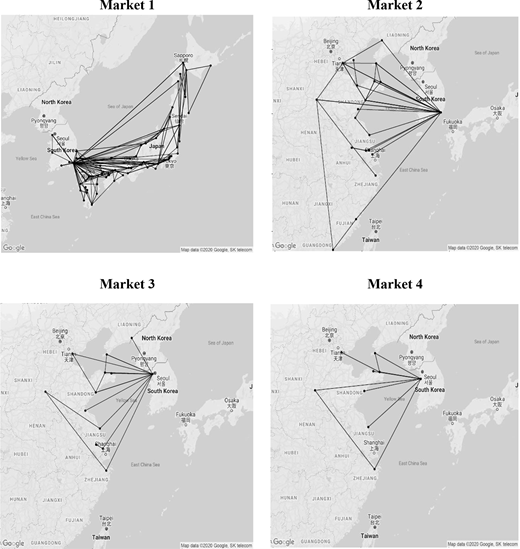
This study attempts to investigate the market structure of SSS in NEA. Container cargo volume data are collected for 2013 to 2017 from KL-Net which provides logistics EDI services for port, while slot capacity was obtained from the database of Korea Ship-owner’s Association (KSA). The data of container cargo volume carried by shipping companies do not include the volume of empty containers as empty containers do not have much implication on revenue for a shipping company (Wang et al., 2013). The Korea–China liner shipping markets are separated by certain groups of routes because shipping companies need to gain the right to provide service for the certain routes. Based on the arrangement by two countries, the Korea–China liner shipping market can, broadly, be divided into three sub-markets which are China–Busan, China–Incheon and China–Pyeongtaek. The ports and shipping routes of each market are as follows (Table 1 and Figure 1).
Table 2 shows descriptive statistics for the NEA market from 2013 to 2017. Market 1 is the Korea–Japan liner shipping market. Markets 2, 3 and 4 represent the Busan–, Incheon– and Pyeongtaek–China liner shipping market, respectively. The average number of shipping companies in NEA is approximately 21. While the largest number of shipping companies operated in Market 3 (Incheon–China) in 2017, the market with the smallest number of shipping companies was Market 4 (Pyeongtaek–China). In terms of cargo volume, Market 1 is the greatest and Market 4 is the smallest port with an average annual throughput of 232,717 TEU. From 2013 to 2017, it is shown that cargo volume in Market 1–3 increased annually but that in Market 4 decreased.
4.2 Measuring the concentration
Market concentration is the phenomenon where market power or economic power is concentrated on a few specific companies (Shepherd, 1972). The higher concentration of market power, the more likely the industry is to depend on the interests of a certain company and the more likely it is for that company to monopolise the entire industry. Concentration ratio, HHI, the Gini coefficient, the Entropy index, and the Rosenbluth index are used to measure the degree of concentration in an economic area (Nguyen et al., 2020). For the calculation, entities in the market and market share by each entity should be determined. The market share is used to calculate the values of the indices to evaluate market concentration which represents the structural characteristics of the market. In this study, Concentration ratio (CR) and HHI are used. The concentration ratio is the sum of the market shares of the top n companies. For example, denotes the sum of the market shares of the top 4 companies in the market. The closer this is to 1, the more oligopolistic the market is (Shepherd, 1972).
HHI is a concentration index designed to assign higher weights to companies with larger market shares. Unlike concentration ratio, HHI reflects the number and size distribution of companies as well as their concentration (Rhodes, 1995). In other words, it is designed so that its calculation is based on the market shares of all the existing companies in the market. As the number of firms decreases and their scale becomes more unevenly distributed, the value of HHI increases and approaches the value for a monopolistic market. A market with an HHI value under 1,000 is deemed an unconcentrated market, and it is likely to be a competitive market. A market whose value is between 1,000 and 1,800 is considered a market with moderate concentration. However, if a market’s value is higher than 1,800, that market is the highly concentrated market (Shepherd, 1972). Let Si be the market share of the ith company and n be the number of companies in the market. Then, HHI is given by:
4.3 Measuring supply and demand: capacity utilization factor
Research on shipping markets has often used CUF (Styhre, 2009; Wu, 2012; Wang et al., 2013; Adland et al., 2018). Capacity utilisation is related to the demand and supply from the origin to the destination of a specific service. Dead weight tonnage (DWT) is used to understand the overall capacity to carry cargo by a ship or a collective group of ships. However, slot capacity is useful to understand capacity of a ship or a group of ships to carry in certain routes. In this study, we compute slot capacity based on the CUF for a single market. To measure slot capacity in the SSS market in the NEA, we make assumptions considering the arrangements by shipping community in this region as below:
For the Korea–China liner shipping market, slot capacity reflects only the vessels reported to KSA from the Korean and Chinese shipping companies to provide their service.
Therefore, the slot capacity for vessels serving Korea–China routes are classified into three different markets (Busan; Incheon; and Pyeongtaek ports) following the fact that they can only provide service on the permitted route.
The slot capacities for Gwangyang, Ulsan, Pohang and Mokpo ports are included in Busan port according to the custom.
(1)As regards Busan port, which provides service to ports in China, vessels mainly call from multiple ports or, sometimes, shipping companies provide a service route from both Busan and Incheon (for example, a vessel “A” providing service to Busan–Pyeongtaek–Shanghai). Hence, it is difficult to divide slot capacity into a single route (for example, Busan–Shanghai and Incheon–Shanghai). Although each shipping company has its own standard for dividing slot capacity, it is difficult to standardise various methods to allocate the slot capacity for the single route from a number of companies. Therefore, it is deemed appropriate to divide the slot capacity among routes according to the monthly rate. Specifically, the monthly ratio is obtained by dividing the volume of the individual route by the total volume transported by vessel “A”.
(2)
Ra-b is the monthly ratio of the volume for route a-b and THRPa-b is the volume of containers transported from port a to port b. Vi is the sum of the monthly volume transported by vessel i. The advantage of using the monthly rate is that it can reflect the change in the volume of transportation.
The monthly slot capacity for each vessel for route a-b is obtained by multiplying slot capacity by the number of voyages per week:
(3)
represents the slot capacity of vessel i for route a-b and n is its number of voyages weekly. As a year is 52 weeks, we also multiply by 4.3 (52 weeks divided by 12 months).
The monthly slot capacity for each route is the sum of the slot capacities of the vessels providing the same service.
(4)
is the slot capacity of the ith vessel that services the route from a to b and n indicates the number of vessels that provide service on the same route.
The annual slot capacity for route a-b is the sum of the monthly slot capacities:
(5)The slot capacity for South Korea–Japan can be simply calculated according to the formula because it guarantees free entry for every shipping companies.
Slot capacities computed based on the formulas above are presented in Table 3. Market 1 has the largest slot capacity. For all the markets except market 4, the slot capacity in 2017 is larger than that in 2013.
Therefore, CUF, based on each port’s slot capacity, is calculated by the following formula:
is defined as the container volume for port a in year y and is the slot capacity for port a in year y. For the Korea–China liner shipping market, a denotes Busan port, Incheon port and Pyeongtaek port. However, for the Korea–Japan shipping market, a represents Korea.(6)
5. Empirical study
5.1 Concentration
To determine the market structure, HHI and CR4 are used and the results are presented in Table 4. The most concentrated market is Market 4 (Pyeongtaek–China). The Top 4 shipping companies in Market 4 control 84% of the market and the average HHI is 4,055. Market 1 is the second most concentrated market with an HHI of 1,082. The least concentrated market is Market 3 with an average HHI of 619. Compared to 2013, in 2017, market concentration increased in all the markets except Incheon. The market with the largest market concentration increase was Market 4, followed by Market 2. As regards Market 1, while Korean shipping firms handle 95% of the market share (Park and Choi, 2013; Lee, 2014), market concentration is not as high as expected.
5.2 Slot capacity-based capacity utilization factor
CUF was calculated using the formula presented in Section 3. While Market 1 showed the lowest CUF values, CUF values of Market 3 were the highest except in 2014. The CUF values of Market 1 were the lowest with average CUF of 20.49% which showed slight decreasing trend from 21.55 in 2013 to 19.63 in 2017. The average CUF in Market 3 is 61.84%, while the CUF in 2017 increased by 4.91% from 2013. CUF values of Market 2 were 45.35% on average with not clear trend. CUF of Market 4 was 52.59% on average which showed decreasing trend from 64.27% in 2014 to 47.8% in 2017 (Table 5).
5.3 Market structure analysis
Market structure of SSS in NEA was investigated through the concentration index and CUF values of each market. Compared to the other markets, Market 3 is a relatively competitive market. Concentration figures show that the market concentration in Market 3 decreased even in 2017 while CUF values in Market 3 were the highest among the markets. While Market 2 is still in a competitive environment, its HHI value showed increasing trend.
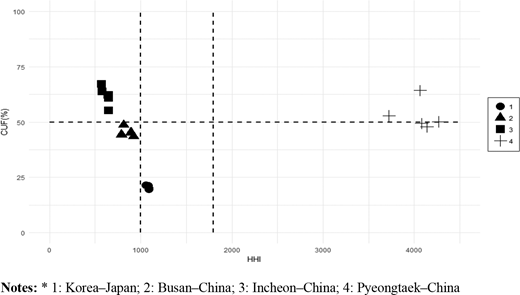
Based on HHI and CR4, Markets 1 and 4 can be regarded as oligopoly markets. Among all the markets, Market 4 (Pyeongtaek–China) is the most concentrated as well as a tight oligopoly market, with an HHI higher than 4,000 (Shepherd and Shepherd, 2003). The scatterplot in Figure 2 shows the relationship between HHI and CUF. Each market is clearly divided by its pairs of HHI and CUF values. In Market 4, the values of CUF are not the highest, even though this market has the highest HHI values. Meanwhile, the CUF for Market 1 is much lower than Market 1’s high market concentration. On the contrary, Markets 2 and 3, which are less concentrated compared to Markets 1 and 4, have higher CUF values. Generally, CUF in the Korea–China liner shipping market is higher than that in the Korea–Japan liner shipping market.
Why does the scatterplot of CUF vs HHI show conflicting results? To answer this question, we conducted a correlation analysis with six variables. The variables used in this analysis were: number of shipping companies in the markets (NUMBER), container throughput (THRP), slot capacity (CAPA), HHI, CR4 and CUF. The correlation analysis results are presented in Table 6. HHI and CR4 are negatively correlated with the number of shipping companies and container throughput, respectively. It is expectable since.
A possible interpretation for this is that there are fewer suppliers in less competitive markets. On the other hand, a market with more shipping companies stimulates a relatively competitive environment, as in Markets 2 and 3. The number of suppliers in Market 2 and Market 3 is 27 and 29, respectively. Many shipping companies provide service from/to Busan because of its status as a hub port with transhipment cargoes concentrated in Busan. However while Incheon port is much smaller than Busan port in terms of container throughput, the number of shipping companies operating in Incheon–China routes, 29 on average, is larger. In addition, there are ten car ferry routes operating between Incheon and China carrying containerized cargoes.
Slot capacity has a positive relationship with container volume. This means that, if demand increases, supply also increases to cover the excess demand. However, the relationship between container throughput and HHI and that between container throughput and CUF are negative. In a market with high concentration, shipping companies will not be allowed to operate more vessels to generate more profit. Since slot capacity depends on the market’s dominant companies, there is a negative correlation between CUF and slot capacity. For CUF, the result indicates that the number of shipping companies in the market and CUF is positively correlated, but CUF and concentration index are not related. The concentration index is an indicator of market structure. However, CUF is considered as a market conduct variable in the SCP model. From an SCP viewpoint, CUF is derived from the demand and supply of market players. A market with many suppliers will seek efficiency in the competitive environment, resulting in a high CUF, which leads to operational efficiency (KMI, 2009).
5.4 Market player’s behaviour
As shown in Table 6, the number of shipping lines has a have a negative impact on concentration ratio and there is no doubt because conventionally, market share is considered as the most significant index among elements consisting of the market structure, as it directly connected with the profitability of a shipping company (Shepherd, 1972; Szymanski et al., 1993; Delorme et al., 2002). In other words, shipping lines have tried to increase their slot capacity to maximise their firms’ market share as shown in market 1. However, the result also shows the fact that there is a positive relationship between the number of shipping companies and CUF. We observed that the concentration ratio and CUF for markets which belong to the Korea–China shipping market are much higher than that for the Korea–Japan shipping market. The most noticeable result is the concentration ratio and CUF for market 4. Although the number of shipping companies supplying services to market 1 and market 4 is almost the same as shown in Table 2, the CUF of market 4 is twice that for market 1 and the concentration ratio is four times that of market 1. This result comes from the behaviour of shipping companies in each market. Firstly, the size of the vessel deployed in market 4 is much smaller than market 1. For instance, the slot capacity in the market 4 ranges from 301TEU to 650TEU and players in market 3 also provide the similar size of the slot capacity ranging from 240TEU to 650TEU. Even the slot capacity for market 2, which contains one of the hub ports in NEA, also cannot exceed 650 TEU in the SSS market because of a shipping agreement between Korea and China. However, shipping companies in market 1 can provide slot capacity based on the demand and supply of its market. Secondly, market entry and exit are not free in the Korea–China shipping market. Deployment of a new vessel to the Korea–China shipping market can only be determined by agreements based on mutual discussion, and shipping companies who have the right to provide the service in a specific market can only operate its vessel.
The agreement has made the Korea–China shipping market to be distinguished from the actions of shipping companies to increase market share. The Korea–China shipping market maintains a sufficient level of CUF despite the fact that the shipping agreement did not allow excessive capacity expansion in existing routes and the creation of new service. It means that market intervention can reduce unnecessary competition in the market as market 2 and 3, thereby reducing costs and ensuring an appropriate level of profit. Meanwhile, although SSS is a crucial transport mode for the regional economy and small-scale shipping lines, it is hard to survive in competition with deep-sea shipping companies because of the lack of resources. However, SSS companies under the same market conditions just as the Korea–China shipping market might be able to compete with deep-sea shipping lines. Consequently, the behaviour of shipping companies in the Korea–China shipping market originated from the shipping agreement between two countries which was established to prevent possible market failures, such as a monopoly or tight oligopoly and excessive competition instead of fair competition, as well as the guarantee of the participation for small-scale shipping companies. In other words, the positive impact of this coordinated action enables the Korea–China liner shipping market to maintain the proper level of market competition.
6. Conclusion
This study was designed to identify the market structure of SSS in NEA by dividing into four markets (market 1: Korea–Japan; 2: Busan–China; 3: Incheon–China; and 4: Pyeongtaek–China) on the viewpoint of SCP model. To estimate the market structure of four markets, HHI and concentration ratio were calculated and CUF based on slot capacity also used to distinguish differences between the Korea–China shipping market and Korea–Japan shipping market. In addition, correlation analysis also conducted to figure out the relationship between the elements of market structure and index for market conduct. Although market 2 and 3 were less concentrated, market 1 and 4 can be regarded as an oligopoly market based on HHI and CR4 results. However, unlike the result from the concentration index, SSS markets between Korea and China (market 2, 3 and 4) had a higher value for CUF compared with market 1. According to the result of correlation analysis, container throughput has a negative impact on the concentration ratio and the relationship between CUF and slot capacity is negative, while that for CUF and the number of shipping companies operating in a market is positive. This result is derived from the behaviour of market players, but ultimately by the shipping agreement between Korea and China. Conventionally, shipping lines have tried to increase their slot capacity to maximise their firms’ market share as shown in market 1 because market share is directly connected with the profitability of a shipping company. However, the Korea–China shipping markets, especially market 2 and 3, show the proper level of concentration ratio and CUF at the same time because the shipping companies in the Korea–China market are difficult to increase their capacity because of the upper limitation on slot capacity based on the shipping agreement between Korea and China. Even the entry to the market is also hard without mutual discussion between two parties. The shipping agreement has been developed to prevent possible market failures, such as a monopoly or tight oligopoly and excessive competition instead of fair competition. As followed the purpose of it, it plays a role in invigorating the market by stabilising the market and allowing small-scales companies to compete with deep-sea shipping lines in similar conditions. As a result, the positive impact of this coordinated action has made the Korea–China liner shipping market maintain a suitable level of market competition.
The result of this study reveals that the SCP model, which was mainly applied to the deep-sea shipping market, can be applied to the SSS market with concentration ratio and CUF. The research also contains the calculation of CUF which is developed using slot capacity. The method to measure CUF with slot capacity would be helpful to recognise the demand and supply in a single route, especially in the SSS market. Meanwhile, as the viewpoint of practical implication, this study may lead to shedding light on the SSS as a crucial transport mode not only as an environmental-friendly mode but also for the regional economy because SSS can contribute to the development of the regional economy by calling all small ports where deep-sea shipping cannot service owing to physical limitations. Moreover, excessive competition in the shipping market might bring a negative impact on society. For instance, excessive competition will lead to eliminating shipping lines who have a poor financial condition, while surviving shipping companies will take advantage of their monopolistic status to raise fares. This will soon have an adverse effect on the shippers and further on society. However, the proper level of market intervention, such as the case of Korea–China shipping market, could serve as an efficient means to stabilise the market and prevent unnecessary costs.
The authors are much grateful to the editor for the encouragement and guidance, and also to the anonymous reviewers for their constructive and valuable comments. This paper was presented at the 2019 IAME Annual conference held in Athens, Greece on 25th–28th June 2019. This research was supported by the 4th Educational Training Program for the Shipping, Port and Logistics from the Ministry of Oceans and Fisheries.