


This paper introduces a revenue efficiency data envelopment analysis (DEA) model with weight restrictions and variable returns to scale, designed to evaluate the efficiency of 38 ports in the Asia–Pacific Economic Cooperation (APEC) region.
The methodology used is the analysis of the data envelope, where the technical, cost and allocative efficiency is calculated with the incorporation of weight restrictions aimed at preventing the generation of unrealistically high efficiency scores.
The findings indicate that the implementation of weight restrictions successfully eliminated outliers. However, there was a general decrease in efficiency across three key measures: technical, revenue and allocative. In the realm of allocative efficiency, none of the ports reached a perfect score.
The major contribution of this research is that despite numerous studies on port efficiency utilizing DEA methodology, none have integrated weight restrictions into overall efficiency assessments. Therefore, the study’s objective is to gauge revenue efficiency, dissected into technical and allocative efficiency, across 38 ports in the APEC region. This is achieved through the implementation of weight restrictions alongside variable returns to scale.
The major contribution of this research is that despite numerous studies on port efficiency utilizing DEA methodology, none have integrated weight restrictions into overall efficiency assessments.
1. Introduction
Over the past four decades, the data envelopment analysis (DEA) methodology has been widely employed to assess the efficiency of various decision-making units. Originally developed by Charnes, Cooper and Rhodes in 1978, it was further expanded by Banker, Charnes and Cooper in 1984. The DEA model calculates the efficiency level of each decision-making unit (DMU) by multiplying input/output data values by the calculated weights to determine efficiency scores (Kabnurkar, 2001). However, in extensions of DEA models, several authors have introduced value judgments into the assessment process.
Recent variants of the DEA model introduce upper and lower bounds on the weights to address certain limitations associated with unrestricted weights. These modified versions are commonly referred to as weight-restricted DEA models (Kabnurkar, 2001). Several authors have seen advantages of using weights restrictions like Allen et al. (1997), Bjørndal et al. (2008), Liang et al. (2008), Lins et al. (2007), De Almada et al. (2013), Joro and Pekka (2015), Podinovski (2016), Pourhabib et al. (2018), Sohraiee (2015) and Thanassoulis (2001).
Traditionally, weight restrictions have served as a method for incorporating value judgments or existing knowledge into DEA assessments, often taking the form of trade-offs between inputs and outputs or a combination of both. The utilization of weight restrictions typically alters the interpretation of results compared with the original DEA model (Podinovski, 2016). In opposition, Camanho and Dyson (2008) employed weight restrictions to incorporate imprecise information about input prices into DEA assessments. Podinovski and Førsund (2010) argue that weight restrictions in DEA should primarily reflect perceived trade-off possibilities among production factors, avoiding contamination with issues related to input/output prices, worth or subjective value judgments.
The presented model assesses port efficiency within the timeframe of 2000–2020, incorporating weight restrictions in technical, revenue and allocative efficiency. Revenue efficiency is determined based on the cargo charges imposed by the ports, while the weight restrictions, elaborated further in subsequent sections, are formulated in consideration of vessel capacities for various cargo types – containers, general cargo, bulk cargo, liquid cargo and passengers.
The major contribution of this research is that despite numerous studies on port efficiency utilizing DEA methodology, none have integrated weight restrictions into overall efficiency assessments. Therefore, the study’s objective is to gauge revenue efficiency, dissected into technical and allocative efficiency, across 38 ports in the Asia Pacific Economic Cooperation Region (APEC) region. This is achieved through the implementation of weight restrictions alongside variable returns to scale. Using this methodology in seaports is crucial for enhancing operational efficiency and reducing costs by optimizing resource allocation. It enables port managers to identify inefficiencies and improve decision-making, ultimately leading to better service delivery and competitiveness in the maritime industry.
The motivation behind this research stems from the pivotal role of maritime transport in facilitating business transactions throughout the Asia–Pacific region. Ports play a crucial role in the overall development of any country, contributing significantly to the industrial, commercial and tourism sectors. However, not all ports are optimally developed to address the substantial challenges in these key areas. Therefore, there is a growing imperative for ports to enhance their efficiency, seeking to maximize economic growth. Given the substantial investments required for the development and maintenance of modern terminal ports, it becomes essential to explore avenues for improving revenue efficiency.
The novelty of this article lies in the introduction of weight restrictions within the DEA model to assess the efficiency of ports, particularly focusing on revenue efficiency in the context of the APEC region from 2000 to 2020. While previous studies have evaluated port efficiency, this research offers a more nuanced and realistic assessment by incorporating weight restrictions based on vessel capacity for different types of cargo (containers, bulk, liquid, etc.). This approach ensures a more accurate reflection of port performance by considering the specific operational constraints of each port. Additionally, the study provides a unique comparative analysis between traditional DEA models and those with weight restrictions, highlighting the robustness and reliability of the latter for evaluating port efficiency.
The outcomes of this research are expected to inform the formulation of port policies in APEC countries, aiming to fortify and position the sector on an international scale. The objective is to enhance commercial dynamism by directly impacting the economic and social spheres of the countries involved.
The paper comprises six sections: First, the introduction contextualizes the study, elucidating the methodology, objectives, motivations and key contributions. The second section, labeled literature review, presents the main authors who have worked on this topic. In the subsequent section, a comprehensive overview of the DEA methodology and developing weight restrictions is provided. The fourth section unveils the results of the technical, revenue and allocative efficiency models with the implemented weight restrictions. In the fifth section, the discussion is presented. Finally, the last section succinctly summarizes the conclusions, encapsulating the study’s key findings and implications.
2. Literature review
The most relevant and widely accepted production indicator in container terminals is container movement measured in TEUs (20-foot equivalent units) (Cullinane et al., 2002, 2005, 2006; Turner et al., 2004; Tongzon and Heng, 2005; Herrera and Pang, 2008; Cheon, 2009; Sohn and Jung, 2009; Cheon et al., 2010; Wu and Goh, 2010; Bichou, 2011, 2013; Yip et al., 2011; Wilmsmeier et al., 2013; Yuen et al., 2013).
Efficient utilization of productive resources, including capital, land and labor, is crucial for port terminals (Dowd and Leschine, 1990). Regarding capital and land, commonly used variables include quay length, terminal area and mechanical equipment, predominantly the number of cranes (Cheon et al., 2010; Bichou, 2011; Yip et al., 2011; Núñez-Sánchez and Coto-Millán, 2012; Yuen et al., 2013). The focus has not only been on the number of cranes but also on their capacity, measured either in tons (Cheon et al., 2010) or through an index (Bichou, 2011).
The evaluation of the labor factor proves challenging due to existing differences among countries, particularly in accounting standards and political contexts (Cullinane and Khanna, 1999).
Labor has been assessed through the average annual number of workers in studies focusing on port authorities (Estache et al., 2002, 2004; Barros, 2005; González and Trujillo, 2008; Medal-Bartual and Sala-Garrido, 2011; Núñez-Sánchez and Coto-Millán, 2012). At the terminal level, obtaining the number of employees is more intricate, although some research has incorporated it (Cullinane and Song, 2003; Ríos and Macada, 2006; Rodríguez-Álvarez et al., 2007; Wilmsmeier et al., 2013; Chang and Tovar, 2014). However, in the literature, it is common for the number of workers to be approximated through the number of cranes or the total equipment in terminals, given the fixed relationship between these variables (De Neufville and Tsunokawa, 1981; Notteboom et al., 2022; Cullinane et al., 2004, 2005).
The analysis of port efficiency has proven instrumental in identifying areas for improvement not only in infrastructure but also in reducing logistical costs, implementing expansive port policies for enhanced intra-regional connectivity and boosting port productivity (Serebrisky et al., 2016; Chang and Tovar, 2014; Núñez-Sánchez and Coto-Millán, 2012; Ramos-Real and Tovar, 2010; Coto Millán et al., 2000; Roll and Hayuth, 1993).
In the current global landscape, ports are engaged in fierce competition, reaping substantial benefits from ocean transportation advancements and logistic improvements. This emphasis has led port sectors to prioritize the enhancement of port efficiency (PE), reducing cargo throughput handling costs and delivering value-added services to contribute to the broader global distribution network (Talley, 2017; Notteboom et al., 2022). The activities of ports and seaborne trade are closely linked to positive socioeconomic impacts, including gross domestic product (GDP) and employment growth (Nogué-Algueró, 2019; Notteboom et al., 2022; Munim and Schramm, 2018; Rodrigue, 2020; Talley, 2006, 2017). Moreover, ports serve as catalysts for urban and regional economic growth, a function directly tied to port productivity (Lonza and Marolda, 2016; Munim and Schramm, 2018; Talley, 2017; Shetty and Dwarakish, 2018).
Lovold et al. (2024) estimate allocative efficiency of Norwegian container ports, emphasizing the role of indirect production theory in overcoming dimensionality challenges in stochastic nonparametric estimators. This paper also discusses the appropriate cost of capital for allocative efficiency estimation. This framework is applied to analyze the allocative efficiency contributing to existing research on seaport terminal efficiency.
Hidalgo-Gallego et al. (2021) analyze the impact of port devolution on the allocative efficiency of Spanish port authorities under varying regulations. Using two approaches – error components and parametric methods—they measure allocative efficiency and apply quantile regression to assess the effects of devolution. The findings reveal significant allocative inefficiencies in the Spanish port system and highlight how port devolution reforms influence these inefficiencies.
Tongzon and Nguyen (2021) examine how the dominance of seaports and shipping lines in international logistics can lead to issues of double marginalization, affecting both technical and allocative efficiency. Their study explores the relationships among logistic integration, technical efficiency and allocative efficiency in container shipping. Using factor analysis and structural equation modeling, they found that logistics integration significantly enhances both types of efficiency, highlighting the importance of relational and operational integration for improving port performance.
Danladi et al. (2024) investigate the operational efficiency of container ports in lower-middle-income (LMI) countries, addressing a research gap in the existing literature. Utilizing data envelopment analysis on cross-sectional data from 53 ports in 2012, the study finds that technical inefficiencies in LMI ports primarily stem from pure technical inefficiency rather than scale inefficiencies. Interestingly, larger ports are not always more efficient than smaller ones. The findings offer valuable insights for government and port authorities regarding resource allocation and performance optimization.
Navarro-Chávez and Delfín-Ortega (2020) aims to analyze the economic efficiency of 52 major international ports from 2010 to 2016 using the DEA methodology. The study examines technical efficiency, allocative efficiency and economic efficiency by employing factor analysis for variable selection. Results indicate that the ports achieved only 38% economic efficiency, primarily driven by technical efficiency. The author recommends public policies to enhance port development, noting the need for better resource utilization and input combination due to the observed low efficiency levels.
Kalgora et al. (2019) evaluated the efficiency of five major commercial ports in West Africa from 2005 to 2016 using three DEA methods: CCR, BCC and Windows I-C. The study found a scale efficiency score of 89.53%, indicating that inefficiencies primarily arise from scale rather than technical issues. It recommends that the ports of Abidjan and Cotonou adjust their operational scales and highlights the impact of external factors, like pandemics and insecurity, on port activities.
Boakye et al. (2021) assessed the technical efficiency of five major container terminals in West Africa using data envelopment analysis (DEA), highlighting a region often overlooked in efficiency studies. Their findings indicate that Tema port is the most efficient, achieving 100% average efficiency over nine years, while the Port of Cotonou has the lowest efficiency at 44%, signifying substantial production waste. This study utilizes recent data from 2010 to 2018, offering crucial efficiency scores for terminal managers to improve operations and strategies.
Shao and Tang (2024) analyze the impact of cross-sector allocative efficiency on the productivity slowdown in the USA during the 1970 and 2000s. They derive statistics for allocative efficiency and decompose aggregate productivity growth in a multi-sector economy. Their findings reveal that about two-thirds of the productivity slowdown is attributable to stagnant allocative efficiency, with increased sector-level volatility linked to this deterioration.
Xie and Hu (2024) evaluate the efficiency of 19 ports in five major economic circles in China, emphasizing their role in international trade amid globalization. Using the DEA-BCC model and fuzzy set qualitative comparative analysis, the study finds varying efficiency rankings, with the Bohai Rim and Yangtze River Delta regions performing well. Results suggest that government support is essential for less developed ports, while a rational industrial structure can improve infrastructure and technology, enhancing overall port performance.
Ben et al. (2022) evaluated the technical efficiency and productivity changes of six major Tunisian seaports – Bizerte, Rades, Sousse, Sfax, Gabes and Zarzis – over 12 years (2005–2016) using data envelopment analysis (DEA). The analysis shows an overall technical efficiency of 69.4% and a pure technical efficiency of 83.3%, indicating that decreasing returns to scale are prevalent. Additionally, the productivity of these ports declined by 6.7%, largely due to an 8.3% deterioration in technological change. The findings serve as a basis for developing efficiency improvement strategies for the studied seaports.
3. Methodology
3.1 Technical efficiency
The literature on technical efficiency traces its origins back to the early 1950s. The first formal definition of technical efficiency emerged with Koopmans (1951), stating that “a vector composed of inputs and outputs will be technically efficient if it is technologically impossible to increase any output or reduce any input without simultaneously reducing another output or increasing another input” (p. 460). Debreu (1951) and Shephard (1953) subsequently introduced the first measures of technical efficiency, albeit with different focuses – output and input, respectively.
Farrell’s seminal work in 1957 laid the groundwork for subsequent developments, further advanced by Charnes et al. (1978). This later work introduced the concept of constant returns to scale (CRS), where changes in input levels lead to proportional changes in output levels. The model’s formulation with constant returns and an input orientation in its envelopment form is expressed by the following formula (Zhu, 2009):
where is the optimal efficiency solution, indicates the distance in inputs to the data envelopment, that is, the efficiency measure. X is the input matrix, Y is the output matrix, is the vector of weights or intensities and, represent the values of inputs and outputs, respectively.
Following this, Banker et al. (1984) expanded their original model by incorporating variable returns to scale (VRS). Recognizing that diverse factors, including imperfect competition and restrictions on access to financing sources, can lead units to operate outside their optimal scale, this model introduces a modification to the original linear program with constant returns to scale. A constraint is added to account for these variations: . Thus, the variable returns to scale model with input orientation is as follows:
The evaluated unit will be deemed efficient, according to the Pareto–Koopmans definition, if and only if in the optimal solution and the slack variables are all zero, that is, (Zhu, 2009).
3.1.1 Allocative efficiency
Allocative efficiency, also known as price efficiency, was introduced by Farrell (1957) and can be computed when input or output prices are known. Allocative efficiency of inputs reflects the optimal combination of inputs given their prices, while efficiency of revenues can be calculated when output prices are known. A more comprehensive measure, gains efficiency, can be calculated when prices for both inputs and outputs are available (Thanassoulis, 2001b).
The assessment of allocative efficiency for outputs involves a two-stage process. First, technical efficiency is determined, followed by the calculation of revenue efficiency through the incorporation of output prices.
Coelli et al. (2005) describe allocative efficiency as the ability of a firm to utilize inputs in the optimal proportions, considering their respective prices. Additionally, Coelli points out that allocative inefficiencies are comparable to slacks in resource use. Allocative efficiency, however, is determined by the ratio between the minimum costs necessary for a decision-making unit (DMU) to produce a specific output level (cost-efficiency) and the actual costs incurred by the DMU, adjusted for technical efficiency (TE) (Brack and Jimborean, 2009).
Allocative efficiency in data envelopment analysis (DEA) is obtained by evaluating how well a decision-making unit (DMU) allocates its resources or inputs, given their costs, compared to the optimal proportion of inputs it should use to minimize costs while maintaining the same level of production (Thanassoulis, 2001).
Calculation of technical efficiency (TE)
First, the technical efficiency of the DMU is evaluated. This step focuses on measuring how efficiently a DMU converts its inputs into outputs without considering prices (Brack and Jimborean, 2009).
Input-oriented approach: The aim is to minimize the amount of inputs used to produce a given level of output. A DMU is technically efficient if it cannot reduce any of its inputs without affecting its level of production.
Output-oriented approach: The goal is to maximize the amount of output produced with a fixed amount of inputs. A DMU is technically efficient if it cannot increase its output without increasing its input.
The calculation of technical efficiency is done by comparing the DMU to the efficient production frontier, which is formed by the DMUs that operate most efficiently. DMUs not on the frontier are considered inefficient (Delfín and Navarro, 2014).
Calculation of cost-efficiency
Once technical efficiency is calculated, the next step is to calculate cost-efficiency, which combines both technical efficiency and input prices. Here the goal is to find the minimum costs a DMU should incur to produce its level of output if it were using the optimal proportion of inputs.
Minimum costs: The minimum necessary costs to produce the observed output level are calculated, assuming the DMU uses inputs in the most efficient proportions, given their prices.
The general formula for minimum costs is
where
is the price of the input. i,
is the optimal amount of the input. I that should be used to minimize costs.
In this step, the ideal proportions of each input are determined (the quantities … ) that minimize costs, given the price structure.
Calculation of allocative efficiency (AE)
With technical efficiency and minimum costs calculated, allocative efficiency can now be determined. This measures how well the DMU is allocating its inputs, considering the prices of those inputs, to minimize costs. In other words, it reflects whether the DMU is using inputs in economically optimal proportions (Hidalgo and Nuñez-Sánchez, 2012).
The formula for allocative efficiency is
where
Minimum costs: These are the costs the DMU should incur if it were allocating its inputs optimally, given the prices.
Observed costs: These are the actual costs incurred by the DMU, using the current quantities of inputs.
If AE = 1, the DMU is using its inputs in optimal proportions, meaning it has achieved allocative efficiency.
If AE < 1, the DMU is allocatively inefficient, meaning it is not making the most of the input price structure. It could reduce its costs by adjusting the quantities of inputs used.
Relationship between technical and allocative efficiency
Allocative efficiency is calculated as the ratio of cost-efficiency to technical efficiency. Therefore, to fully understand the efficiency of a DMU, both are considered:
Technical efficiency (TE): Evaluates whether the DMU is using the minimum amount of inputs for a given level of output.
Allocative efficiency (AE): Assesses whether the DMU is using inputs in the appropriate proportions, given their prices.
Overall, the cost-efficiency of a DMU is the outcome of technical efficiency and allocative efficiency:
Cost-efficiency (CE) = TE × AE.
In summary, to obtain allocative efficiency in DEA, one must first calculate technical efficiency to assess how efficiently the inputs are being utilized. Then, these inputs are adjusted based on their prices to find the minimum costs. Allocative efficiency is derived by comparing these minimum costs with the observed costs, allowing for the identification of whether the DMU could improve its input allocation to reduce costs and increase economic efficiency.
The revenue function R (x, p) represents the maximum revenue that can be obtained from the factors x = (x1 … xn), taking into account the prices p = (p1 … pm) at which the obtained products y = (y1 … ym) are sold.
It is necessary to calculate Rj0, which maximizes the revenue, considering the prices Prj of the outputs yrj (r = 1 … s) for each DMU j0 given a level of inputs xij (r = 1 … m), and is obtained through the following model (Thanassoulis, 2001).
where
j = are dmu,
Xij = are the inputs,
Yrj = are the outputs,
Prj = are the prices of outputs.
3.2 Selection of DMU’s
The efficiency measurement was conducted across 30 container terminals located in international ports within the APEC region. The selection criteria for decision-making units (DMUs) included those ports that handled more than one million 20-foot equivalent units (TEUs) annually in the APEC region in 2020, as reported by the World Shipping Council (refer to Table 1).
Port selection of the APEC region
| Port | Millions of teus (2020) | |
|---|---|---|
| 1 | Shanghai, China | 43.5 |
| 2 | Singapore | 36.6 |
| 3 | Ningbo-Zhoushan, China | 28.72 |
| 4 | Shenzhen, China | 26.55 |
| 5 | Guangzhou Harbor, China | 23.19 |
| 6 | Qingdao, China | 22 |
| 7 | Busan, South Korea | 21.59 |
| 8 | Tianjin, China | 18.35 |
| 9 | Hong Kong, S.A.R, China | 17.95 |
| 10 | Port Klang, Malaysia | 13.24 |
| 11 | Xiamen, China | 11.41 |
| 12 | Tanjung Pelepas, Malaysia | 9.85 |
| 13 | Kaohsiung, Taiwan | 9.62 |
| 14 | Los Angeles, USA | 9.2 |
| 15 | Long Beach, USA | 8.11 |
| 16 | Laem Chabang, Thailand | 7.55 |
| 17 | Ho Chi Minh City, Vietnam | 7.2 |
| 18 | Dalian, China | 6.54 |
| 19 | Tanjung Priok, Jakarta, Indonesia | 6.17 |
| 20 | Yingkou, China | 5.67 |
| 21 | Rizhao, China | 4.86 |
| 22 | Lianyungang, China | 4.8 |
| 23 | Savannah, USA | 4.68 |
| 24 | Manila, Philippines | 4.43 |
| 25 | Manzanillo, Mex | 3.34 |
| 26 | Tokyo, Japan | 3.13 |
| 27 | Melbourne, Australia | 2.88 |
| 28 | Callao, Perú | 2.25 |
| 29 | San Antonio Chile | 1.55 |
| 30 | Lázaro Cardenas, Mex | 1.06 |
Source(s): Author’s own elaboration based on the DEA methodology and report of the World Shipping Council of the European Union (2022)
3.3 Selection of inputs and outputs and prices
To determine the inputs and outputs, all activities conducted in a port were considered, taking into account the specific terminals and types of goods that necessitate specialized facilities for loading and/or unloading.
A port encompasses a myriad of activities, including the management of terminals, planning for yards and traffic and even the provision of marine services to vessels. A port terminal unit, whether situated within or outside the port, comprises structures, installations and surfaces, including water areas, facilitating the comprehensive handling of goods and passenger traffic within the port (Delfín and Navarro, 2014).
Port terminals serve as operational units within a port, equipped to facilitate modal interchange and provide port services, encompassing infrastructure, temporary storage areas and internal roads. In the cargo mobilization process, the primary output indicator, several stages involve distinct inputs. Initially, at the quay, the critical input is the sea-to-shore gantry. Port terminals are categorized into general cargo terminals (handling cars, machinery and equipment), bulk cargo terminals (dealing with iron, coal and agribulk), liquid cargo terminals (managing oil, derivatives and other liquid bulk), container terminals and passenger terminals. Consequently, this research considers port surface area and quay length as inputs for all terminals, while cargo throughput serves as the output indicator.
Regarding prices, the income received from operations in each terminal is considered, utilizing the rates applied in the selected years.
Therefore, for the computation of technical efficiency, the chosen variables are as follows:
Inputs.
x1. Quay length (km)
x2. Surface (has).
Outputs:
y1. Number of containers (number of 20-foot equivalent units (TEU)
y2. General cargo (metric tons)
y3. Bulk carg (metric tons)
y4. Liquid cargo (metric tons)
y5. Passengers (passengers annually)
The inputs represent the primary resources available to a port in the short to medium term, while the outputs capture the volume of activities leading to income generation. In this perspective, the port is conceptualized as a black box, where physical resources serve as the input and income-generating activities constitute the output. The evaluation aims to gauge how effectively the port’s physical assets are transformed into income. All internal activities within this “black box,” including terminal management, yard planning, traffic planning and marine services, are considered managerial choices and are therefore subject to assessment for their effectiveness.
To assess the revenue efficiency and allocative efficiency of each port, output prices were utilized in the following manner:
Unit fee handling containers
Unit fee handling general cargo
Unit fee handling dry bulk
Unit fee handling liquid bulk
Fee per passenger
Prices were in US dollars. They were deflated to real values of 2015.
The data spans the years 2000–2020 and is sourced from a combination of reputable outlets, including the World Shipping Council, Containerization International Yearbooks, International Association of Ports and Harbors, American Association of Port Authorities, the World Bank, World Port Source, Review Maritime Transport of the United Nations Conference on Trade and Development, China port yearbooks, Mexican port yearbooks and the websites of each selected port.
The income generated by ports serves various goals, including macroeconomic objectives that contribute to regional economic development and employment. Additionally, ports aim for economic-logistical objectives to expand their foreland influence. Port-centric goals involve optimizing the use of port resources and assets, while sustainability objectives support the development of green supply chains and energy transitions. These considerations shape the objectives, goals and strategies employed by ports in utilizing economic resources (Notteboom et al., 2022).
Port costs are subject to various policies set by port authorities to prevent abuse. Tariff regulations establish the foundations and rules for determining tariffs and prices in ports and terminals, ensuring satisfactory conditions of quality, safety, competitiveness and permanence in infrastructure use, service provision and goods exploitation. Additionally, these regulations aim to prevent operators and service providers from charging rates that exceed reasonable costs in the absence of a competitive environment (Official Journal, 1999).
3.4 Developing weight restrictions
In data envelopment analysis (DEA), efficiency is defined as the ratio of the sum of weighted outputs to the sum of weighted inputs for each port. The DEA model selects weights for each input and/or output to maximize the relative efficiency of each port. The flexibility in choosing weights prevents inefficient units from claiming bias against their input–output values. However, the downside is that a unit can appear more efficient than it truly is by assigning weights that deviate from intuition or knowledge. To address this issue, various methods have been proposed to impose weight restrictions on DEA, such as Dyson and Thanassoulis (1988), Thanassoulis and Allen (1998), Wong and Beasley (1990), Thompson et al. (1990), Roll et al. (1991), Roll and Hayuth (1993), Podinovski (2005) and Allen and Thanassoulis (2004).
In the context of weight restrictions, a linear formulation is proposed to determine the optimal positive weight for each selected set. In this approach, individual constraints are applied to input/output weights. Equation (1) not only establishes a common positive set of weights but also mitigates dissimilarities in weights simultaneously.
Let us assume that we have N DMUs (j = 1 … N), each consuming varying amounts xij of m different inputs (i = 1 … N) to produce varying quantities, yrj, of s different outputs (r = 1 … N).
We assume that these quantities are strictly positive so that xij >0 and Yrj >0
The variable is the deviation variable or slack variable for each DMU in constraint (1).
We can calculate the potential cargo capacity for each type of cargo based on the size of a given vessel, which then serves as a foundation for establishing trade-off restrictions between various cargo types. These restrictions can subsequently be integrated into the DEA assessment model.
For instance, let’s consider a vessel occupying a quay length of 300 meters. Its cargo capacity, when fully loaded, is detailed in Table 2.
Capacity of a ship taking 300m of quay
| Type of ship | Length | Capacity | Weight |
|---|---|---|---|
| Container ship | 300 mts | 4,300 containers | CS |
| (20 tons each one) | |||
| General cargo ship | 300 mts | 70,000 DWT | GCS |
| Bulk carrier ship | 300 mts | 160,000 DWT | BCS |
| Tanker ship | 300 mts | 380,000 DWT | TS |
| Passenger ship | 300 mts | 3,700 passengers | PS |
Source(s): Author’s own elaboration based on the DEA methodology and UNCTAD, 2022
Thus, one ship fully laden with containers would take 4,300 of them, and their weight would be 86,000 tones. This corresponds to 70,000 tons of general cargo since that is the quantity of that cargo that would fit in a ship taking 300m of quay. So, if CS is the DEA weight for containers (in units of 4,300) and GCS the weight for general cargo in units of 70,000 tons, we would expect under efficient operation these tonnages to offer the same virtual output value in terms of what we can derive from using a quay of 300m, or 86CS = 70 GCS.
However, different ports will be handling cargoes in different ways, so we can expect considerable variation around these ready-reckoner tradeoffs. We subjectively adopted the notion that
Following the same procedure, the following further weight restrictions were derived:
Bulk carrier:
BCS – 0.134375CS ≥ 0 and.
BCS – 0.403125CS ≤ 0.
Liquid carrier:
TS – 0.056579CS ≥ 0.
TS – 0.169737CS ≤ 0.
Passengers: 3,700 passengers are 0.0037 m.
PS – 0.581081CS ≥ 0 and.
PS – 1.743243CS ≤ 0.
INPUTS.
Quay/Surface I assume the average is 17.23 km of quay and 167.54 hec of surface. If not, let me know before you proceed.
k – 4.861869n ≥ 0 and
k – 14.58561n ≤ 0.
Quay v CS.
One km of quay can accommodate 3.3 ships of each one carrying 0.0043 m teus
4. Results and analysis
The results of two DEA models are presented. The first one calculates technical efficiency with variable returns to scale (VRS) and output orientation (see Table 3). Subsequently, allocative efficiency is computed, considering a model based on output prices, as the objective is to maximize revenue. Similarly, the results obtained by applying weight restrictions to both models are presented (see Table 4).
Average technical, allocative and revenue efficiency for the period 2000–2020
| Name | Technical | Revenue | Allocative | |
|---|---|---|---|---|
| Efficiency | Efficiency | Efficiency | ||
| 1 | Melbourne | 0.36 | 0.25 | 0.69 |
| 2 | Sidney | 1 | 0.28 | 0.28 |
| 3 | Metro Vancouver | 1 | 0.42 | 0.42 |
| 4 | Guangzhou Harbor | 1 | 0.8 | 0.8 |
| 5 | Qingdao | 1 | 1 | 1 |
| 6 | Shenzhen | 1 | 0.69 | 0.69 |
| 7 | Tianjin | 1 | 0.76 | 0.76 |
| 8 | Dalian | 0.71 | 0.52 | 0.74 |
| 9 | Xiamen | 0.4 | 0.31 | 0.77 |
| 10 | Ningbo-Zhoushan | 0.81 | 0.68 | 0.84 |
| 11 | Lianyungung | 0.69 | 0.21 | 0.31 |
| 12 | Yingkou | 1 | 0.49 | 0.49 |
| 13 | Shanghai | 1 | 1 | 1 |
| 14 | Busan, South Korea | 0.58 | 0.32 | 0.55 |
| 15 | Kwangyang | 0.87 | 0.5 | 0.58 |
| 16 | Long Beach, USA | 0.41 | 0.19 | 0.47 |
| 17 | Los Angeles, USA | 0.35 | 0.2 | 0.57 |
| 18 | Okland- Sn Francisco Bay Area | 1 | 0.37 | 0.37 |
| 19 | Tacoma | 1 | 0.6 | 0.6 |
| 20 | Seattle | 1 | 0.33 | 0.33 |
| 21 | Manila | 0.86 | 0.25 | 0.29 |
| 22 | Hong Kong, China | 1 | 0.68 | 0.68 |
| 23 | Tanjung Priok, Jakarta | 1 | 0.67 | 0.67 |
| 24 | Tanjung Perak, Surabaya | 1 | 0.547 | 0.547 |
| 25 | Keihin ports*, Japan | 0.56 | 0.36 | 0.65 |
| 26 | Hanshin* ports, Japan | 0.46 | 0.28 | 0.61 |
| 27 | Nagoya | 0.56 | 0.27 | 0.48 |
| 28 | Port Kelang | 0.6 | 0.26 | 0.43 |
| 29 | Tanjung Pelepas | 1 | 0.13 | 0.13 |
| 30 | Manzanillo | 0.69 | 0.42 | 0.6 |
| 31 | Lázaro Cárdenas | 0.36 | 0.17 | 0.47 |
| 32 | Callao | 0.93 | 0.22 | 0.23 |
| 33 | Singapore | 1 | 1 | 1 |
| 34 | Laem Chabang | 0.44 | 0.19 | 0.43 |
| 35 | Bankgok | 1 | 1 | 1 |
| 36 | Kaohsiung | 0.34 | 0.28 | 0.84 |
| 37 | Keelung | 1 | 0.63 | 0.63 |
| 38 | Ho Chi Minh | 1 | 0.587 | 0.587 |
Source(s): Author’s own elaboration based on the DEA methodology
Average technical, allocative and revenue efficiency with weight restrictions for the period 2000–2020
| Technical | Revenue | Allocative | ||
|---|---|---|---|---|
| Efficiency | Efficiency | Efficiency | ||
| 1 | Melbourne | 0.3016 | 0.25 | 0.82 |
| 2 | Sidney | 0.3415 | 0.28 | 0.83 |
| 3 | Metro Vancouver | 0.5157 | 0.42 | 0.82 |
| 4 | Guangzhou Harbor | 1 | 0.8 | 0.8 |
| 5 | Qingdao | 1 | 1 | 1 |
| 6 | Shenzhen | 0.7143 | 0.69 | 0.96 |
| 7 | Tianjin | 1 | 0.76 | 0.76 |
| 8 | Dalian | 0.6969 | 0.52 | 0.75 |
| 9 | Xiamen | 0.3528 | 0.31 | 0.87 |
| 10 | Ningbo-Zhoushan | 0.7776 | 0.68 | 0.88 |
| 11 | Lianyungung | 0.3192 | 0.21 | 0.67 |
| 12 | Yingkou | 0.7614 | 0.49 | 0.64 |
| 13 | Shanghai | 1 | 1 | 1 |
| 14 | Busan, South Korea | 0.3777 | 0.32 | 0.84 |
| 15 | Kwangyang | 0.834 | 0.5 | 0.6 |
| 16 | Long Beach, USA | 0.2314 | 0.19 | 0.82 |
| 17 | Los Angeles, USA | 0.274 | 0.2 | 0.74 |
| 18 | Okland – Sn Francisco Bay Area | 0.5382 | 0.37 | 0.7 |
| 19 | Tacoma | 0.7126 | 0.6 | 0.84 |
| 20 | Seattle | 0.6999 | 0.33 | 0.47 |
| 21 | Manila | 0.5807 | 0.25 | 0.43 |
| 22 | Hong Kong, China | 0.7561 | 0.68 | 0.9 |
| 23 | Tanjung Priok, Jakarta | 0.7245 | 0.67 | 0.93 |
| 24 | Tanjung Perak, Surabaya | 0.7033 | 0.55 | 0.78 |
| 25 | Keihin ports*, Japan | 0.5235 | 0.36 | 0.7 |
| 26 | Hanshin* ports, Japan | 0.433 | 0.28 | 0.65 |
| 27 | Nagoya | 0.522 | 0.27 | 0.52 |
| 28 | Port Kelang | 0.2865 | 0.26 | 0.9 |
| 29 | Tanjung Pelepas | 0.2055 | 0.13 | 0.66 |
| 30 | Manzanillo | 0.4401 | 0.42 | 0.95 |
| 31 | Lázaro Cárdenas | 0.2024 | 0.17 | 0.83 |
| 32 | Callao | 0.3176 | 0.22 | 0.68 |
| 33 | Singapore | 1 | 1 | 1 |
| 34 | Laem Chabang | 0.227 | 0.19 | 0.82 |
| 35 | Bankgok | 1 | 1 | 1 |
| 36 | Kaohsiung | 0.3063 | 0.28 | 0.92 |
| 37 | Keelung | 1 | 0.63 | 0.63 |
| 38 | Ho Chi Minh | 0.6338 | 0.59 | 0.93 |
Source(s): Author’s own elaboration based on the DEA methodology
The analysis of the DEA VRS model presented in Table 3 reveals that the observed ports demonstrating technical efficiency consistently exhibit the highest levels among the three calculations. Out of the 19 ports analyzed, they were deemed efficient, having a value of 1, while the remaining ports were considered inefficient, failing to achieve optimal performance from the available physical resources. Notably, ports such as Qingdao, Shanghai, Singapore and Bangkok demonstrated efficiency across all periods, encompassing technical, revenue and allocative aspects.
Conversely, the port of Tanjung Pelepas, while technically efficient, displayed the lowest allocative efficiency throughout the entire period, registering a value of 0.13. This implies that, despite achieving technical efficiency, it struggled to maximize income based on the combination of inputs utilized.
On the other hand, calculations performed with the weight restrictions model reveal more robust results, especially in technical efficiency, where now only seven ports were deemed efficient in this calculation (see Table 4). This is attributed to the adjustment providing the necessary elements to establish a more robust frontier. Regarding the calculations for technical, revenue and allocative efficiency, the same ports – Qingdao, Shanghai, Singapore and Bangkok – demonstrated efficiency across all three levels throughout the years.
Furthermore, the results of allocative efficiency show higher values than the model presented in Table 2. It is also observed that the port of Tanjung Pelepas continues to exhibit the lowest levels of revenue efficiency. However, the port of Manila achieved the lowest level of allocative efficiency.
Graph 1 presents a comparison between the two non-parametric methodologies in measuring technical efficiency. It can be observed that the results are more robust with the DEA weight restriction model. However, at a global level, the conclusions align: in both models, Guangzhou Harbor, Tianjin, Qingdao, Shanghai, Singapore, Keelung and Bangkok are the most efficient ports, while Tanjung Pelepas and Lázaro Cárdenas remain the ports with the lowest levels of efficiency. In these latter ports, the annual container volume they handle is very low and the docks and container terminal surfaces are not operating at full capacity.
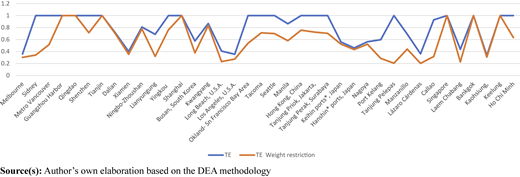
Average technical efficiency and with weight restrictions for the period 2000–2020
Average technical efficiency and with weight restrictions for the period 2000–2020
The efficiency of ports in China, Singapore and Bangkok can be attributed to various factors, ranging from investments in infrastructure to the implementation of advanced technologies.
Results with weight restrictions in data envelopment analysis (DEA) is considered more consistent and robust because it imposes limits on the weights that can be assigned to inputs and outputs in the model. This has several effects that enhance the stability and reliability of the results:
It prevents the extreme assignment of weights.
In classic DEA, decision-making units (DMUs) can assign extremely high or low weights to certain inputs or outputs, which could make some DMUs appear extremely efficient imply by ignoring certain inputs or outputs. Weight restrictions limit this flexibility, requiring DMUs to consider a reasonable proportion of all factors.
Impact: This prevents the results from being distorted by an overly favorable assignment of weights, making the outcomes more representative and credible.
Greater realism in resource allocation. Weight restrictions allow for the incorporation of value judgments or expert knowledge into the model. By setting limits on the weights, it ensures that the proportions of inputs and outputs more accurately reflect the reality of the DMU’s operations, rather than a purely mathematical allocation that may lack practical significance.
Impact: The results become more realistic and applicable to decision-making, increasing their consistency across different scenarios.
Reduced sensitivity to small data changes. Without weight restrictions, the DEA model can be sensitive to small changes in the data, such as variations in inputs or outputs. This can lead to calculated efficiency varying significantly with minor adjustments in the data. Weight restrictions limit this sensitivity, making the model more stable and resilient to small fluctuations.
Impact: The results are less susceptible to insignificant changes in the data, improving the overall robustness of the analysis.
Better comparison between DMUs By setting limits on the weights, it ensures that all DMUs are evaluated under more similar criteria, allowing for fairer and more equitable comparisons. Without restrictions, a DMU may appear efficient simply because it chooses weights that maximize its particular performance without allowing for a fair comparison with other DMUs facing similar conditions.
Impact: The results are more consistent and comparable across different DMUs, making it easier to identify true differences in efficiency.
Prevents degenerate solutions
Weight restrictions help prevent situations where the DEA results are degenerate, meaning DMU assigns almost all the weight to a single input or output while ignoring others. These degenerate solutions can lead to incorrect interpretations of efficiency.
Impact: Weight restrictions produce more balanced results, preventing the analysis from being influenced by unrealistic or extreme solutions.
Finally, the results obtained with weight restrictions in DEA are more consistent and robust because they ensure a more balanced distribution of weights, better reflect the reality of the DMUs, are less sensitive to small changes in the data and allow for fairer comparisons. This enhances the credibility and applicability of the results in decision-making.
5. Discussion
The results of the two DEA models presented in this study align with and expand upon the findings in the literature on port efficiency and the importance of allocative efficiency. For instance, similar to the work of Lovold et al. (2024), which emphasizes the importance of adapting to prices for assessing allocative efficiency, this study’s approach to measuring allocative efficiency based on output prices further demonstrates how ports’ income-maximizing capabilities are linked to their ability to optimally combine inputs. Both studies suggest that incorporating market conditions and price adjustments is crucial for an accurate evaluation of port performance.
Additionally, the study’s findings that technical inefficiency persists in several ports, such as Tanjung Pelepas and Lázaro Cárdenas, resonate with Hidalgo-Gallego et al. (2021), who explored how external factors like port regulations and governance impact allocative efficiency. This highlights the broader impact of institutional factors on port performance, reinforcing the notion that ports should consider regulatory environments in their operational strategies to enhance efficiency.
Furthermore, the comparative analysis with the weight restrictions DEA model showing more robust results mirrors Tongzon and Nguyen’s (2021) argument that both technical and allocative inefficiencies often coexist in seaport operations, due in part to market structure and logistics integration challenges. This study similarly finds that weight restrictions, by aligning with operational realities such as cargo capacities, provide a more authentic measure of port efficiency.
Lastly, the importance of scale inefficiency, noted in Kalgora et al. (2019) in their study of West African ports, is paralleled by the low efficiency levels found in ports with underutilized infrastructure, such as Tanjung Pelepas and Lázaro Cárdenas. The consistent themes of resource underutilization and the need for operational adjustments further support the necessity for targeted investments and strategic optimizations, as emphasized in both this research and the broader literature.
Overall, this study contributes to the growing body of literature by demonstrating how the inclusion of weight restrictions in DEA models not only refines the measurement of technical and allocative efficiency but also provides more reliable insights into the operational challenges and opportunities in the port sector, particularly in the APEC region.
The obtained results underscore the need to enhance port efficiency. Maritime transportation of goods and people constitutes a fundamental link in the economic growth of a state, and based on the findings, it can be inferred that ports are outdated in terms of modern logistics techniques and procedures. This reality hampers competitiveness within commercial activities. The global contraction in trade during the pandemic impacted all countries. To reduce the likelihood of a similar situation in the future, United Nations Conference on Trade and Development (2023) emphasizes three areas that require attention: advancing trade facilitation reforms, improving monitoring and forecasting of maritime trade and strengthening national competition authorities. We explore several fundamental factors that could enhance the effectiveness of these ports:
Infrastructure investments: China, Singapore and Bangkok have made significant investments in expanding and modernizing their port infrastructure. This includes the development of docks, container terminals and specialized cargo handling systems to accommodate various types of cargo.
Advanced technology: The adoption of advanced port technologies, such as automated container handling systems and optimized logistical processes, can significantly enhance operational efficiency.
Efficient resource management: These ports have implemented efficient management practices, ensured optimal resource allocation and maximizing the utilization of docks and storage areas.
Connectivity and integrated logistics: Efficient connectivity with land transportation networks and the integration of logistic services contribute to a seamless supply chain, reducing waiting times and improving overall efficiency.
Regarding the relevance of handling different types of cargo with docks and port surfaces, it is essential to consider the diversification of port activities and adaptation to market demands. Here is a discussion on the importance of managing the various types of cargo:
General cargo: Efficient handling of general cargo involves the ability to manage a variety of products, from bulk goods to palletized cargo. This requires versatile port facilities and specialized equipment.
Liquid cargo: Efficient management of liquid cargo, such as oil and chemicals, involves secure facilities and handling systems that comply with strict safety and environmental regulations.
Bulk cargo: Efficient handling of bulk cargo, such as grains or minerals, demands specialized infrastructure and technologies that minimize losses and optimize the flow of goods.
Containers: Efficient container handling is crucial for most modern ports, as this method facilitates standardization, efficient loading and unloading and optimization of space on ships and storage areas.
Passengers: Efficient passenger handling, whether on cruise ships or ferries, involves smooth logistic services, comfortable facilities and effective safety protocols.
In summary, the efficiency of leading ports is based on a combination of strategic investments, advanced technologies and effective management that encompasses the diversity of cargo types and services offered.
Regarding the technological factor, it represents a weakness within most ports, especially in the American continent and notably in Mexican ports. In this regard, Macías and Rodríguez (2017) indicate that technology is a set of knowledge, forms, methods, instruments and procedures that enable the combination of different resources and capacities in products, production processes and organizational methods to make them more efficient for users and clients. Implementing this is what is needed.
The practical and policy implications of the results presented in the DEA models for technical, allocative and revenue efficiency, with and without weight restrictions, are significant and directly influence strategic decision-making in port management and development. Here are the key implications:
Optimization of port management
The results of the DEA models provide valuable insights into how efficiently ports use their resources and generate revenue. The distinction between technical and allocative efficiency allows port managers to identify specific areas for improvement:
Practical implication: Ports like Tanjung Pelepas, which are technically efficient but allocatively inefficient, need to reassess how they allocate resources based on prices and demand to maximize revenue. This might involve changes to operational structures or improving input allocation.
Policy implication: Public policies can incentivize strategic investments in infrastructure and technology to improve allocative not just technical, efficiency. Investments should be directed toward areas that enhance the optimal combination of inputs to maximize revenue.
Impact of weight restrictions
The more robust results obtained using the weight restriction model suggest that a stricter analysis offers a more accurate assessment of port efficiency.
Practical implication: Port managers can use these results to make finer adjustments in operations, as weight restrictions better reflect real market conditions and limit extreme resource allocation that could distort evaluations.
Policy implication: Government agencies overseeing the port sector could use weight-restricted models to create more precise policies and promote efficiency standards that better align with the economic realities of the ports.
Investment in infrastructure and technology
The high efficiency observed in ports such as Qingdao, Shanghai, Singapore and Bangkok reflect the positive impact of investments in infrastructure and advanced technologies.
Practical implication: These ports serve as benchmarks for less efficient ports like Tanjung Pelepas and Lázaro Cárdenas, which could adopt best practices, focusing on technological modernization and infrastructure expansion.
Policy implication: Governments in countries with less efficient ports could design policies that incentivize critical infrastructure investments and the adoption of advanced technologies to improve port competitiveness. This is particularly relevant for foreign trade and economic development policies.
Justification for expansion and modernization policies
The comparison of ports that are consistently efficient across both models (with and without weight restrictions) suggests that factors like container volume handled and adequate infrastructure are key determinants of efficiency.
Practical implication: Ports like Guangzhou and Bangkok can continue to expand capacity and modernize their terminals to maintain or enhance global competitiveness.
Policy implication: Port authorities and policymakers can use these results to justify investments in the expansion of strategically efficient ports, maximizing their impact on regional and national economies.
Strategies for improving inefficient ports
The persistently low efficiency of ports like Tanjung Pelepas and Lázaro Cárdenas highlights the need for specific adjustments to improve both their technical and allocative capacity.
Practical implication: These ports should focus on increasing container volume and improving the utilization of their facilities, as operating below capacity diminishes overall efficiency. Adopting technologies that improve resource planning and port management could be a viable solution.
Policy implication: Policies could be established to encourage public-private partnerships, tax incentives or subsidies to enhance capacity and operational efficiency in these ports, maximizing their contribution to trade and economic growth.
Review of business models in less efficient ports
The low revenue efficiency of ports like Tanjung Pelepas, despite being technically efficient, suggests that their business model is not optimized for revenue maximization.
Practical implication: Managers of these ports should reconsider their revenue generation strategies by reviewing aspects such as service pricing, cost structure and diversification of port activities.
Policy implication: Government policies could promote the implementation of more efficient business models that allow these ports to maximize their revenue potential, creating regulatory frameworks that support port activity optimization.
In practical and policy terms, these results highlight the importance of investments in infrastructure and technology, adopting more efficient practices in resource management and implementing public policies that promote the modernization and expansion of less efficient ports. Additionally, using weight restrictions in the DEA analysis offers a more precise and robust approach to efficiency evaluation, with important implications for strategic planning and policymaking in the port sector.
6. Conclusions
In this research, a revenue efficiency DEA model is presented using weight restrictions with variable returns to scale to assess the efficiency of 38 ports in the APEC region during the period 2000–2020. Port efficiency is evaluated in the presence of weight restrictions in technical, revenue and allocative efficiency during this timeframe. Revenue efficiency is determined based on cargo charges imposed by the ports. The weight restrictions, as detailed later, were derived with reference to the capacity of vessels for various cargoes, including containers, general cargo, bulk cargo, liquid cargo and passengers.
The introduction of weight restrictions in DEA models adopted to evaluate port performance is crucial for ensuring a more genuine assessment. Additionally, the low levels of technical, allocative and overall economic efficiency demand that the studied ports optimize their resource utilization and improve the combination of inputs and prices.
Ultimately, the significance of conducting such studies lies in the fact that measuring port efficiency serves not only as a crucial management tool for port operations but also as a fundamental contribution to the planning and operation of regional and national ports. In particular, the estimates made in this work highlight the need for Southeast Asian countries to implement port policies aimed at addressing low investment levels, energizing trade flows and optimizing the underutilized inputs available to ports.
The comparative analysis between the two non-parametric methodologies highlighted the robustness of results with the DEA weight restriction model. Notably, Guangzhou Harbor, Tianjin, Qingdao, Shanghai, Singapore, Keelung and Bangkok consistently emerged as the most efficient ports across all models. In contrast, Tanjung Pelepas and Lázaro Cárdenas exhibited the lowest levels of efficiency, attributed in part to their low annual container volumes and underutilization of dock and container terminal surfaces.
The findings underscore the significance of considering weight restrictions in DEA models for a more authentic assessment of port efficiency. The identified efficient ports, particularly in China and Southeast Asia, point to successful strategies in infrastructure investment, advanced technology adoption and efficient resource management. These ports have evidently positioned themselves as key players in the global maritime trade network.
The low efficiency levels observed in Tanjung Pelepas and Lázaro Cárdenas highlight potential areas for improvement. The underutilization of terminal surfaces and low container volumes suggest the need for strategic investments, process optimizations and possibly the implementation of modern technologies to enhance operational efficiency.
Furthermore, the results emphasize the importance of diversified cargo handling, including general cargo, liquid cargo, bulk cargo, containers and passenger services. Efficient handling across these categories contributes to the overall success of a port, aligning with global trade demands and ensuring a competitive edge.
In conclusion, this study provides valuable insights into the efficiency dynamics of APEC region ports. The identified patterns and disparities offer a foundation for future policy considerations and strategic planning aimed at enhancing the efficiency of less performing ports and sustaining the success of highly efficient ones.
Moreover, the study highlights the importance of continuously monitoring and adapting to evolving global trade dynamics. Ports must remain flexible and responsive to changes in cargo types, technological advancements and economic conditions. In particular, fostering innovation in automation, digitalization and environmental sustainability key for ports to remain competitive in the future. Ports that embrace these trends will not only improve their operational efficiency but also position themselves as critical hubs in the shifting global supply chain landscape.
Future lines of research could explore several avenues to deepen the understanding of port efficiency: incorporating environmental efficiency, impact of technological innovations and exploring the role of policy and regulation.

