1-20 of 20763
Keywords: VIKOR
Close
Follow your search
Access your saved searches in your account
Would you like to receive an alert when new items match your search?
Journal

Advancing the field of management with novel informative content and powerful implications for business scholars leaders and professional managers.
Journal Articles
Adapting teams to Human–AI collaboration: purposive programs and distinction-based task performance
Open Access
Journal:
Management Decision
Management Decision 1–17.
Published: 23 June 2026
in Adapting teams to Human–AI collaboration: purposive programs and distinction-based task performance
> Management Decision
Published: 23 June 2026
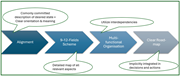
Figure 1 Distinction-based pathway to navigate complexity Source: Authors own illustration A flowchart illustrating a distinction-based pathway to navigate complexity. A flowchart illustrating a distinction-based pathway to navigate complexity. The flowchart consists of four main stages arrang... More about this image found in Distinction-based pathway to navigate complexity Source: Authors own illust...
Journal Articles
Performance interplays: host market institutional factors and divestment of foreign subsidiaries
Available to Purchase
Journal:
Management Decision
Management Decision 1–20.
Published: 22 June 2026
Research model. Source: Authors’ own work A flowchart illustrating the f...
Available to Purchase
in Performance interplays: host market institutional factors and divestment of foreign subsidiaries
> Management Decision
Published: 22 June 2026
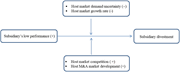
Figure 1 Research model. Source: Authors’ own work A flowchart illustrating the factors leading to subsidiary divestment. The flowchart illustrates the factors contributing to the divestment of a subsidiary. It starts with the subsidiary's low performance, which is influenced by two factors: h... More about this image found in Research model. Source: Authors’ own work A flowchart illustrating the f...
Journal Articles
Journal:
Management Decision
Management Decision 1–31.
Published: 22 June 2026
.... Liu et al. (2013) propose a hybrid MCDM model that combines a decision-making trial and evaluation laboratory (DEMATEL), a DEMATEL-based analytic network process (DANP), and VIseKriterijumska Optimizacija I Kompromisno Resenje (VIKOR) to improve a metro-airport connection service to develop...
Includes: Supplementary data
Journal Articles
From disruption to collaboration: GenAI-driven value in the face of geopolitical challenges
Available to Purchase
Journal:
Management Decision
Management Decision 1–23.
Published: 22 June 2026
Includes: Supplementary data
Journal Articles
Published: 22 June 2026
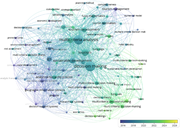
Figure 1 Evolution of the scientific landscape over time A network diagram showing the evolution of the scientific landscape over time. A network diagram illustrating the evolution of the scientific landscape over time. The diagram features various interconnected nodes representing different s... More about this image found in Evolution of the scientific landscape over time A network diagram showin...
Published: 22 June 2026
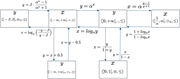
Figure 2 Real Alo-groups and related isomorphisms. Source Cavallo (2025) Diagram illustrating real Alo-groups and related isomorphisms. The diagram illustrates real Alo-groups and related isomorphisms. The rectangles represent the real Alo-groups and the arrows represent the isomorphisms and... More about this image found in Real Alo-groups and related isomorphisms. Source Cavallo (2025) Diagra...

Published: 22 June 2026
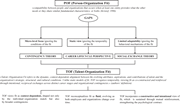
Figure 3 Framework of the model Flowchart of a model framework with nine steps. Steps 3-5 integrate the algebraic approach. The flowchart illustrates a model framework with nine steps. Step 1 involves the identification of the decision matrix. Step 2 focuses on the identification of the refere... More about this image found in Framework of the model Flowchart of a model framework with nine steps. S...
Published: 22 June 2026
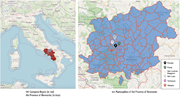
Figure 4 Map of the six municipal administrations of the province of Benevento, Italy A map of the province of Benevento in Italy, highlighting six municipal administrations. A map of the province of Benevento in Italy, highlighting six municipal administrations. Panel (a) shows the Campania R... More about this image found in Map of the six municipal administrations of the province of Benevento, Ital...
Published: 22 June 2026
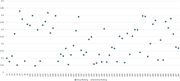
Figure 5 Sensitivity analysis of DMs' weights A scatter plot of sensitivity analysis of DMs' weights. A scatter plot illustrates a sensitivity analysis obtained by varying the DMs' weights. The x-axis represents the alternatives, from a1 to a68, while the y-axis indicates the global priority v... More about this image found in Sensitivity analysis of DMs' weights A scatter plot of sensitivity analy...
Published: 22 June 2026
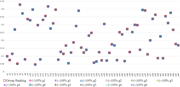
Figure 6 Sensitivity analysis of variations of criteria weights A scatter plot showing the sensitivity analysis of variations of criteria weights. A scatter plot illustrates a sensitivity analysis obtained by varying the criteria weights. The x-axis represents the alternatives, from a1 to a68,... More about this image found in Sensitivity analysis of variations of criteria weights A scatter plot sh...
Published: 22 June 2026
Figure 1 From the POF to the TOF perspective. Source: Authors’ own work A diagram illustrating the transition from POF to TOF perspective. The diagram illustrates the transition from the Person-Organization Fit (POF) to the Talent-Organization Fit (TOF) perspective. It starts with the definiti... More about this image found in From the POF to the TOF perspective. Source: Authors’ own work A diagram...
Conceptual framework. Source: Authors A conceptual framework diagram ill...
Available to Purchase
in From disruption to collaboration: GenAI-driven value in the face of geopolitical challenges
> Management Decision
Published: 22 June 2026
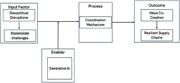
Figure 1 Conceptual framework. Source: Authors A conceptual framework diagram illustrating the relationship between input factors, enablers, processes, and outcomes. A conceptual framework diagram illustrating the relationship between input factors, enablers, processes, and outcomes. The diagr... More about this image found in Conceptual framework. Source: Authors A conceptual framework diagram ill...
Proposed integrated framework for value co-creation and resilient supply ch...
Available to Purchase
in From disruption to collaboration: GenAI-driven value in the face of geopolitical challenges
> Management Decision
Published: 22 June 2026
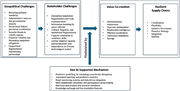
Figure 2 Proposed integrated framework for value co-creation and resilient supply chains. Source: Authors A diagram of an integrated framework for value co-creation and resilient supply chains. The diagram illustrates an integrated framework for value co-creation and resilient supply chains. I... More about this image found in Proposed integrated framework for value co-creation and resilient supply ch...
Journal Articles
Journal Articles
Managing internal coopetition in a post-acquisition process
Available to Purchase
Journal:
Management Decision
Management Decision 1–20.
Published: 19 June 2026
Competition level evolution and acquisition dynamics. Source: Authors’ own ...
Available to PurchasePublished: 19 June 2026
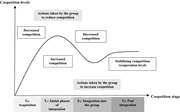
Figure 1 Competition level evolution and acquisition dynamics. Source: Authors’ own work A line graph depicting the evolution of coopetition levels over different stages of acquisition. A line graph titled ‘Coopetition levels’ on the vertical axis and ‘Coopetition stage’ on the horizontal axis... More about this image found in Competition level evolution and acquisition dynamics. Source: Authors’ own ...
