This study examines how trade credit from suppliers/buyers affects entrepreneurs' corruption perception (as an obstacle) in emerging economies. Specifically, we argue that the relationship between the degree of trade credit and corruption perception is curvilinear, with trade credit initially increasing corruption perception and then subsequently decreasing this perception. Given the central role of state actors in situations of corruption in economies around the world, we explore the role that state ownership plays in the relationship between trade credit and corruption.
The data consists of 14,922 nascent firms across 142 emerging economies. We analyzed the data using ordinary least squares (OLS) and ordered probit regression models. In robustness checks, we also conducted three-stage least squares (3SLS) simultaneous equation models.
The results support the key hypothesis of a curvilinear U-shaped relationship. Furthermore, the findings indicate that the inverted U-shaped effect is accentuated for state-owned enterprises.
Given the adverse impact of corruption as a constraint on entrepreneurial and country development in emerging economies, our study offers novel insights into how trade credit power dynamics in entrepreneurial resource mobilization affect new firms' corruption perception. Moreover, our study advances the literature by empirically teasing out the endogeneity between trade credit and corruption. In effect, we demonstrate that even though corruption might lead to trade credit situations, trade credit also encourages corruption in a non-linear fashion. Given that bootstrapping methods such as trade credit indicate entrepreneurial resourcefulness, this research addresses recent calls to highlight the adverse effects of resourcefulness.
Introduction
Corruption is a significant and pervasive problem in both emerging and advanced economies around the world (Belitski et al., 2016; Cuervo-Cazzura, 2016; Davis and Ruhe, 2003; Hoskisson et al., 2000; Luo, 2002, 2011; Olarewaju et al., 2025; Petrou, 2015; Yi et al., 2023). Broadly, corruption is defined as the misuse of authority for personal, sub-organizational or/and organizational gain (Ashforth and Anand, 2003). Corruption can occur in many forms, including bribery, embezzlement, money laundering, nepotism and procurement fraud. The most compelling evidence in the literature is consistent with the notion that corruption is overwhelmingly detrimental (not beneficial) to firms and economies (Davis and Ruhe, 2003; Getz and Volkema, 2001; Kalyuzhnova and Belitski, 2019).
At the same time, emerging economies are marked by severe conditions of resource (economic) scarcity for individuals, entrepreneurs and new firms (Luo, 2011), which are inextricably linked with corrupt practices in such economies. Getz and Volkema (2001) argue that environments characterized by severe economic scarcity threaten the most fundamental human needs such as food and shelter, which may increase an agent's propensity to take ethical risks. In an environment of scarce resources, financial bootstrapping (i.e. accessing resources neither owned nor controlled by the firm) is a common and resourceful strategy that entrepreneurs use to respond to resource paucity in their environments (Barrot, 2016; Lange et al., 2024). Among several bootstrapping tactics, supplier/customer financing (also, trade credit) type of bootstrapping is a prominent source of financing for many new firms (Barrot, 2016; Cai et al., 2023).
Despite the established link between corruption and environmental resource scarcity, little is known about how this interplay affects entrepreneurs. Reflecting on the duality of pervasive corruption and often-extreme resource scarcity in emerging economies that many new firms face highlights an important research question: How does bootstrapped financing affect new firms' perception of corruption as an obstacle in emerging economies? To address this overarching question, we turn to resource dependence theory. Resource dependence theory (RDT) suggests that new firms depend on their environment for the resources that they need for survival and growth (Ebben and Johnson, 2006; Pfeffer and Salancik, 1978). As such, RDT is a relevant theoretical lens for addressing this research question. Relatedly, we further explore how state ownership influences the relationship between trade credit and corruption perception. State/government actors are often central in situations of externally driven corruption (Collins et al., 2009; Ferris et al., 2021).
This study presents an analysis of cross-sectional data on 14,922 firms in six regions of the world. The analytical procedures of this research utilized an ordinary least squares (OLS) approach and ordered probit approach. However, the robustness checks consider an alternative modeling approach that accounts for endogeneity due to potential simultaneity bias in the model. Furthermore, the findings are robust to alternative measurements of the independent variable, winsorizing of extreme values of the independent variable and alternative explanations for the observed empirical relationship. The results indicate broad support for the central thesis of the study. However, the results also indicate notable inter-regional variation in the strength of statistical effects. These findings contribute to the literature by explicating the implications of corruption and the dynamic interplay between resource scarcity and power mechanisms in supplier/customer related bootstrapping in new firms.
Resource dependence theory
Resource dependence theory (RDT) proposes that firms are open systems, implying that the interplay between the external environment and what happens within the firm is a critical part of what determines the firm's performance (Casciaro and Piskorski, 2005; Hillman et al., 2009; Pfeffer and Salancik, 1978). Firms continually interact with the external environment through the interdependent exchange of resources, information and feedback for responsiveness to the environment. Thus, this continuous exchange of resources implies that when power differences emerge between organizations and other entities which hold key resources, these dependencies can drive decision making in the organization, as these decision makers attempt to reduce the outside forces of power that constrain their decisions. Importantly, the treatment of power in the RDT literature recognizes that power is an artefact of the social relation and not an attribute of the agent (i.e. entrepreneur or financier; Emerson, 1962). This relational property of power is important in the entrepreneurship context because it implies that there is no predefined subservient organization to other organizations. Rather, it is the context of the social relationship between the organization and others that determines which organization holds the power advantage in the relationship. This challenges the notion that new firms are always weak partners related to their more established partners (see Katila et al., 2008).
In sum, the key tenets of RDT (Hillman et al., 2009; Pfeffer and Salancik, 1978) assert that firms are constrained by interdependencies with other organizations, which in turn create power dynamics that constrain and influence the strategies and tactics decision makers in the firm use to address power differentials and attempt to gain power for their organization. Among several organizational tactics used to respond to power imbalances in their environment, constraint absorption is the only tactic that allows the dependent organization to control the resources that made them dependent in the first instance (Casciaro and Piskorski, 2005). Thus, constraint absorption involves a mechanism whereby the dependent organization gains partial or complete control rights over the resources it needs.
Using RDT as a guiding theoretical framework, we propose that these power dependencies are critical to understanding how new firms are affected by trade credit and how this in turn can influence entrepreneurial perceptions of corruption. According to RDT, firms will align their decisions regarding structure, inter-organizational relationships and adaptation to the environment to maintain access to critical resources. Thus, if the external environment they operate within has normalized unethical practices and rampant corruption, a firm in that context is also likely to align its structures and practices to the norms of the environment to maintain access to resources needed for the organization to survive. Entrepreneurs do not pursue opportunities in isolation. Instead, entrepreneurial activities are inextricably linked to economic, community and cultural forces (Greve and Salaff, 2003; Roundy, 2025).
Given the scarcity of resources in developing economies and ambiguity in trade regulations and policies, there is a heightened tendency for corrupt practices or the perception of corruption thereof (Petrou, 2015). In less developed countries, access to information and resources is often limited to a few privileged firms with political connections; therefore, businesses engage in corrupt practices to facilitate business transactions. In some economies, it is common to make small, routine payments made to ministerial or clerical foreign officials merely to expedite or secure the performance of a routine, non-discretionary governmental action. The “greasing wheels” hypothesis posits that bribery reduces the transaction costs associated with dealing with inefficient bureaucracies (Audretsch et al., 2022; Belitski et al., 2016, 2026). Corruption may serve to negotiate business conditions, especially in resource-dependent environments (Kalyuzhnova and Belitski, 2019). Resource dependence is a key issue impacting entrepreneurial activities in developing economies, as acute reliance on external players' resources creates uncertainty about a firm's survival.
The curvilinear effect of trade credit
Bootstrapped finance is a ubiquitous strategy for financing new firms around the world. Bootstrapping includes creative and imaginative strategies for new firms to gain control of needed resources. Thus, it entails decreasing capital requirements, increasing cash flows and leveraging personal sources of financing (Ebben and Johnson, 2006). Entrepreneurs can engage in bootstrapping in two ways, i.e. by creatively gaining funding without resorting to financial institutions or equity sources of finance or by eliminating or diminishing the need for funding by creatively securing resources at little or no cost to the firm (Harrison et al., 2004). Trade credit offers new firms the ability to control needed financial resources (e.g. working capital) from immediate value chain partners through advance payments from buyers (i.e. delayed delivery of goods and services) or delayed payments to suppliers (Barrot, 2016; Ebben and Johnson, 2006; Giannetti et al., 2008; Peterson and Rajan, 1994, 1997; Uzuegbunam and Uzuegbunam, 2018).
Trade credit is often facilitated by close connections or proximity between suppliers and customers and the entrepreneurial firm. Such connections offer suppliers/buyers an advantageous position to monitor the firm, thereby reducing information asymmetries between entrepreneurs and financiers (Burkart and Ellingsen, 2004). But such bootstrapping finance from suppliers and buyers might also lead to a new firm being cash strapped, imposing an undue burden on entrepreneurs, which might increase their exposure to corrupt practices or agents.
We expect that with increasing levels of trade credit in new firms, the dependence of firms on their network of suppliers and customers for resources to produce goods and services will also increase (Katila et al., 2008). Consequently, trade credit implies an organizational context of resource scarcity where a young firm might not have slack resources to meet other obligations like paying taxes, covering their utilities and servicing any personal or company loans that already exist. These are all common circumstances in new firms. These obligations could increase the external pressure on entrepreneurs from others in their network to behave unethically (Belitski et al., 2016), because they are unable to respond effectively to the economic demands on their business due to the limited financial resources available to them. Thus, as the level of financial bootstrapping increases, it imposes a significant economic constraint on entrepreneurial attention to information from external obligations, thereby making them (as less powerful actors) more susceptible to corruption constraints from other actors in their environment on which they depend on. Part of the susceptibility of new firms to corruption is due to increasing levels of dependence on value chain partners, who might be a source of corruption themselves. Indeed, though sources of corruption can be governmental, the new firm might also be involved in corruption situations with its buyers and suppliers (Luo, 2002).
However, beyond a certain threshold of trade credit, the potential for financial economies within the focal firm rises because the new firm has earned significant slack resources as working capital from the extent of customer advances they have received, or the amount of supplier credit offered to them. Paradoxically, this changes the calculus of dependence between the new firm and actors in their immediate networks in the following ways. First, by yielding such proportionally higher levels of credit to a new firm, suppliers and customers are potentially signaling that they have gained some positive information about the venture's viability or capabilities (Burkart and Ellingsen, 2004). This could also imply that new firms in such situations might be able to charge a higher premium to customers for the payment advances or receive lower costs from their suppliers who are willing to offer such elevated levels of credit. In turn, new firms with this level of trade credit may have more slack resources to address other firm obligations in a manner that avoids cutting ethical corners or falling prey to pressures from corrupt actors.
Second, such higher levels of trade credit inadvertently reveal that the position of the firm in their value chain has a substantial impact on the objectives of their suppliers and customers. That is, when a new firm operates with significantly higher levels of credit from its suppliers or significantly higher advances from its customers, it indicates that its power position relative to firms in its value network might be advantageous. Such stronger network positions can also provide a fulcrum for the firm to minimize opportunities for corrupt agents to extract rents from the firm. Thus, at this extremely high level of trade credit, new firms may have established the necessary financial and reputational standing to proactively address overtures and constraints from potentially corrupt agents or situations in their environment.
In sum, we posit an integrated view of bootstrapping that is both a function of resource scarcity and power imbalance in new firms' networks (see Ebben and Johnson, 2006). This view recognizes that new firms might lean on their customers and suppliers for funds because they are faced with resource scarcity stemming from the liability of newness (Stinchcombe, 1965) but also from overall adverse economic conditions, limiting their alternatives. In this regime, new firms are likely to be more subservient to their trade credit partners given the initial power imbalance that comes from new firms' newness in their environment, and the resulting resource scarcity thereof. Such conditions of resource paucity can increase a new firm's perception of corruption.
Moreover, RDT embraces the notion that as firms develop a “credit history” within their networks, entrepreneurs may strategize to pursue trade credit strategy more aggressively because they have earned trust among their partners. At this point, a new firm has potentially gained some legitimacy among its network of buyers and suppliers, where these partners are now dependent on the firm for valued resources. In this regime, new firms have created a situation of mutual dependence between them and their customers and suppliers. This mutual dependence creates an incentive for constraint absorption (Casciaro and Piskorski, 2005). Thus, by enabling very high levels of trade credit, the entrepreneurs can absorb their initial constraint relative to their financial dependence on their value chain partners. This earned trust and power balance may also enable a stronger position to rebuff corrupt practices (Hillman et al., 2009; Petrou, 2015). Thus, extremely elevated levels of trade credit might indicate that the focal firm gained more opportunities for financial economies, and may have neutralized the previous power imbalance with trade credit providers (i.e. suppliers and buyers), thereby limiting the firm's corruption perception:
Trade credit exhibits a curvilinear relationship (inverted U-shaped) with corruption perception in new firms such that as the level of trade credit increases from low to moderate levels, perceived corruption increases; then from moderate to higher levels of trade credit, perceived corruption decreases.
The arguments in the preceding hypothesis acknowledge the view that corruption can often emanate from governmental or non-governmental sources (e.g. suppliers and buyers). For instance, corruption in taxes enabled by government agents can be a significant problem in many economies (Belitski et al., 2016; Kalyuzhnova and Belitski, 2019). We now consider below the contingent impact of government/state ownership in the new firm on the main empirical relationship between trade credit and corruption perception. We note that certain new firms in emerging economies often have some degree of government ownership.
The moderating impact of state ownership
Government officials are often key actors in corruption situations (Cuervo-Cazzura, 2016; Kalyuzhnova and Belitski, 2019), where they engage in “misuse of public office for private gain” (Svensson, 2005, p. 20). Indeed, government institutions have stronger influences on firms in emerging economies than on their counterparts in developed economies (Hoskisson et al., 2000). For example, Yi et al. (2023) argue that bribery propensity in emerging economy firms is heightened because firms often depend on state officials for administrative processes such as government approvals and regulatory matters. Consequently, government/state ownership of a new firm is a key moderator in the analysis of trade credit effects on corruption in new firms.
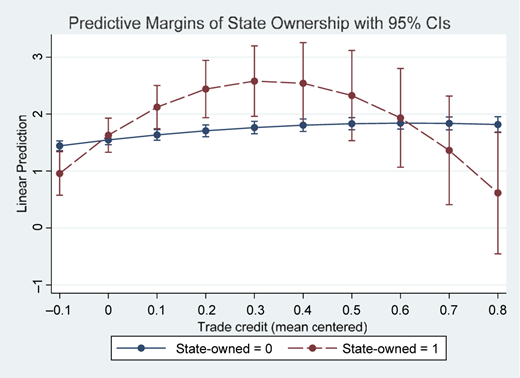
We conjecture that state ownership of new firms (i.e. state-owned enterprises, SOEs) would accentuate the inverted U-shaped effect of trade credit on corruption. As the level of trade credit increases in SOEs, state presence in the firm might introduce bureaucracy into the management of the enterprise. Such bureaucratic tendency in SOEs stems from the intrinsic tension between state owners focus on social and political concerns and managerial focus on market efficiency (Chen et al., 2006; Wang et al., 2022). As SOEs seek to resolve this tension amidst increasing levels of trade credit, firms are likely to experience situations of resource scarcity, thereby accentuating the positive effect of low to moderate levels of trade credit on corruption at the firm level.
However, at higher levels of trade credit utilization, SOEs' strong ties to the government will begin to serve as a reinforcement for the firm's power position with suppliers and buyers. This reinforcing relationship will function as a deterring or minimizing mechanism against corruption. For instance, state-owned firms in emerging economies may face less administrative hurdles that are typically associated with obtaining operating licenses and government approvals that are needed to operate (Yi et al., 2023). This sort of preferential treatment may even rise to certain government waivers or special licenses for such SOEs. The mutually reinforcing effect between the level of trade credit and state ownership at higher utilization of trade credit will further reinforce the power position of the new firm relative to other actors in their network, thus making them less susceptible to corruption. In sum, these arguments predict a more pronounced inverted U-shaped relationship between trade credit and corruption:
State ownership moderates the effect of trade credit on perceived corruption by accentuating the trade credit–perceived corruption curve.
Method
Sample
The study leveraged data from the World Bank Enterprise Surveys (WBES) on establishments that are based in 142 countries around the world. These surveys were conducted between 2006 and 2021. The data is cross-sectional. We narrowed the sample in the following ways. First, we only included firms that are eight years or younger, consistent with prior entrepreneurship studies on nascent firms (e.g. Uzuegbunam and Uzuegbunam, 2018). This is consistent with the focus of the study in understanding the effects of trade credit in firms that are exposed to the liabilities of newness (Stinchcombe, 1965). Second, we excluded large firms and focused on small-to-medium sized firms in the sample to further identify the entrepreneurial firms in the sample (Ullah, 2020) [1]. The final sample used in the study included 14,922 firms from 142 transition and developing economies (i.e. emerging economies). This highly representative sample provides a broad coverage of firms across economies in six regional World Bank classifications of the world within the timeframe of the study including Africa (AFR), East Asia and Pacific (EAP), Europe and Central Asia (ECA), Latin America and Caribbean (LAC), Middle East and North Africa (MENA) and South Asia (SAR).
Measures
Independent variable. The independent variable in this study, trade credit, is measured as the proportion of a new firm's working capital that is attributed to supplies purchased on credit or advances received from the customer. The values of this variable range from 0 to 1.
Dependent variable. The dependent variable is an ordinal measure that ranges from 0 to 4, capturing the firm's responses to the following question: “How much of an obstacle is corruption to the current operations of this establishment?” (Olarewaju et al., 2025; Zhu and Zhang, 2016). On this scale, 0 represents “no obstacle”, while 4 represents “severe obstacle”.
Control variables. A key control variable, which also serves as a moderating variable, is an indicator of government or state ownership in the new firm. This is a dummy variable, which is assigned 1 if the state owns a portion of the new firm and assigned 0 otherwise (Cai et al., 2023). In addition, we control for the effect of several owner-level, firm-level and country-level factors that may also have a bearing on the dependent variable. At the owner/top manager level, we include controls for female ownership, largest owner’s share and prior experience of the top manager. These variables are theoretically important according to human capital theory (HCT) as they affect the human capital employees bring to the firm. Prior studies have shown that these variables impact outcomes in new firms (e.g. Uzuegbunam and Uzuegbunam, 2018). We also account for firm-level factors that reflect an underlying tendency to grow the firm, including formal training for employees, and whether the firm has an international certification. Furthermore, we include controls for the firm size, firm age, whether the firm is a manufacturing firm and whether the firm is local to a small population center (<50,000 people). According to both RDT (Roundy and Bayer, 2019) and HCT, these are theoretically important contextual variables that may influence the nature of resource dependence and the impact of human capital (Marvel et al., 2016). In addition to these control variables, we include several dummy variable controls to proxy for unobserved year fixed effects, region fixed effects, country fixed effects and industry fixed effects. Again, these are important to include because these variables can affect the nature of resource dependence and human capital, and thus we control for these variables to ensure we are investigating the proposed theoretical relationships (Bernerth and Aguinis, 2016). A full list of all relevant study and control variables and their descriptions is shown in Table 1 below.
Findings
Main findings
Table 2 captures the summary statistics and bivariate correlations for the relevant variables in this study. We note that the bivariate correlation between corruption and trade credit is positive and statistically significant (r = 0.1, p < 0.01). This is consistent with our expectation in Hypothesis 1 that the main effect of trade credit on corruption perception is positive. We also glean from Table 2 that state ownership has a statistically insignificant relationship with corruption perception.
The OLS regression models shown in Table 3 evaluate the study hypotheses. Model 1 presents the base model, which includes all control variables as well as year and region fixed effects. Model 2 includes the main effect of trade credit. In Model 3, we introduce the squared term of trade credit. We note that trade credit is mean centered before the variable is used in squared or interaction terms. Mean centering involves subtracting the mean of this variable from all observations before entering into the analysis. As shown in Table 2, the measure ranges from 0 to 1. Models 4 and 5 include the linear and non-linear moderating effects of state ownership, respectively. Models 6 and 7 include all the variables in Model 5, with the addition of industry fixed effects in Model 6, and country fixed effects in Model 7. Results in Models 5, 6 and 7 are qualitatively similar. However, due to the introduction of several additional fixed effects in Models 6 and 7, some variance inflation factors (VIFs) in these models are above the recommended ceiling of 10. In contrast, the maximum and average VIFs in Model 5 are 5.25 and 2.06 respectively. We therefore focus on interpreting results in Model 5.
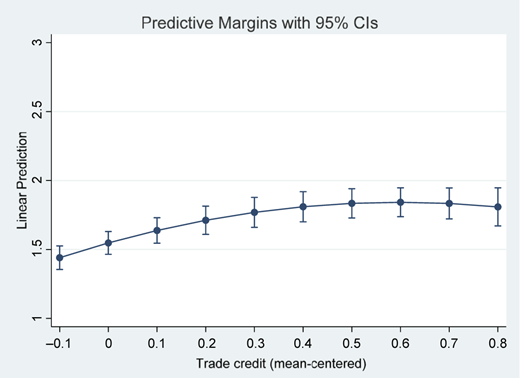
The significance of the relevant variables was determined using two-tailed tests of the p-values. As predicted in Hypothesis 1, Model 5 shows that trade credit has a positive and statistically significant effect on corruption perception (β = 0.953; p < 0.01), while trade credit squared has a negative and statistically significant effect on corruption perception (β = −0.770; p < 0.01). Together, these two results suggest a non-monotonic relationship between trade credit and corruption perception. This predicted curvilinear relationship is illustrated in Figure 1, including the 95% confidence interval. Model 5 also shows the result of the interaction effect between trade credit and state owned. In this model, the linear interaction between trade credit and state owned is positive and statistically significant (β = 4.877; p < 0.01), while the non-linear interaction between state credit squared and state-owned is negative and statistically significant (β = −8.101; p < 0.01). Figure 2 confirms the predicted interaction effect by showing that the inverted U-shape is accentuated for state-owned firms. However, we note that this current result pertaining to the moderating effect of government ownership should be interpreted as exploratory, given the limited variation in the government ownership variable (Please see Appendix A). This is a limitation of our study, which we address more fully in the discussion section.
Formal test of inverted U-shape relationship
To formally assess for an inverted U-shaped relationship, we follow steps from Lind and Mehlum (2010) and Haans et al. (2015). We report these results in Table 4. In addition, we also evaluate whether the turning point of the financial bootstrapping (trade credit) curve exists within the actual data range of the trade credit variable (i.e., 0 to 1). This test is deployed through the utest syntax in Stata. Since we used mean centered observations (see above description of the interaction and squared term models), we need to add back the mean to the turning point calculated from utest estimates to get the true turning point (see Haans et al., 2015). The mean value of trade credit is 0.086. The extreme point is 0.595. Therefore, the true turning point was 0.595 + 0.086 = 0.681 (95% CI: 0.463–0.898). Since our confidence interval lies within the observed range of trade credit in our data (i.e. 0–1. See Tables 2 and 5), this demonstrates a high level of confidence that the inverted U-shaped is supported at the turning point level. This indicates a point where 68.1% of the firm's working capital is from customer advances/supplier credit. The model in Table 4 below indicates that the lower bound slope is positive while the upper bound slope is negative. The p-values of both slopes were statistically significant. We note that both the lower and upper bounds are within the data range for trade credit. Thus, we claim support for the hypothesized curvilinear relationship between trade credit and corruption.
Nevertheless, our calculations in Stata reveal that only 3.5% of firms in our sample fall above the turning point of 68.1% [2]. Since only a small percentage of firms are above the turning point of the inverted U-shape, we submit that this quadratic effect result and its implications must be interpreted cautiously.
Robustness checks
In robustness checks, we consider two empirical issues that may affect the consistency of our OLS estimates. First, findings from a recent study suggest that there is a potential for simultaneity bias between the dependent variable (corruption perception) and the independent variable (trade credit). In this recent study, Cai et al. (2023) show that local corruption in China adversely affects trade credit. This implies that corruption perception and trade credit are endogenous variables due to the simultaneity between the two variables. Such endogeneity might result in inconsistent estimates in an OLS system. We utilize the three-staged least squares regression (3SLS) simultaneous equation modeling approach in our robustness checks to isolate the effect of trade credit on corruption perception while controlling for the effect of corruption perception on trade credit. The simultaneous equation models, Model SE1 and SE2, report coefficients using 3SLS regression, with seemingly unrelated regression (SUR) option. A formal employee training program is an instrument in the corruption equation in Models SE1 and SE2, while internally generated funds and the largest owner share of a firm are the instruments for trade credit in Models SE1 and SE2.
Second, the ordinal nature of the dependent variable suggests that an ordered probit regression model might be more appropriate than OLS (see Olarewaju et al., 2025; Ullah, 2020). Thus, we also implemented an ordered probit analytical approach (oprobit command in Stata). These results using these alternative modeling approaches are qualitatively similar to the estimates from the main OLS results. See Table 6 for these results.
We assessed the sensitivity of the results relative to trimming/winsorizing the upper tail of the trade credit (independent variable) distribution, due to concerns about whether the inverted U-shape is driven by extreme observations. The 95th percentile of the continuous trade credit measure is 0.5 and the 99 percentile is 1 (Please see Table 5 for detailed percentiles). In Models 2 and 3 in Table 7, we report the results of our analysis of the winsorized samples (of the upper tail) trimming off the 99 and 95 percentiles, respectively. The results of the winsorized samples are consistent with the inverse U-shaped hypothesis. Nevertheless, the interaction effect is less significant. Again, we note that this is possible due to the limited variance in the state ownership variable.
Furthermore, it is possible that our interpretation of high trade credit as correlated to stronger power may be a misinterpretation of new firms experiencing distress, and thereby needing more trade credit (e.g., inability to access bank finance). If this was the case, we would expect the results to be different for firms that receive bank financing. On the contrary, per our subsample analysis results reported in Table 7, Models 4–9 demonstrate that the results are robust for firms that have received funding from banks, private commercial banks (PCB) or from state-owned banks or government agencies. Specifically, Models 4, 6 and 8 capture new firms that received financing from banks, private commercial banks and state-owned banks/government agencies funding, respectively. These findings further reinforce our claims about power dynamics operating in the relationship between new firms and their suppliers/buyers relative to the firm's perception of corruption as an obstacle.
We also conducted a series of exploratory analysis related to the moderating impact of state ownership. Instead of the initial dummy variable, we considered a continuous variable measure of state ownership (i.e., ranging from 0 through 1, where 0 is 0% of government ownership and 1 indicates 100% government ownership, please see Appendix A for descriptives). The results using this alternate measure are shown in Table 7. Moreover, in addition to the primary dummy variable measure we use in the main analysis, we also report an additional dummy variable with a different cutoff, as shown in Appendix B. The results of these robustness checks are qualitatively similar across for Models 1–8 only in Appendix B. Given the limited variance in this variable in our dataset (i.e., sparsity in government ownership variable), we note that the findings in Appendix B are exploratory and should be interpreted with caution. We call for more research that can more definitely evaluate the impact of government ownership in the primary relationship in this study.
Finally, we checked for the sensitivity of the results across different regional subsamples. The results of this analysis are presented in Table 8. Model 1 in Table 8 shows support for the curvilinear hypothesis for the African Subsample. Similarly, the subsample result of ECA countries documented in Model 3 of Table 8 also supports the curvilinear effect of trade credit on corruption. Though the EAP, MENA and SAR subsample results in Models, 2, 5 and 6 respectively indicated consistent directions in the coefficients of trade credit and trade credit squared, these results are insignificant using the strict two-tailed tests for assessing p-values. The subsample sensitivity tests also revealed the moderating impact of state ownership in the ECA) subsample. The other subsamples did not evidence any statistically significant interaction effects. We note that these post hoc findings are exploratory, and preliminary given the omission of some variables in certain regions due to collinearity.
Discussion
This study examined the relationship between bootstrapping and corruption perception in new firms. By focusing attention on trade credit form of bootstrapping, we specified the contrasting effects of resource scarcity and power imbalances in exposing new firms to corruption. We addressed extant arguments on how resource scarcity and associated resourcefulness in the external environment and within new firms might increase the potential for corruption. We also suggest that extremely elevated levels of trade credit indicate a reordering of power imbalance between new firms and their network of suppliers and buyers. Such a power advantage in new firms provides leverage to dampen their exposure to corruption from actors in their networks. Thus, our work contributes to the entrepreneurship literature by highlighting the negative effects of resourcefulness strategies (see Lange et al., 2024).
Furthermore, our study contributes to resource dependence theorizing in new firms' contexts (e.g. Katila et al., 2008). Specifically, we demonstrate that power imbalances between new firms and resource providers are revealed in the extent of trade credit in the firm. In doing so, we demonstrate that bootstrapping not only reflects resource scarcity, as suggested by prior literature. Rather, it also entails (at high levels) a form of constraint absorption reflecting a firm's ability to exert influence on other entities in their environment – as demonstrated by our findings relative to corruption. This finding has implications for future work that seeks to examine other forms of bootstrapping in new firms from a resource dependence perspective. For example, it is possible that certain new firms that engage in resource sharing with other firms in the long term (see Ebben and Johnson, 2006) may be doing so for reputational reasons, not for economizing reasons. Theoretically, this implies that multi-theoretic lenses might be beneficial in future studies of financial bootstrapping.
Practically, the findings indicate that entrepreneurs would benefit from taking a more deliberate approach to bootstrapping or resourcefulness in general, as opposed to an emergent approach in response to resource scarcity. This would allow firms to better manage exposure to corruption. Since entrepreneurs around the world generally encounter resource scarcity situations, the findings of this research could also apply to entrepreneurs in advanced economies as well. From a policy perspective, policy makers should recognize the undue burden that bootstrapped entrepreneurs face in relation to corruption perception. Moreover, policy makers can leverage the findings from this research toward designing policies that can enable early-stage entrepreneurs to better manage the hazards of bootstrapped finance. For example, creating or incentivizing accelerator or incubator programs that provide early-stage funding to new firms might alleviate the financial pressures that push new firms toward corrupt practices, especially in societies where resources are very limited.
Limitations and conclusions
We submit that there are some limitations to this study, which provide opportunities for future research. First, we were unable to empirically tease out the different effects of supplier credit versus buyer advances due to data limitations. Future inquiries can leverage primary data that can better tease out this measure and to better specify the different mechanisms at work at the supplier side in contrast to the buyer side of the new firm. Second, the cross-sectional nature of the data limits our ability to infer causality from the analyses. Relatedly, while we theorize intervening mechanisms such as resource scarcity and power structures, we were unable to fully test these intervening mechanisms and offer more granularity in our findings. Future research can use a combination of qualitative and quantitative data to tease apart some of these intervening mechanisms. Third, our study focused on trade credit as an example of bootstrapping finance. However, it is possible that the theoretical mechanisms we highlighted might operate differently for distinct types of bootstrapping situations in new firms. More research inquiries into other forms of bootstrapping, and their concomitant effects on firms' outcomes are likely to offer richer insights for literature on entrepreneurship in emerging economies.
Additionally, the relational nature of trade credit suggests that future research should explore measures that incorporate dyadic and/or network level measures to further explore the interplay of trade credit and resources. Furthermore, other facets of human capital such as the personality of the entrepreneur could provide a more complete picture of how different facets of human capital predict the effectiveness of trade credit relations (Marvel et al., 2016).
Another limitation of this study is related to the measure of state ownership. Though we explored the moderating effect of state ownership using different measures, we submit that the highly skewed distribution of these measures in our sample implies that more work needs to be done to clearly ascertain how state ownership impacts the relationship between trade credit and corruption perception. Future research that employs primary data or qualitative data focused on identifying different mechanisms of state ownership or presence in the new firm (possibly at different levels of government) is likely to produce a clearer picture of the direct and indirect effects of state presence on the relationship between bootstrapped financing and corruption perception in new firms.
We concede that while the dependent variable of corruption perception in this study appears to capture a holistic view of entrepreneurial exposure to corruption in emerging economies, more work needs to be done to fully understand how trade credit and other bootstrapping approaches might impact different facets of corruption. Future research might explore this from a culturally contingent perspective by evaluating the role of cultural factors in either accentuating or diminishing the effect of trade credit on different facets of corruption across a culturally diverse range of developing economies.
In conclusion, our empirical account shows how trade credit in new firms affects a significant risk factor in new firm environments, i.e., corruption. By leveraging a large international dataset of new firms in emerging economies, we offered some evidence regarding how a new firm's entrepreneurial finance strategy might affect its exposure to unethical influences. We hope this study provides some ideas for future research that can enable scholars to gain a greater understanding of firm-level factors that can help entrepreneurs mitigate the adverse influence of corruption.
Notes
We note that the results are consistent when we relax this condition and include larger new firms in our analysis.
We are thankful to an anonymous reviewer for pointing out this critical calculation that reveals the percentage of firms above the turning point.
The supplementary material for this article can be found online.