Skip to article sections
Purpose

This study aims to investigate the impact of elections on social media adoption by local governments.

Design/methodology/approach

Local elections between 2007 and 2018, all 308 Portuguese municipalities and all 43 districts of the Lima metropolitan area (the capital city of Peru) were considered in the study. The impact of elections on each country was assessed by fitting a theoretical model to the social media adoption data (collected for Facebook, YouTube and Twitter). This theoretical model includes a normal curve (as predicted by the Diffusion of Innovation Theory) and negative exponential curves centered on the inauguration dates of the newly elected governments.

Findings

Results are impressive and consistent for both countries: following an initial period characterized by a normal adoption curve, there are notable surges in adoption associated with the inauguration dates of newly elected administrations. In a metaphorical sense, ballots make new waves of adoption.

Research limitations/implications

The findings suggest that researchers should take into account the influence of elections when examining how local governments adopt innovations.

Practical implications

The findings indicate that practitioners may find an opportunity to expedite the adoption of innovative communication technologies right after newly elected governments assume office. Additionally, election campaigns present a favorable occasion to demonstrate these innovations.

Originality/value

This is the first study to use non-linear optimizing techniques to explain the impact of elections on social media adoption by local governments.

Social media can be defined as “a group of Internet-based applications that build on the ideological and technological foundations of Web 2.0, and that allow the creation and exchange of user generated content” (Kaplan and Haenlein, 2010, p. 61). It encompasses social networking platforms such as Facebook, Myspace and LinkedIn, as well as media sharing services such as YouTube and Instagram and micro-blogging tools like Twitter. These applications have significantly transformed the manner in which individuals engage with one another, leading to a situation where social interactions are predominantly facilitated through technological means. The same applications “facilitate social interaction, make possible collaboration, and enable deliberation across stakeholders” (Bryer and Zavattaro, 2011, p. 327). In public organizations, social media applications contribute to increasing transparency, quality of policymaking and the provision of services, as well as creating greater involvement, allowing the public to contribute to the production of content, participate democratically and generate crowdsourcing solutions and innovations (Santoso et al., 2020).

Local governments present a compelling subject for social media research within the realm of governance due to their close relationship with citizens and the direct impact of their decisions on the community (Santoso et al., 2020). By leveraging social media platforms, local governments can engage citizens in a cost-efficient manner, thereby improving public relations, enhancing accountability and transparency and fostering collective problem-solving in the development of policies (Stone and Can, 2020).

Since the political process is highly based on social interaction, social media has the potential to boost citizen involvement in politics through communication, discussion and coordination of public and social activities (Criado et al., 2013; Sandoval-Almazan and Gil-Garcia, 2013). On one side, it has transformed the methods by which political campaigns are executed, the means through which politicians acquire and disseminate political information, the manner in which politics is learned, the modes of opinions and attitudes formation and the ways in which individuals engage with or withdraw from the political process (Dimitrova and Matthes, 2018). On the other hand, it can be used to streamline communication between citizens and governments. Certain scholars argue that it has the potential to enhance civic participation (Bonsón et al., 2017), promote transparency within government operations (Song and Lee, 2016), rebuild public trust in governmental institutions (Warren et al., 2014) and in general “close the gap between citizens and politicians” (Silva et al., 2019). Today, traditional mass media and government’s own communication channels are “insufficient to reach all target audiences, convey important public messages, and build meaningful and trustworthy relationships with certain citizens”, especially young citizens (Zumofen and Mabillard, 2024, p. 5).

Some of the factors that have been used to explain social media adoption by local governments are clearly related to the political sphere: ideology divide (Frías-Aceituno et al., 2014; Jans et al., 2016; Megdaglia, 2007; Panagiotopoulos et al., 2012), political competition (Silva et al., 2019; Faber et al., 2020) and political discontinuity (Silva et al., 2019). What makes these factors particularly intriguing is their potential to be affected by elections. On the one hand, the electoral process can contribute to strengthening or weakening political competition (Fisher and Denver, 2009; Sudulich et al., 2013). On the other hand, elections can lead to shifts in power dynamics, fostering political discontinuity and prompting a reorientation of governmental ideology (Fisher et al., 2011; Gschwend and Zittel, 2015). However, the direct impact of elections on the adoption of social media by local governments has not been studied before. This article aims to bridge this research gap by answering a simple yet very relevant research question: Do elections have an impact on social media adoption by local governments?

But as well as filling a research gap, a positive answer to this research question has the potential to contribute to both theory and practice. The contribution to theory is simple: a new model for the adoption of social media by local authorities, which considers the impact of elections, can be established. As far as practice is concerned, it will show that elections may be used to accelerate the adoption of innovations related to new communication technologies in local government. Furthermore, the study makes a methodological contribution by being the first to use non-linear optimization techniques to explain the impact of elections on the adoption of social networks by local governments.

The cases of Portugal and Peru were examined to answer the research question. This selection was made due to the shared characteristics between the two countries that are pertinent to the analysis, despite their significantly different contexts, which is important for the cross-validation of results. Portugal represents a high-income, developed nation in Europe, whereas Peru is classified as a middle-income, developing country in South America. Both countries have direct elections for local governments, hold all local elections simultaneously and are ranked in the top half of the UN E-Participation Index (United Nations, 2020). It was not possible to find or collect data for a low-income, underdeveloped country with equivalent electoral circumstances. The study includes every one of the 308 Portuguese municipalities and all 35 districts of metropolitan Lima, the capital city of Peru.

The subsequent sections of this article are structured as follows: Section 2 focuses on theory and the development hypotheses; Section 3 introduces the data and methodologies employed in the study; Section 4 presents the results; Section 5 discusses the significance of the results along with the study’s limitations and Section 6 concludes with the implications of the study for both research and practice, as well as suggestions for future work.

The increasing use of social media by local governments appears to be a global trend. In 2012, 17% of local governments within the European Union maintained an official Facebook page, 32% had an official Twitter account and 29% had an official YouTube channel (Bonsón et al., 2012). In 2016, 95.9% of municipalities of Spain with more than 50,000 inhabitants used Twitter and Facebook, and 82.8% used YouTube (Criado et al., 2018). In 2018, over 90% of municipalities in the Netherlands engaged with various social media platforms, with Twitter emerging as the most frequently used (Faber et al., 2020). This wide dissemination has also been reported across other regions of the globe, including the United States (Mossberger et al., 2013; Reddick and Norris, 2013; Oliveira and Welch, 2013); China (Schlæger and Jiang, 2014), Brazil (Brazilian Internet Steering Committee – CGI, 2018) and Indonesia (Budi et al., 2020).

The extensive adoption of social media by local governments has captured the attention of researchers. This phenomenon has been examined from various perspectives, including use (e.g. Abdelsalam et al., 2013; Agostino and Arnaboldi, 2016; Bennett and Manoharan, 2017; Criado et al., 2019; Ellison and Hardey, 2014; Graham and Avery, 2013; Panagiotopoulos et al., 2014; Svidroňová et al., 2018), objectives of use (Oliveira and Welch, 2013), effects of use (Banghui et al., 2020; Ellison and Hardey, 2014; Lovari and Materassi, 2021), key factors (e.g. Guillamón et al., 2016; Lameiras et al., 2018; Padeiro et al., 2021), direction of interaction flows (Sáez Martín et al., 2015), benefits compared to traditional communication channels (Hofmann et al., 2013) and citizen engagement (Agostino, 2013). Studies were also carried out on the contribution of social media to boost communication and dialogue with citizens and to improve their satisfaction and commitment (Bonsón et al., 2017; Bonsón and Bednárová, 2018; Bonsón and Ratkai, 2013; Haro de Rosario et al., 2018; Wattal et al., 2010) and to enhance the efficiency of local governments by building communities that engage citizens and encourage them to seek civic improvements (Cole, 2009; Nabatchi and Mergel, 2010).

Despite the existence of these studies, there is a lack of theoretical models specifically designed to elucidate the adoption of social media by local governments. Based on the Australian case, Sharif et al. (2015) contributed to such a model by identifying a set of determinants of adoption, such as community demand, bandwagon pressure and faddishness (environmental determinants); management drive, social media policies and degree of formalization (organizational determinants) and perceived benefits, perceived risk and compatibility (technological determinants). Finding more generic models requires turning to broader areas of study such as local e-government adoption and diffusion of technological innovations.

As for determinants of adoption, we have resorted to local e-government and to the empirical model proposed by Dias (2020). This model classifies the determinants of adoption into four categories: internal determinants (size of local government, financial capacity, management capacity, technical capacity, leadership, organizational form and culture and experience); local socioeconomic determinants (demography, socio-economic dynamism and Internet use), local political determinants (political orientation, political environment and citizen participation) and other environmental determinants (laws, regulations and directives and stakeholders’ pressure). Considering our objectives, the local political determinants are the most relevant. Their validity for the specific case of social media has been confirmed by several independent studies, including political orientation (Frías-Aceituno et al., 2014; Jans et al., 2016; Megdaglia, 2007; Panagiotopoulos et al., 2012), political environment (Silva et al., 2019; Faber et al., 2020) and citizen participation (Oliveira and Welch, 2013; Guillamón et al., 2016). Additional determinants include sociodemographic characteristics (gender and academic level) of the mayor (Raimo et al., 2024).

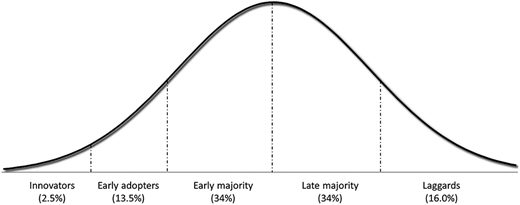
Concerning the pace of adoption, we have resorted to the Diffusion of Innovation (DOI) Theory (Rogers, 2003). This theory aims to explain how a new idea, behavior or product (innovation) gains momentum and disseminates (diffuses) within a specific population or social system. According to this theory, the adoption of innovations over time follows a Gaussian distribution (commonly known as normal or bell-shaped curve). Consequently, in principle, the quantity of new adopters gradually begins to increase over time, as certain innovators embrace the new technology. This growth then accelerates as the technology is progressively adopted by early adopters and the early majority. After a peak is reached (which theoretically coincides with an adoption rate of 50%), influx of new adopters gradually diminishes over time, as the technology continues to be embraced by the late majority and laggards (see Figure 1).

The DOI Theory has been used in prior research to elucidate the adoption of social media by politicians during general elections (Gulati and Williams, 2013). This aligns with the observation made by Mergel and Bretschneider (2013) that social media applications are gradually permeating all tiers of government. The authors propose that the integration of social media within organizations occurs through a three-phase process: first, engaging in informal experimentation with social media beyond established technology usage policies; second, acknowledging the necessity to develop norms and regulations and third, explicitly defining acceptable behaviors, interaction types and innovative communication methods, which are then formalized into social media strategies and policies.

The validity of the DOI Theory to analyze local e-government has previously been defended by Dias (2020). Moreover, its applicability to social media adoption by local governments has previously been tested in Ecuador (Dias et al., 2019). Another indicator that the DOI Theory can be applied to local e-government is that some determinants of organizational innovativeness predicted by that theory, such as size of the organization, organizational slack, complexity, existence of a champion, centralization and formalization, have also been found relevant for local e-government adoption and use (Dias, 2020). In the context of social media, similar trends were observed concerning factors associated with the size of the municipality (Guillamón et al., 2016; Silva et al., 2019; Stone and Can, 2019; Svobodova et al., 2020) as well as organizational slack (Guillamón et al., 2016; Gesuele, 2016).

According to the DOI theory (Rogers, 2003), the trajectory of social media adoption by local governments is expected to progress steadily, as the concept gradually spreads throughout the social system, ultimately leading to a Gaussian distribution. However, considering our research question, if an election results in a significant number of adoptions occurring simultaneously, a noticeable spike should appear on the adoption curve. In essence, if elections have an impact on adoption, then the (typically linear) curve of adoption should show peaks (non-linear distortions) associated with the occurrence of elections.

Taking this into account, we proposed two hypotheses for the study:

  1. The curve of social media adoption by Portuguese municipalities exhibits non-linear distortions (spikes) associated with the occurrence of local elections.

  2. The curve of social media adoption by Lima districts exhibits non-linear distortions (spikes) associated with the occurrence of local elections.

This study follows a quantitative deductive approach to perform two within case longitudinal analyses. The previous subsection formulates the hypotheses of the study by resorting to theory and available literature. This section describes the data and the methods used to test the hypotheses.

This research relies on data gathered from both primary and secondary sources. The primary data encompasses the adoption dates of three social media applications by municipalities in Portugal and districts in Lima. The secondary data comprises the dates of local elections in both nations, starting from 2005, along with the inauguration dates of the newly elected administrations.

For the purpose of analysis, Facebook, Twitter and YouTube have been identified as the three social media applications. This decision was based on the need to encompass one application from each of the three recognized categories of social media: social networking sites, media sharing sites and micro-blogging platforms. The selection of specific applications for examination was based on the availability of prior research concerning their adoption and utilization by local governments. This is significant as, firstly, the presence of such studies serves as an indicator of the importance of the applications under review within the context of local governance, and secondly, it is essential for facilitating comparative analysis.

For each social media application, the original creation dates of the social media profiles were obtained by examining the official accounts of the municipalities on the respective platforms. The process of identifying the official social media accounts was conducted in accordance with the methodology established by Dias et al. (2019) for Ecuador. This involved accessing the links to the designated social media platforms provided on the official municipal websites. In instances where such links were absent, the names of the municipalities were searched using the dedicated search functions of each respective social media application. The official nature of the social media profiles was verified by considering their description and the published content. To ensure that the profiles were actually used by the municipalities, and not simply created, the existence of effective publications and followers was checked.

In Portugal, secondary data pertaining to the municipal elections of 2009, 2013 and 2017 were sourced from the National Elections Commission (https://www.cne.pt). In the case of Peru, information regarding the local elections held in 2010, 2014 and 2018 was acquired from the National Office for Electoral Processes (https://www.onpe.gob.pe). In Portugal, all elections took place in October, with the new government bodies being inaugurated shortly thereafter. In Peru, elections were similarly conducted in October; however, the inaugurations did not occur until January of the subsequent year.

To evaluate the study’s hypotheses, adoption curves for social media applications were constructed over time for each country (resulting in 2 bar charts representing the number of adoptions in the y-axis and time periods in the x-axis). To ensure comparability, the temporal resolution was modified to achieve an equal average number of adoptions per period for both scenarios. Following extensive testing, a standard of four adoptions per period was established. This value strikes an effective balance between achieving a substantial number of counts per period and maintaining a noteworthy temporal resolution. As a result, a quarterly resolution was implemented for Portugal, while an annual resolution was adopted for Peru.

Once adoption curves were constructed, the next step involved fitting these curves. Initially, the optimal fits of the probability density function of the Gaussian distribution, as suggested by the DOI Theory, were determined for the two datasets using a non-linear optimization method. A program was designed in Python for this purpose. The program resorts to the curve fit implementation of the SciPy library, which uses non-linear least squares to fit a function to data. Given an objective function with a set of variable parameters, this implementation optimizes the parameter values to find the best fit of the function to data. Expression 1 shows the objective function that was used to fit the probability density function of the Gaussian distribution to data

(1)

Next, a series of tests were conducted to assess how these fits could be improved by considering negative exponentials (formally probability density functions of exponential distributions) associated with the inaugurations of newly elected governments. The Gaussian and the Chi-square distributions were also tested for this purpose, but they yielded less favorable results. The Python program was modified to enable the specification of various alternative objective functions.

The model that provided the best fit for both nations is outlined in Expression 2. This model integrates the presence of a normal curve, as anticipated by the DOI Theory, which includes the initial inauguration date within the specified timeframe, along with negative exponential functions that are centered on the periods following subsequent inaugurations. It is important to note that each country experienced a total of three elections during the observation period. More formally, the model explains adoption over time as the sum of the probability density function of a Gaussian distribution with two probability density functions of exponential distributions. The center of the Gaussian distribution is subject to optimization, while the exponential distributions are centered on inauguration dates of newly elected local governments

(2)

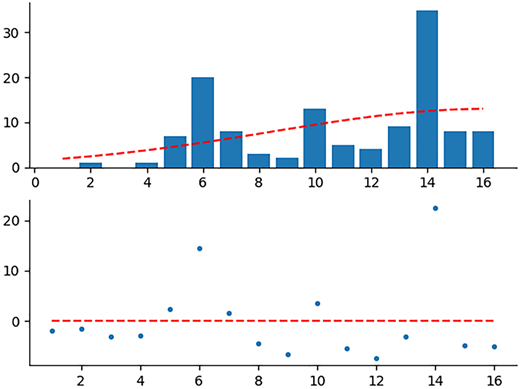
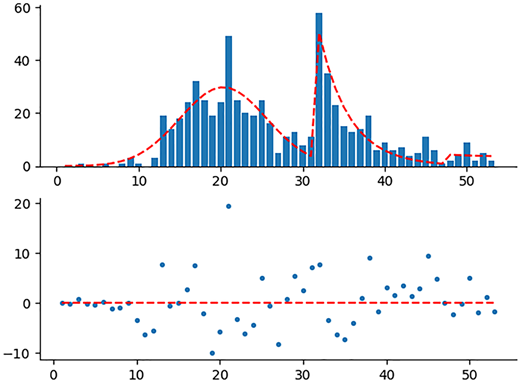
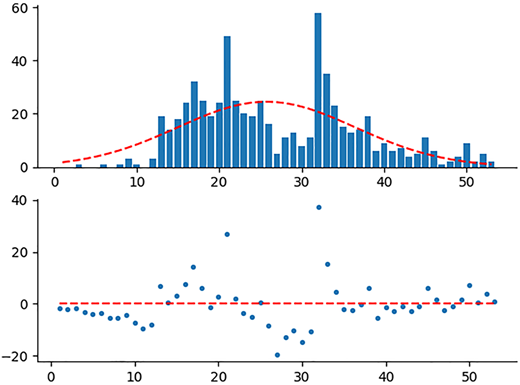
Figure 2 presents the best fit of the Gaussian distribution to the data and the corresponding residual plots for the Portuguese case. Figure 3 illustrates the corresponding information pertaining to the Peruvian case. The optimized parameters determined for both scenarios are detailed in Table 1. The graphs distinctly indicate that the Gaussian distribution is not an appropriate fit for the data. In the case of Portugal (Figure 2), the data exhibit two peaks that clearly affect the fitting of the Gaussian curve. This is also visible in the residual plot, which displays the differences between the values predicted by the Gaussian curve and the actual empirical values. In the case of Peru (Figure 3), the fitting of the Gaussian curve is affected by the existence of three peaks in the data. Numerically, the fact that the goodness of fit (R2 value in Table 2) is relatively low in both cases (0.41 and 0.21, respectively) suggests that an improved model is needed.

Figure 4 shows the best fit of the proposed model (refer to Subsection 3.3) to the Portuguese dataset. The optimized parameters that were used are shown in Table 3. The analysis of the graph and the residual plot indicates that the suggested model demonstrates a substantial enhancement compared to the Gaussian model. Numerically, this is evident from the improvement of the goodness of fit (from 0.45 to 0.82) and, more significantly from the reduction of 66% of the sum of the squares of the residuals (see Table 2). Thus, the explanation for adoption in Portugal is significantly enhanced by integrating a normal distribution with two negative exponential functions that are centered around the periods when newly elected governments assume office, rather than relying solely on the normal distribution.

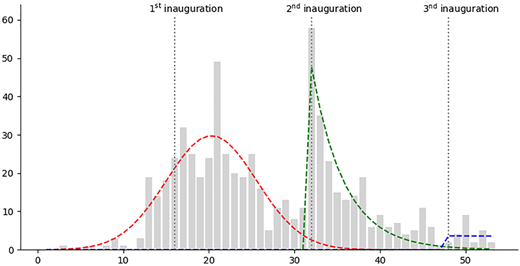
The contribution of each component of the proposed model (the normal curve and the two subsequent negative exponentials) for the overall result can be seen in Figure 5. Times of local government inaugurations are also shown in the figure. In an initial phase, adoption follows a normal distribution. The initial inauguration takes place during this stage; however, it does not significantly alter the normal curve. Following this initial phase, there is a surge in adoption characterized by a negative exponential curve. This surge aligns with the date of the second local government inauguration (October 2013; quarter 32). The impact of the third inauguration date (October 2017; quarter 48) is relatively minor. The primary reason for this is that the majority of adoptions took place in earlier periods. Nevertheless, it is clear that the 2017 elections significantly influenced the adoption of social media by local governments in Portugal.

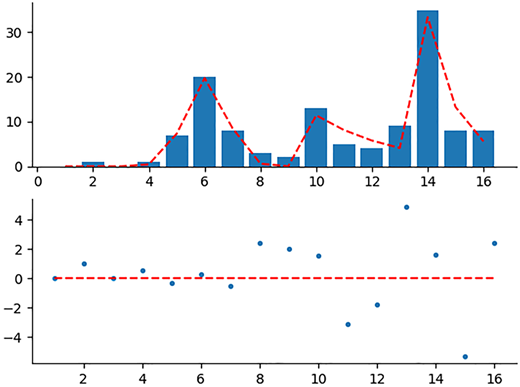
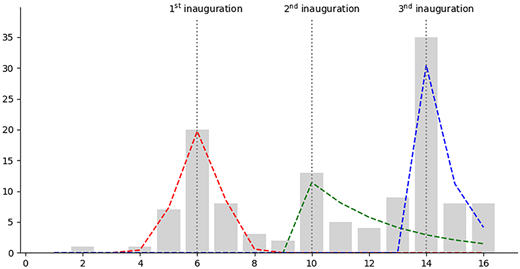
Figure 6 shows the best fit of the proposed model to the Peruvian dataset. The optimized parameters used are shown in Table 3. As was the case for Portugal, the proposed model offers a very significant improvement over the Gaussian model. Numerically, this is shown by an improvement of the goodness of fit from 0.21 to 0.93 and a reduction of 91% of the sum of the squares of the residuals (see Table 2). The contribution of each component of the proposed model can be seen in Figure 7. As was the case with Portugal, the first inauguration (January 2011; Year 6) does not disrupt the normal-shaped curve and there is a negative exponential associated with the second inauguration (January 2015; Year 10). Contrary to what was observed in the Portuguese case, the contribution of the third inauguration date is also significant (January 2019; Year 14). This is due to the slower adoption rate, which causes the disruptive effect to spread over multiple inauguration dates.

The results presented in the previous section show that the proposed model allows a much-improved fit to both datasets than the normal model. This is achieved by combining the normal curve predicted by the DOI Theory with two negative exponentials. These negative exponentials are centered on the inauguration dates of the local governments, after local elections take place. Consequently, it appears that the elections are the primary factor contributing to the disruptions noted in the curve. In other words, the two hypotheses of the study are fully supported by the results: the curve of social media adoption by Portuguese municipalities exhibits non-linear distortions associated with the occurrence of local elections and the curve of social media adoption by Lima districts exhibits non-linear distortions associated with the occurrence of local elections. This allows answering the research question: elections do have an impact on social media adoption by local governments.

The study does not explain why elections have an impact on social media adoption. While the objective is intriguing, it is regarded as beyond the scope of the study. Nevertheless, there are numerous recognized determinants influencing adoption that may be impacted by elections, thereby aiding in the interpretation of the results. Generally, those determinants can be classified in three main groups: ideological factors, such as changes in the political orientation of the ruling party (Frías-Aceituno et al., 2014; Jans et al., 2016; Megdaglia, 2007; Panagiotopoulos et al., 2012; Pereira et al., 2012); political discontinuity and changes in personal characteristics of the mayor or other elected officials, such as age, gender, academic level and propensity to innovation (Silva et al., 2019; Raimo et al., 2024) and factors related to the electoral process itself, such as political competition (Silva et al., 2019; Faber et al., 2020), electoral participation (Oliveira and Welch, 2013; Guillamón et al., 2016) and the experience in the use of social media for electoral purposes (Lappas et al., 2016). The exploration of the relationship between these factors and the impact of elections is proposed as a topic for future research.

Although it does not provide a final answer as to why elections have an impact on social media adoption by municipalities, the study has very relevant theoretical, methodological and practical implications. In regard to theory, it proposes a new model of social media adoption by local governments over time: there is an initial phase in which adoption follows a normal curve; this is followed by peaks in adoption that correspond to the inauguration dates of newly elected administrations, with the impact of these peaks diminishing exponentially as time progresses. Thus, adoption does not evolve gradually, as observed by Mergel and Bretschneider (2013) and predicted by the DOI theory (Rogers, 2003). Instead, it is characterized by peaks of adoption motivated by disruptive events such as elections.

Regarding methodological implications, the results show that the adoption of social media by local governments evolves in a non-linear manner over time and, consequently, must be modulated using non-linear curves. The research suggests the application of non-linear optimization methods to automatically adjust the parameters of theoretical models in order to fit the data. This is key when non-linear models are at stake.

Regarding practice, the study indicates that elections present a valuable opportunity to promote the integration of innovations associated with new communication technologies within local government practices. Taking into account that this may stem, at least in part, from the experiences politicians undergo during election campaigns (Lappas et al., 2016), it would be prudent for practitioners to explore the possibility of leveraging elections to highlight new communication technologies or their innovative uses. Given that it may be caused by political discontinuity, it may be prudent for them to capitalize on the transition of new administrations to expedite the implementation of innovations.

The primary constraint of the study lies in the utilization of only two country cases to validate the proposed model. Nevertheless, the absence of substantial social, economic and political similarities between these two nations allows a degree of extrapolation of the findings. It is improbable that such disparate country cases would yield remarkably similar results purely by chance. In any case, it is important to test the proposed model using additional cases, ideally from various regions across the globe.

The findings of this study indicate that local elections significantly promote the adoption of social media by local governments, a trend that becomes apparent once newly elected officials take office. This effect is characterized by the existence of adoption waves with negative exponential shapes centered at the times of government inaugurations. These waves occur after an initial normal-shaped wave of adoption, as predicted by the DOI Theory.

Using non-linear optimizing techniques to fit theoretical models to the data, it was possible to demonstrate that the proposed model significantly improves results when compared to the normal adoption curve inherent to the DOI Theory. The results were consistent for both the Portuguese and the Peruvian cases. Thus, it can be concluded that elections have a significant impact on the subsequent adoption of social media by local governments. This conclusion effectively responds to the research question outlined in the study.

For researchers, this finding is relevant because it draws attention to the need of considering the impact of elections when studying the adoption of innovations by local governments, namely in the case of social media or other communication technologies. For this purpose, the theoretical curve of adoption proposed in this article may prove to be a valuable instrument.

For practitioners, the study shows that there is a time window after the newly elected governments take office that can be used to accelerate the adoption of innovations, particularly in the case of new communication technologies. Also, election campaigns can be a good opportunity to showcase innovations that can subsequently be adopted by local governments.

In relation to possible developments of the study, two complementary paths should be followed: to study the factors that contribute to explain the impact of elections on social media adoption; and to replicate the study across countries and regions worldwide and for other technologies, to assess to what extent its results can be generalized. For the first path, the perceptions of the players involved can be captured using qualitative research approaches. For the second path, the quantitative methods presented in this article can be reused.
Abdelsalam
,
H.M.
,
Reddick
,
C.G.
,
Gamal
,
S.
and
Al-shaar
,
A.
(
2013
), “
Social media in Egyptian government websites: presence, usage, and effectiveness
”,
Government Information Quarterly
, Vol. 
30
No. 
4
, pp. 
406
-
416
, doi: .
Agostino
,
D.
(
2013
), “
Using social media to engage citizens: a study of Italian municipalities
”,
Public Relations Review
, Vol. 
39
No. 
3
, pp. 
232
-
234
, doi: .
Agostino
,
D.
and
Arnaboldi
,
M.
(
2016
), “
A measurement framework for assessing the contribution of social media to public engagement: an empirical analysis on Facebook
”,
Public Management Review
, Vol. 
18
No. 
9
, pp. 
1289
-
1307
, doi: .
Banghui
,
Z.
,
Yonghan
,
Z.
and
Guitao
,
K.
(
2020
), “
E-government use via social media as a tool to influences young people's trust in government: an empirical study in a Chinese Municipality
”,
The 21st Annual International Conference on Digital Government Research
, pp. 
16
-
23
, doi: .
Bennett
,
L.V.
and
Manoharan
,
A.P.
(
2017
), “
The use of social media policies by US municipalities
”,
International Journal of Public Administration
, Vol. 
40
No. 
4
, pp. 
317
-
328
, doi: .
Bonsón
,
E.
and
Bednárová
,
M.
(
2018
), “
The use of YouTube in western European municipalities
”,
Government Information Quarterly
, Vol. 
35
No. 
2
, pp. 
223
-
232
, doi: .
Bonsón
,
E.
and
Ratkai
,
M.
(
2013
), “
A set of metrics to assess stakeholder engagement and social legitimacy on a corporate Facebook page
”,
Online Information Review
, Vol. 
37
No. 
5
, pp. 
787
-
803
, doi: .
Bonsón
,
E.
,
Torres
,
L.
,
Royo
,
S.
and
Flores
,
F.
(
2012
), “
Local e-government 2.0: social media and corporate transparency in municipalities
”,
Government Information Quarterly
, Vol. 
29
No. 
2
, pp. 
123
-
132
, doi: .
Bonsón
,
E.
,
Royo
,
S.
and
Ratkai
,
M.
(
2017
), “
Facebook practices in Western European municipalities
”,
Administration and Society
, Vol. 
49
No. 
3
, pp. 
320
-
347
, doi: .
Brazilian Internet Steering Committee – CGI
(
2018
), “
Pesquisa sobre o uso das tecnologias de informação e comunicação no setor público brasileiro: TIC governo eletrônico 2017
”,
available at:
 https://www.cetic.br/pesquisa/governo-eletronico/publicacoes (
accessed
 28 July 2022).
Bryer
,
T.A.
and
Zavattaro
,
S.M.
(
2011
), “
Social media and public administration: theoretical dimensions and introduction to the symposium
”,
Administrative Theory and Praxis
, Vol. 
33
No. 
3
, pp. 
325
-
340
, doi: .
Budi
,
N.F.A.
,
Fitriani
,
W.R.
,
Hidayanto
,
A.N.
,
Kurnia
,
S.
and
Inan
,
D.I.
(
2020
), “
A study of government 2.0 implementation in Indonesia
”,
Socio-Economic Planning Sciences
, Vol. 
72
, 100920, doi: .
Cole
,
R.
(
2009
), “
Social media: what does it mean for public managers?
”,
available at:
 https://icma.org/documents/social-media-what-does-it-mean-public-managers (
accessed
 28 July 2022).
Criado
,
J.I.
,
Sandoval Almazan
,
R.
and
Gil Garcia
,
J.R.
(
2013
), “
Government innovation through social media
”,
Government Information Quarterly
, Vol. 
30
No. 
4
, pp. 
319
-
326
, doi: .
Criado
,
J.I.
,
Pastor
,
V.
and
Villodre
,
J.
(
2018
), “
Measuring social media diffusion in local governments from a longitudinal perspective: adoption, barriers, and perceptions
”,
Public Information and Information Technology
, Vol. 
29
, pp. 
3
-
27
, doi: .
Criado
,
J.I.
,
Villodre
,
J.
and
Meijer
,
A.
(
2019
), “
From experimentation to public service delivery in social media. An analysis of institutionalization dynamics in Dutch local governments
”,
Proceedings of the 20th Annual International Conference on Digital Government Research
, pp. 
342
-
352
, doi: .
Dias
,
G.P.
(
2020
), “
Determinants of e-government implementation at the local level: an empirical model
”,
Online Information Review
, Vol. 
44
No. 
7
, pp. 
1307
-
1326
, doi: .
Dias
,
G.P.
,
Bruzza
,
M.
and
Tupia
,
M.
(
2019
), “
The use of social media by local governments: the case of Manabí’s cantons in Ecuador
”,
EPIC Series in Computing
, Vol. 
63
, pp. 
170
-
181
, doi: .
Dimitrova
,
D.V.
and
Matthes
,
J.
(
2018
), “
Social media in political campaigning around the world: theoretical and methodological challenges
”,
Journalism and Mass Communication Quarterly
, Vol. 
95
No. 
2
, pp. 
333
-
342
, doi: .
Ellison
,
N.
and
Hardey
,
M.
(
2014
), “
Social media and local government: citizenship, consumption and democracy
”,
Local Government Studies
, Vol. 
40
No. 
1
, pp. 
21
-
40
, doi: .
Faber
,
B.
,
Budding
,
T.
and
Gradus
,
R.
(
2020
), “
Assessing social media use in Dutch municipalities: political, institutional, and socio-economic determinants
”,
Government Information Quarterly
, Vol. 
37
No. 
3
, pp. 
1
-
9
, doi: .
Fisher
,
J.
and
Denver
,
D.
(
2009
), “
Evaluating the electoral effects of traditional and modern modes of constituency campaigning in Britain 1992-2005
”,
Parliamentary Affairs
, Vol. 
62
No. 
2
, pp. 
196
-
210
, doi: .
Fisher
,
J.
,
Cutts
,
D.
and
Fieldhouse
,
E.
(
2011
), “
The electoral effectiveness of constituency campaigning in the 2010 British general election: the ‘triumph’ of Labour?
”,
Electoral Studies
, Vol. 
30
No. 
4
, pp. 
816
-
828
, doi: .
Frías-Aceituno
,
J.
,
García-Sánchez
,
I.
and
Rodríguez-Domínguez
,
L.
(
2014
), “
Electronic administration styles and their determinants. Evidence from Spanish local governments
”,
Transylvanian Review of Administrative Sciences
, Vol. 
41
, pp. 
90
-
108
,
available at:
 https://rtsa.ro/tras/index.php/tras/article/view/158/154
Gesuele
,
B.
(
2016
), “
Municipalities Facebook use: which key drivers? Empirical evidence from Italian municipalities
”,
International Journal of Public Administration
, Vol. 
39
No. 
10
, pp. 
771
-
777
, doi: .
Graham
,
M.
and
Avery
,
E.J.
(
2013
), “
Government public relations and social media: an analysis of the perceptions and trends of social media use at the local government level
”,
Public Relations Journal
, Vol. 
7
No. 
4
, pp. 
274
-
291
, doi: ,
available at:
 https://prjournal.instituteforpr.org/wp-content/uploads/2013GrahamAvery.pdf
Gschwend
,
T.
and
Zittel
,
T.
(
2015
), “
Do constituency candidates matter in German Federal Elections? The personal vote as an interactive process
”,
Electoral Studies
, Vol. 
39
, pp. 
338
-
349
, doi: .
Guillamón
,
M.D.
,
Ríos
,
A.M.
,
Gesuele
,
B.
and
Metallo
,
C.
(
2016
), “
Factors influencing social media use in local governments: the case of Italy and Spain
”,
Government Information Quarterly
, Vol. 
33
No. 
1
, pp. 
460
-
471
, doi: .
Gulati
,
G.J.
and
Williams
,
C.B.
(
2013
), “
Social media and campaign 2012: developments and trends for Facebook adoption
”,
Social Science Computer Review
, Vol. 
31
No. 
5
, pp. 
577
-
588
, doi: .
Haro de Rosario
,
A.
,
Sáez-Martín
,
A.
and
Caba Pérez
,
M.C.
(
2018
), “
Using social media to enhance citizen engagement with local government: twitter or Facebook?
”,
New Media and Society
, Vol. 
20
No. 
1
, pp. 
29
-
49
, doi: .
Hofmann
,
S.
,
Beverungen
,
D.
,
Räckers
,
M.
and
Becker
,
J.
(
2013
), “
What makes local governments' online communications successful? Insights from a multi-method analysis of Facebook
”,
Government Information Quarterly
, Vol. 
30
No. 
4
, pp. 
387
-
396
, doi: .
Jans
,
W.
,
Denters
,
B.
,
Need
,
A.
and
Van Gerven
,
M.
(
2016
), “
Mandatory innovation in a decentralised system: the adoption of an e-government innovation in Dutch municipalities
”,
Acta Politica
, Vol. 
51
No. 
1
, pp. 
36
-
60
, doi: .
Kaplan
,
A.M.
and
Haenlein
,
M.
(
2010
), “
Users of the world, unite! The challenges and opportunities of Social Media
”,
Business Horizons
, Vol. 
53
No. 
1
, pp. 
59
-
68
, doi: .
Lameiras
,
M.
,
Silva
,
T.
and
Tavares
,
A.
(
2018
), “
An empirical analysis of social media usage by local governments in Portugal
”,
Proceedings of the 11th International Conference on Theory and Practice of Electronic Governance
, pp. 
257
-
268
, doi: .
Lappas
,
G.
,
Triantafillidou
,
A.
,
Yannas
,
P.
,
Kavada
,
A.
and
Kleftodimos
(
2016
), “
Social media Battles: their impact during the 2014 Greek municipal elections
”,
Journal of Universal Computer Science
, Vol. 
22
No. 
3
, pp. 
375
-
393
, doi: .
Lovari
,
A.
and
Materassi
,
L.
(
2021
), “
Trust me, I am the social media manager! Public sector communication's trust work in municipality social media channels
”,
Corporate Communications: An International Journal
, Vol. 
26
No. 
1
, pp. 
55
-
69
, doi: .
Medaglia
,
R.
(
2007
), “
Measuring the diffusion of eParticipation: a survey on Italian local government
”,
Information Polity
, Vol. 
12
No. 
4
, pp. 
265
-
280
, doi: .
Mergel
,
I.
and
Bretschneider
,
S.I.
(
2013
), “
A three-stage adoption process for social media use in government
”,
Public Administration Review
, Vol. 
73
No. 
3
, pp. 
390
-
400
, doi: .
Mossberger
,
K.
,
Wu
,
Y.
and
Crawford
,
J.
(
2013
), “
Connecting citizens and local governments? Social media and interactivity in major U.S. cities
”,
Government Information Quarterly
, Vol. 
30
No. 
4
, pp. 
351
-
358
, doi: .
Nabatchi
,
T.
and
Mergel
,
I.
(
2010
), “Participation 2.0: using internet and social media: technologies to promote distributed democracy and create digital neighborhoods”, in
Svara
,
H.
and
Denhardt
,
J.
(Eds),
The Connected Community: Local Governments as Partners in Citizen Engagement and Community Building
, pp. 
80
-
87
,
available at:
 https://kops.uni-konstanz.de/handle/123456789/38750
Oliveira
,
G.H.M.
and
Welch
,
E.W.
(
2013
), “
Social media use in local government: linkage of technology, task and organizational context
”,
Government Information Quarterly
, Vol. 
30
No. 
4
, pp. 
397
-
405
, doi: .
Padeiro
,
M.
,
Bueno-Larraz
,
B.
and
Freitas
,
Â.
(
2021
), “
Local governments' use of social media during the COVID-19 pandemic: the case of Portugal
”,
Government Information Quarterly
, Vol. 
38
No. 
4
, 101620, doi: .
Panagiotopoulos
,
P.
,
Moody
,
C.
and
Elliman
,
T.
(
2012
), “
Institutional diffusion of eParticipation in the English local government: is central policy the way forward?
”,
Information Systems Management
, Vol. 
29
No. 
4
, pp. 
295
-
304
, doi: .
Panagiotopoulos
,
P.
,
Bigdeli
,
A.Z.
and
Sams
,
S.
(
2014
), “
Citizen–government collaboration on social media: the case of twitter in the 2011 riots in England
”,
Government Information Quarterly
, Vol. 
31
No. 
3
, pp. 
349
-
357
, doi: .
Pereira
,
M.A.G.
,
Amaral
,
E.F.L.
and
Costa
,
M.M.
(
2012
), “
Some determinants of the existence of government websites in 853 municipalities in Minas Gerais, Brazil
”,
Latin American Research Review
, Vol. 
47
No. 
3
, pp. 
155
-
174
, doi: ,
available at:
 https://www.jstor.org/stable/23322178
Raimo
,
N.
,
L'Abate
,
V.
,
Rella
,
A.
and
Vitolla
,
F.
(
2024
), “
The use of social media in Italian local governments: the effect of the mayor's characteristics
”,
Cities
, Vol. 
150
, 105070, doi: .
Reddick
,
C.G.
and
Norris
,
D.F.
(
2013
), “
Social media adoption at the American grass roots: Web 2.0 or 1.5?
”,
Government Information Quarterly
, Vol. 
30
No. 
4
, pp. 
498
-
507
, doi: .
Rogers
,
E.M.
(
2003
),
Diffusion of Innovations
, (5th ed.) ,
Free Press
,
New York, NY
.
Sáez Martín
,
A.
,
Haro de Rosario
,
A.
and
Caba Pérez
,
M.C.
(
2015
), “
Using Twitter for dialogic communication: local government strategies in the European Union
”,
Local Government Studies
, Vol. 
41
No. 
3
, pp. 
421
-
444
, doi: .
Sandoval-Almazan
and
Gil-Garcia
(
2013
), “
Cyberactivism through social media: twitter, YouTube, and the Mexican political movement, ‘I'm number 132’
”,
Proceedings of 46th Hawaii International Conference on System Sciences
, pp. 
1704
-
1713
, doi: .
Santoso
,
A.D.
,
Rinjany
,
D.K.
and
Bafadhal
,
O.M.
(
2020
), “
Social media and local government in Indonesia: adoption, use and stakeholder engagement
”,
Romanian Journal of Communication and Public Relations
, Vol. 
22
No. 
3
, pp. 
21
-
35
, doi: .
Schlæger
,
J.
and
Jiang
,
M.
(
2014
), “
Official microblogging and social management by local governments in China
”,
China Information
, Vol. 
28
No. 
2
, pp. 
189
-
213
, doi: .
Sharif
,
M.H.M.
,
Troshani
,
I.
and
Davidson
,
R.
(
2015
), “
Public sector adoption of social media
”,
Journal of Computer Information Systems
, Vol. 
55
No. 
4
, pp. 
53
-
61
, doi: .
Silva
,
P.
,
Tavares
,
A.F.
,
Silva
,
T.
and
Lameiras
,
M.
(
2019
), “
The good, the bad and the ugly: three faces of social media usage by local governments
”,
Government Information Quarterly
, Vol. 
36
No. 
3
, pp. 
469
-
479
, doi: .
Song
,
C.
and
Lee
,
J.
(
2016
), “
Citizens use of social media in government, perceived transparency, and trust in government
”,
Public Performance and Management Review
, Vol. 
39
No. 
2
, pp. 
430
-
453
, doi: .
Stone
,
J.A.
and
Can
,
S.H.
(
2019
), “
Investigating factors of twitter use among municipal governments
”,
Journal of Computer Information Systems
, Vol. 
61
No. 
3
, pp. 
267
-
274
, doi: .
Stone
,
J.A.
and
Can
,
S.H.
(
2020
), “
Linguistic analysis of municipal twitter feeds: factors influencing frequency and engagement
”,
Government Information Quarterly
, Vol. 
37
No. 
4
, 101468, doi: .
Sudulich
,
M.L.
,
Wall
,
M.
and
Farrel
,
D.M.
(
2013
), “
Why bother campaigning? Campaign effectiveness in the 2009 European Parliament elections
”,
Electoral Studies
, Vol. 
32
No. 
4
, pp. 
768
-
778
, doi: .
Svidroňová
,
M.M.
,
Kaščáková
,
A.
and
Vrbičanová
,
V.
(
2018
), “
Can social media be a tool for participatory governance in Slovak municipalities?
”,
NISPAcee Journal of Public Administration and Policy
, Vol. 
11
No. 
2
, pp. 
81
-
101
, doi: .
Svobodova
,
L.
,
Bednarska-Olejniczak
,
D.
and
Dittrichova
,
J.
(
2020
), “
Social media and other channels of communication in municipality environment – case study of Hradec Kralove region
”,
Proceedings of the International Scientific Conference Hradec Economic Days
, Vol. 
10
, pp. 
761
-
769
, doi: .
United Nations
(
2020
),
E-government Survey 2020
,
Department of Economic and Social Affairs
,
available at:
 https://publicadministration.un.org/egovkb/en-us/Reports/UN-E-Government-Survey-2020 (
accessed
 28 July 2022).
Warren
,
A.M.
,
Sulaiman
,
A.
and
Jaafar
,
N.I.
(
2014
), “
Social media effects on fostering online civic engagement and building citizen trust and trust in institutions
”,
Government Information Quarterly
, Vol. 
31
No. 
2
, pp. 
291
-
301
, doi: .
Wattal
,
S.
,
Schuff
,
D.
,
Mandviwalla
,
M.
and
Williams
,
C.B.
(
2010
), “
Web 2.0 and politics: the 2008 U.S. presidential election and an E-politics research agenda
”,
MIS Quarterly
, Vol. 
34
No. 
4
, pp. 
669
-
688
, doi: .
Zumofen
,
R.
and
Mabillard
,
V.
(
2024
), “
Debate: improving communication effectiveness or wasting taxpayers' money? The use of social media influencers in public organizations
”,
Public Money and Management
, Vol. 
44
No. 
1
, pp. 
5
-
6
, doi: .
Published by Emerald Publishing Limited. This article is published under the Creative Commons Attribution (CC BY 4.0) licence. Anyone may reproduce, distribute, translate and create derivative works of this article (for both commercial and non-commercial purposes), subject to full attribution to the original publication and authors. The full terms of this licence may be seen at http://creativecommons.org/licences/by/4.0/legalcode

Data & Figures

Figure 1
A figure of bell curve split into five adoption groups: Innovators, Early adopters, Early majority, Late majority, Laggards.The diagram shows a bell curve divided into five equal sections along the horizontal axis by vertical dashed lines. The section labels on the horizontal axis, from left to right, are: Innovators (2.5 percent), Early adopters (13.5 percent), Early majority (34 percent), Late majority (34 percent), and Laggards (16.0 percent).

Typical adoption curve of technology as defined by the DOI theory. Source: Adapted by authors from Rogers, 2003 

Figure 1
A figure of bell curve split into five adoption groups: Innovators, Early adopters, Early majority, Late majority, Laggards.The diagram shows a bell curve divided into five equal sections along the horizontal axis by vertical dashed lines. The section labels on the horizontal axis, from left to right, are: Innovators (2.5 percent), Early adopters (13.5 percent), Early majority (34 percent), Late majority (34 percent), and Laggards (16.0 percent).

Typical adoption curve of technology as defined by the DOI theory. Source: Adapted by authors from Rogers, 2003 

Close Figure 1
Figure 2
A stacked histogram and scatter plot of values 0 to 50 with a dashed bell curve and points mostly near zero.The figure shows two graphs in a vertical arrangement. The top panel is a histogram. The horizontal axis ranges from 0 to 50 in increments of 10, and the vertical axis ranges from 0 to 60 in increments of 20. The highest bar is at 32, with a value of 58. The next highest bar is at 21, with a value of 50. All other bars are below 35. Most of the tall bars are between 12 and 35 on the horizontal axis. The bars at the ends are short, with values less than 10. A dashed bell curve is overlaid on the histogram. It rises in a concave-up manner, peaks at (25, 25), and falls symmetrically. The bottom panel is a scatter plot with dots distributed across the graph area. The horizontal axis ranges from 0 to 50, and the vertical axis ranges from negative 20 to 40. A dashed horizontal line runs through the vertical axis value of 0. The dots are mostly around the 0 line. Some of the points are (9, negative 3.63), (16.8, 15.6), (29.9, negative 13.9), (31.78, 38.0), and (51.88, 5.02). Note: All numerical values are approximated.

Fit of the Gaussian model with the adoption curve, and the corresponding residual plot for the Portuguese case. Source: Figure by authors

Figure 2
A stacked histogram and scatter plot of values 0 to 50 with a dashed bell curve and points mostly near zero.The figure shows two graphs in a vertical arrangement. The top panel is a histogram. The horizontal axis ranges from 0 to 50 in increments of 10, and the vertical axis ranges from 0 to 60 in increments of 20. The highest bar is at 32, with a value of 58. The next highest bar is at 21, with a value of 50. All other bars are below 35. Most of the tall bars are between 12 and 35 on the horizontal axis. The bars at the ends are short, with values less than 10. A dashed bell curve is overlaid on the histogram. It rises in a concave-up manner, peaks at (25, 25), and falls symmetrically. The bottom panel is a scatter plot with dots distributed across the graph area. The horizontal axis ranges from 0 to 50, and the vertical axis ranges from negative 20 to 40. A dashed horizontal line runs through the vertical axis value of 0. The dots are mostly around the 0 line. Some of the points are (9, negative 3.63), (16.8, 15.6), (29.9, negative 13.9), (31.78, 38.0), and (51.88, 5.02). Note: All numerical values are approximated.

Fit of the Gaussian model with the adoption curve, and the corresponding residual plot for the Portuguese case. Source: Figure by authors

Close Figure 2
Figure 3
A histogram with a dashed trend and a lower scatter plot showing points near zero and one 14,22 outlier.The figure shows two vertically stacked graphs. The top panel is a histogram. The horizontal axis ranges from 0 to 16 in increments of 2, and the vertical axis ranges from 0 to 30 in increments of 10. The highest bar is at 14, with a value of 34. Another tall bar appears at 6, with a value of 20. Most bars are below 15, with the taller bars toward the right side of the axis. Short bars appear at the lower end and center, with values under 5. A dashed line is overlaid, starting at approximately (1, 2.5), rising to (15.8, 13.39) at the right. The lower panel is a scatter plot with dots distributed across the plot area. The horizontal axis ranges from 2 to 16 in increments of 2, and the vertical axis ranges from 0 to 20 in increments of 10. A dashed horizontal line runs across the vertical axis at 0. The dots are mostly near the 0 line, with a single higher positive outlier at (14, 22). Some points near 0 are (3, negative 3), (7, 1.83), and (13, negative 2.88). Note: All numerical values are approximated.

Fit of the Gaussian model with the adoption curve, and the corresponding residual plot for the Lima case. Source: Figure by authors

Figure 3
A histogram with a dashed trend and a lower scatter plot showing points near zero and one 14,22 outlier.The figure shows two vertically stacked graphs. The top panel is a histogram. The horizontal axis ranges from 0 to 16 in increments of 2, and the vertical axis ranges from 0 to 30 in increments of 10. The highest bar is at 14, with a value of 34. Another tall bar appears at 6, with a value of 20. Most bars are below 15, with the taller bars toward the right side of the axis. Short bars appear at the lower end and center, with values under 5. A dashed line is overlaid, starting at approximately (1, 2.5), rising to (15.8, 13.39) at the right. The lower panel is a scatter plot with dots distributed across the plot area. The horizontal axis ranges from 2 to 16 in increments of 2, and the vertical axis ranges from 0 to 20 in increments of 10. A dashed horizontal line runs across the vertical axis at 0. The dots are mostly near the 0 line, with a single higher positive outlier at (14, 22). Some points near 0 are (3, negative 3), (7, 1.83), and (13, negative 2.88). Note: All numerical values are approximated.

Fit of the Gaussian model with the adoption curve, and the corresponding residual plot for the Lima case. Source: Figure by authors

Close Figure 3
Figure 4
A histogram with peaks near 21 and 32 and scatter plot below showing points clustered near zero with some outliers.The figure shows two graphs in a vertical arrangement. The top panel is a histogram. The horizontal axis ranges from 0 to 50 in increments of 10, and the vertical axis ranges from 0 to 60 in increments of 20. The tallest bar is at 32, with a height of 58, and another prominent bar appears at 21, with a height of 49. Most tall bars are between 12 and 35 on the horizontal axis. Bars farther left and right are shorter, generally under 10. A dashed curve is superimposed on the histogram. It rises gradually, forming two peaks: one centered near 21 and a higher peak near 32, before declining to the right. The bottom panel is a scatter plot with dots distributed along the graph area. The horizontal axis ranges from 0 to 50 in increments of 10, and the vertical axis ranges from negative 10 to 20 in increments of 10. A dashed horizontal line crosses the vertical axis at 0. The dots cluster around the 0 line, with positive outliers at (21, 19.6) and negative outliers at (19, negative 10). Some points near 0 are (9.92, negative 2.67), (37.10, 1.43), and (28.87, 5.75). Note: All numerical values are approximated.

Fit of the proposed model with the adoption curve and the corresponding residual plot for the Portuguese case. Source: Figure by authors

Figure 4
A histogram with peaks near 21 and 32 and scatter plot below showing points clustered near zero with some outliers.The figure shows two graphs in a vertical arrangement. The top panel is a histogram. The horizontal axis ranges from 0 to 50 in increments of 10, and the vertical axis ranges from 0 to 60 in increments of 20. The tallest bar is at 32, with a height of 58, and another prominent bar appears at 21, with a height of 49. Most tall bars are between 12 and 35 on the horizontal axis. Bars farther left and right are shorter, generally under 10. A dashed curve is superimposed on the histogram. It rises gradually, forming two peaks: one centered near 21 and a higher peak near 32, before declining to the right. The bottom panel is a scatter plot with dots distributed along the graph area. The horizontal axis ranges from 0 to 50 in increments of 10, and the vertical axis ranges from negative 10 to 20 in increments of 10. A dashed horizontal line crosses the vertical axis at 0. The dots cluster around the 0 line, with positive outliers at (21, 19.6) and negative outliers at (19, negative 10). Some points near 0 are (9.92, negative 2.67), (37.10, 1.43), and (28.87, 5.75). Note: All numerical values are approximated.

Fit of the proposed model with the adoption curve and the corresponding residual plot for the Portuguese case. Source: Figure by authors

Close Figure 4
Figure 5
A histogram with tall bars near 21 and 32 and three dashed lines labeled 1st, 2nd, and 3rd inauguration.The horizontal axis of the histogram ranges from 0 to 50 in increments of 10, and the vertical axis ranges from 0 to 60 in increments of 10. Three dashed vertical lines are evenly spaced near 16, 32, and 48 on the horizontal axis, labeled “1st inauguration”, “2nd inauguration”, and “3rd inauguration”. The tallest bar is at 32, reaching 58, and another cluster of tall bars appears near 21, peaking near 49. Most higher bars are between 12 and 35. Bars farther left and right are shorter, under 10. Two dashed trend curves appear over the histogram. The main dashed bell curve rises smoothly, peaks near 21, and falls. A green dashed curve starts at 32, rises sharply to the peak, then declines concave-up. A blue dashed curve appears at the far right with a step-like pattern below the shortest bars. Note: All numerical values are approximated.

Components of the proposed model and inauguration dates for the Portuguese case. Source: Figure by authors

Figure 5
A histogram with tall bars near 21 and 32 and three dashed lines labeled 1st, 2nd, and 3rd inauguration.The horizontal axis of the histogram ranges from 0 to 50 in increments of 10, and the vertical axis ranges from 0 to 60 in increments of 10. Three dashed vertical lines are evenly spaced near 16, 32, and 48 on the horizontal axis, labeled “1st inauguration”, “2nd inauguration”, and “3rd inauguration”. The tallest bar is at 32, reaching 58, and another cluster of tall bars appears near 21, peaking near 49. Most higher bars are between 12 and 35. Bars farther left and right are shorter, under 10. Two dashed trend curves appear over the histogram. The main dashed bell curve rises smoothly, peaks near 21, and falls. A green dashed curve starts at 32, rises sharply to the peak, then declines concave-up. A blue dashed curve appears at the far right with a step-like pattern below the shortest bars. Note: All numerical values are approximated.

Components of the proposed model and inauguration dates for the Portuguese case. Source: Figure by authors

Close Figure 5
Figure 6
A histogram with dashed curve matching peaks and a scatter plot below with points near zero and a negative 4.8 outlier.The figure shows two vertically stacked graphs. The top panel is a histogram. The horizontal axis ranges from 0 to 16 in increments of 2, and the vertical axis ranges from 0 to 30 in increments of 10. The highest bar is at 14, with a value of 34. Another tall bar appears at 6, with a value of 20. Most bars are under 15, concentrated toward the right side. A dashed line overlays the bars, with peaks at approximately (6, 20), (10, 11.8), and (16, 6.02), before declining on the right. The lower panel is a scatter plot. The horizontal axis ranges from 2 to 16 in increments of 2, and the vertical axis ranges from negative 4 to 4 in increments of 2. A dashed horizontal line is drawn at 0. The dots are scattered near the 0 line, with a higher negative outlier at (13, negative 4.8). Other points include (3, negative 1.28), (7, 0.55), and (14, negative 5.2). Note: All numerical values are approximated.

Fit of the proposed model with the adoption curve and the corresponding residual plot for the Lima case. Source: Figure by authors

Figure 6
A histogram with dashed curve matching peaks and a scatter plot below with points near zero and a negative 4.8 outlier.The figure shows two vertically stacked graphs. The top panel is a histogram. The horizontal axis ranges from 0 to 16 in increments of 2, and the vertical axis ranges from 0 to 30 in increments of 10. The highest bar is at 14, with a value of 34. Another tall bar appears at 6, with a value of 20. Most bars are under 15, concentrated toward the right side. A dashed line overlays the bars, with peaks at approximately (6, 20), (10, 11.8), and (16, 6.02), before declining on the right. The lower panel is a scatter plot. The horizontal axis ranges from 2 to 16 in increments of 2, and the vertical axis ranges from negative 4 to 4 in increments of 2. A dashed horizontal line is drawn at 0. The dots are scattered near the 0 line, with a higher negative outlier at (13, negative 4.8). Other points include (3, negative 1.28), (7, 0.55), and (14, negative 5.2). Note: All numerical values are approximated.

Fit of the proposed model with the adoption curve and the corresponding residual plot for the Lima case. Source: Figure by authors

Close Figure 6
Figure 7
A histogram with a peak at 14 and three dashed lines marking 1st, 2nd, and 3rd inauguration.The horizontal axis ranges from 0 to 16 in increments of 2, and the vertical axis ranges from 0 to 35 in increments of 5. The tallest bar is at 14, with a value of 35. Another tall bar appears at 6, with a value of 20. Most bars are below 15, concentrated on the right half of the axis. Short bars appear at the lower end and center, with values under 10. Three dashed trend lines overlay the bars: a red dashed line peaks at 6, a green dashed line peaks at 10, and a blue dashed line rises sharply to a peak at 14 before declining. Three dotted vertical lines correspond to the three peak values, labeled “1st inauguration”, “2nd inauguration”, and “3rd inauguration”. Note: All numerical values are approximated.

Components of the proposed model and inauguration dates for the Lima case. Source: Figure by authors

Figure 7
A histogram with a peak at 14 and three dashed lines marking 1st, 2nd, and 3rd inauguration.The horizontal axis ranges from 0 to 16 in increments of 2, and the vertical axis ranges from 0 to 35 in increments of 5. The tallest bar is at 14, with a value of 35. Another tall bar appears at 6, with a value of 20. Most bars are below 15, concentrated on the right half of the axis. Short bars appear at the lower end and center, with values under 10. Three dashed trend lines overlay the bars: a red dashed line peaks at 6, a green dashed line peaks at 10, and a blue dashed line rises sharply to a peak at 14 before declining. Three dotted vertical lines correspond to the three peak values, labeled “1st inauguration”, “2nd inauguration”, and “3rd inauguration”. Note: All numerical values are approximated.

Components of the proposed model and inauguration dates for the Lima case. Source: Figure by authors

Close Figure 7
Table 1

Optimized parameters for the Gaussian model

PortugalPeru
µ25.73516.173
σ10.7727.7297
a661.57252.17

Source(s): Table by authors

Table 2

Goodness of fit and sum of the square of the residuals

Optimized modelR2SSRESSSRES improvement
Gaussian (Portugal)0.454,382 
Proposed (Portugal)0.821,42066%
Gaussian (Peru)0.21961 
Proposed (Peru)0.938791%

Source(s): Table by authors

Table 3

Optimized parameters for the proposed model

PortugalPeru
µ20.3136.0427
σ10.7720.7386
a0661.57252.17
t1168
a1181.7233.430
λ10.26270.3414
t23212
a21,569.930.469
λ20.00230.9999

Source(s): Table by authors

Supplements

References

Abdelsalam
,
H.M.
,
Reddick
,
C.G.
,
Gamal
,
S.
and
Al-shaar
,
A.
(
2013
), “
Social media in Egyptian government websites: presence, usage, and effectiveness
”,
Government Information Quarterly
, Vol. 
30
No. 
4
, pp. 
406
-
416
, doi: .
Agostino
,
D.
(
2013
), “
Using social media to engage citizens: a study of Italian municipalities
”,
Public Relations Review
, Vol. 
39
No. 
3
, pp. 
232
-
234
, doi: .
Agostino
,
D.
and
Arnaboldi
,
M.
(
2016
), “
A measurement framework for assessing the contribution of social media to public engagement: an empirical analysis on Facebook
”,
Public Management Review
, Vol. 
18
No. 
9
, pp. 
1289
-
1307
, doi: .
Banghui
,
Z.
,
Yonghan
,
Z.
and
Guitao
,
K.
(
2020
), “
E-government use via social media as a tool to influences young people's trust in government: an empirical study in a Chinese Municipality
”,
The 21st Annual International Conference on Digital Government Research
, pp. 
16
-
23
, doi: .
Bennett
,
L.V.
and
Manoharan
,
A.P.
(
2017
), “
The use of social media policies by US municipalities
”,
International Journal of Public Administration
, Vol. 
40
No. 
4
, pp. 
317
-
328
, doi: .
Bonsón
,
E.
and
Bednárová
,
M.
(
2018
), “
The use of YouTube in western European municipalities
”,
Government Information Quarterly
, Vol. 
35
No. 
2
, pp. 
223
-
232
, doi: .
Bonsón
,
E.
and
Ratkai
,
M.
(
2013
), “
A set of metrics to assess stakeholder engagement and social legitimacy on a corporate Facebook page
”,
Online Information Review
, Vol. 
37
No. 
5
, pp. 
787
-
803
, doi: .
Bonsón
,
E.
,
Torres
,
L.
,
Royo
,
S.
and
Flores
,
F.
(
2012
), “
Local e-government 2.0: social media and corporate transparency in municipalities
”,
Government Information Quarterly
, Vol. 
29
No. 
2
, pp. 
123
-
132
, doi: .
Bonsón
,
E.
,
Royo
,
S.
and
Ratkai
,
M.
(
2017
), “
Facebook practices in Western European municipalities
”,
Administration and Society
, Vol. 
49
No. 
3
, pp. 
320
-
347
, doi: .
Brazilian Internet Steering Committee – CGI
(
2018
), “
Pesquisa sobre o uso das tecnologias de informação e comunicação no setor público brasileiro: TIC governo eletrônico 2017
”,
available at:
 https://www.cetic.br/pesquisa/governo-eletronico/publicacoes (
accessed
 28 July 2022).
Bryer
,
T.A.
and
Zavattaro
,
S.M.
(
2011
), “
Social media and public administration: theoretical dimensions and introduction to the symposium
”,
Administrative Theory and Praxis
, Vol. 
33
No. 
3
, pp. 
325
-
340
, doi: .
Budi
,
N.F.A.
,
Fitriani
,
W.R.
,
Hidayanto
,
A.N.
,
Kurnia
,
S.
and
Inan
,
D.I.
(
2020
), “
A study of government 2.0 implementation in Indonesia
”,
Socio-Economic Planning Sciences
, Vol. 
72
, 100920, doi: .
Cole
,
R.
(
2009
), “
Social media: what does it mean for public managers?
”,
available at:
 https://icma.org/documents/social-media-what-does-it-mean-public-managers (
accessed
 28 July 2022).
Criado
,
J.I.
,
Sandoval Almazan
,
R.
and
Gil Garcia
,
J.R.
(
2013
), “
Government innovation through social media
”,
Government Information Quarterly
, Vol. 
30
No. 
4
, pp. 
319
-
326
, doi: .
Criado
,
J.I.
,
Pastor
,
V.
and
Villodre
,
J.
(
2018
), “
Measuring social media diffusion in local governments from a longitudinal perspective: adoption, barriers, and perceptions
”,
Public Information and Information Technology
, Vol. 
29
, pp. 
3
-
27
, doi: .
Criado
,
J.I.
,
Villodre
,
J.
and
Meijer
,
A.
(
2019
), “
From experimentation to public service delivery in social media. An analysis of institutionalization dynamics in Dutch local governments
”,
Proceedings of the 20th Annual International Conference on Digital Government Research
, pp. 
342
-
352
, doi: .
Dias
,
G.P.
(
2020
), “
Determinants of e-government implementation at the local level: an empirical model
”,
Online Information Review
, Vol. 
44
No. 
7
, pp. 
1307
-
1326
, doi: .
Dias
,
G.P.
,
Bruzza
,
M.
and
Tupia
,
M.
(
2019
), “
The use of social media by local governments: the case of Manabí’s cantons in Ecuador
”,
EPIC Series in Computing
, Vol. 
63
, pp. 
170
-
181
, doi: .
Dimitrova
,
D.V.
and
Matthes
,
J.
(
2018
), “
Social media in political campaigning around the world: theoretical and methodological challenges
”,
Journalism and Mass Communication Quarterly
, Vol. 
95
No. 
2
, pp. 
333
-
342
, doi: .
Ellison
,
N.
and
Hardey
,
M.
(
2014
), “
Social media and local government: citizenship, consumption and democracy
”,
Local Government Studies
, Vol. 
40
No. 
1
, pp. 
21
-
40
, doi: .
Faber
,
B.
,
Budding
,
T.
and
Gradus
,
R.
(
2020
), “
Assessing social media use in Dutch municipalities: political, institutional, and socio-economic determinants
”,
Government Information Quarterly
, Vol. 
37
No. 
3
, pp. 
1
-
9
, doi: .
Fisher
,
J.
and
Denver
,
D.
(
2009
), “
Evaluating the electoral effects of traditional and modern modes of constituency campaigning in Britain 1992-2005
”,
Parliamentary Affairs
, Vol. 
62
No. 
2
, pp. 
196
-
210
, doi: .
Fisher
,
J.
,
Cutts
,
D.
and
Fieldhouse
,
E.
(
2011
), “
The electoral effectiveness of constituency campaigning in the 2010 British general election: the ‘triumph’ of Labour?
”,
Electoral Studies
, Vol. 
30
No. 
4
, pp. 
816
-
828
, doi: .
Frías-Aceituno
,
J.
,
García-Sánchez
,
I.
and
Rodríguez-Domínguez
,
L.
(
2014
), “
Electronic administration styles and their determinants. Evidence from Spanish local governments
”,
Transylvanian Review of Administrative Sciences
, Vol. 
41
, pp. 
90
-
108
,
available at:
 https://rtsa.ro/tras/index.php/tras/article/view/158/154
Gesuele
,
B.
(
2016
), “
Municipalities Facebook use: which key drivers? Empirical evidence from Italian municipalities
”,
International Journal of Public Administration
, Vol. 
39
No. 
10
, pp. 
771
-
777
, doi: .
Graham
,
M.
and
Avery
,
E.J.
(
2013
), “
Government public relations and social media: an analysis of the perceptions and trends of social media use at the local government level
”,
Public Relations Journal
, Vol. 
7
No. 
4
, pp. 
274
-
291
, doi: ,
available at:
 https://prjournal.instituteforpr.org/wp-content/uploads/2013GrahamAvery.pdf
Gschwend
,
T.
and
Zittel
,
T.
(
2015
), “
Do constituency candidates matter in German Federal Elections? The personal vote as an interactive process
”,
Electoral Studies
, Vol. 
39
, pp. 
338
-
349
, doi: .
Guillamón
,
M.D.
,
Ríos
,
A.M.
,
Gesuele
,
B.
and
Metallo
,
C.
(
2016
), “
Factors influencing social media use in local governments: the case of Italy and Spain
”,
Government Information Quarterly
, Vol. 
33
No. 
1
, pp. 
460
-
471
, doi: .
Gulati
,
G.J.
and
Williams
,
C.B.
(
2013
), “
Social media and campaign 2012: developments and trends for Facebook adoption
”,
Social Science Computer Review
, Vol. 
31
No. 
5
, pp. 
577
-
588
, doi: .
Haro de Rosario
,
A.
,
Sáez-Martín
,
A.
and
Caba Pérez
,
M.C.
(
2018
), “
Using social media to enhance citizen engagement with local government: twitter or Facebook?
”,
New Media and Society
, Vol. 
20
No. 
1
, pp. 
29
-
49
, doi: .
Hofmann
,
S.
,
Beverungen
,
D.
,
Räckers
,
M.
and
Becker
,
J.
(
2013
), “
What makes local governments' online communications successful? Insights from a multi-method analysis of Facebook
”,
Government Information Quarterly
, Vol. 
30
No. 
4
, pp. 
387
-
396
, doi: .
Jans
,
W.
,
Denters
,
B.
,
Need
,
A.
and
Van Gerven
,
M.
(
2016
), “
Mandatory innovation in a decentralised system: the adoption of an e-government innovation in Dutch municipalities
”,
Acta Politica
, Vol. 
51
No. 
1
, pp. 
36
-
60
, doi: .
Kaplan
,
A.M.
and
Haenlein
,
M.
(
2010
), “
Users of the world, unite! The challenges and opportunities of Social Media
”,
Business Horizons
, Vol. 
53
No. 
1
, pp. 
59
-
68
, doi: .
Lameiras
,
M.
,
Silva
,
T.
and
Tavares
,
A.
(
2018
), “
An empirical analysis of social media usage by local governments in Portugal
”,
Proceedings of the 11th International Conference on Theory and Practice of Electronic Governance
, pp. 
257
-
268
, doi: .
Lappas
,
G.
,
Triantafillidou
,
A.
,
Yannas
,
P.
,
Kavada
,
A.
and
Kleftodimos
(
2016
), “
Social media Battles: their impact during the 2014 Greek municipal elections
”,
Journal of Universal Computer Science
, Vol. 
22
No. 
3
, pp. 
375
-
393
, doi: .
Lovari
,
A.
and
Materassi
,
L.
(
2021
), “
Trust me, I am the social media manager! Public sector communication's trust work in municipality social media channels
”,
Corporate Communications: An International Journal
, Vol. 
26
No. 
1
, pp. 
55
-
69
, doi: .
Medaglia
,
R.
(
2007
), “
Measuring the diffusion of eParticipation: a survey on Italian local government
”,
Information Polity
, Vol. 
12
No. 
4
, pp. 
265
-
280
, doi: .
Mergel
,
I.
and
Bretschneider
,
S.I.
(
2013
), “
A three-stage adoption process for social media use in government
”,
Public Administration Review
, Vol. 
73
No. 
3
, pp. 
390
-
400
, doi: .
Mossberger
,
K.
,
Wu
,
Y.
and
Crawford
,
J.
(
2013
), “
Connecting citizens and local governments? Social media and interactivity in major U.S. cities
”,
Government Information Quarterly
, Vol. 
30
No. 
4
, pp. 
351
-
358
, doi: .
Nabatchi
,
T.
and
Mergel
,
I.
(
2010
), “Participation 2.0: using internet and social media: technologies to promote distributed democracy and create digital neighborhoods”, in
Svara
,
H.
and
Denhardt
,
J.
(Eds),
The Connected Community: Local Governments as Partners in Citizen Engagement and Community Building
, pp. 
80
-
87
,
available at:
 https://kops.uni-konstanz.de/handle/123456789/38750
Oliveira
,
G.H.M.
and
Welch
,
E.W.
(
2013
), “
Social media use in local government: linkage of technology, task and organizational context
”,
Government Information Quarterly
, Vol. 
30
No. 
4
, pp. 
397
-
405
, doi: .
Padeiro
,
M.
,
Bueno-Larraz
,
B.
and
Freitas
,
Â.
(
2021
), “
Local governments' use of social media during the COVID-19 pandemic: the case of Portugal
”,
Government Information Quarterly
, Vol. 
38
No. 
4
, 101620, doi: .
Panagiotopoulos
,
P.
,
Moody
,
C.
and
Elliman
,
T.
(
2012
), “
Institutional diffusion of eParticipation in the English local government: is central policy the way forward?
”,
Information Systems Management
, Vol. 
29
No. 
4
, pp. 
295
-
304
, doi: .
Panagiotopoulos
,
P.
,
Bigdeli
,
A.Z.
and
Sams
,
S.
(
2014
), “
Citizen–government collaboration on social media: the case of twitter in the 2011 riots in England
”,
Government Information Quarterly
, Vol. 
31
No. 
3
, pp. 
349
-
357
, doi: .
Pereira
,
M.A.G.
,
Amaral
,
E.F.L.
and
Costa
,
M.M.
(
2012
), “
Some determinants of the existence of government websites in 853 municipalities in Minas Gerais, Brazil
”,
Latin American Research Review
, Vol. 
47
No. 
3
, pp. 
155
-
174
, doi: ,
available at:
 https://www.jstor.org/stable/23322178
Raimo
,
N.
,
L'Abate
,
V.
,
Rella
,
A.
and
Vitolla
,
F.
(
2024
), “
The use of social media in Italian local governments: the effect of the mayor's characteristics
”,
Cities
, Vol. 
150
, 105070, doi: .
Reddick
,
C.G.
and
Norris
,
D.F.
(
2013
), “
Social media adoption at the American grass roots: Web 2.0 or 1.5?
”,
Government Information Quarterly
, Vol. 
30
No. 
4
, pp. 
498
-
507
, doi: .
Rogers
,
E.M.
(
2003
),
Diffusion of Innovations
, (5th ed.) ,
Free Press
,
New York, NY
.
Sáez Martín
,
A.
,
Haro de Rosario
,
A.
and
Caba Pérez
,
M.C.
(
2015
), “
Using Twitter for dialogic communication: local government strategies in the European Union
”,
Local Government Studies
, Vol. 
41
No. 
3
, pp. 
421
-
444
, doi: .
Sandoval-Almazan
and
Gil-Garcia
(
2013
), “
Cyberactivism through social media: twitter, YouTube, and the Mexican political movement, ‘I'm number 132’
”,
Proceedings of 46th Hawaii International Conference on System Sciences
, pp. 
1704
-
1713
, doi: .
Santoso
,
A.D.
,
Rinjany
,
D.K.
and
Bafadhal
,
O.M.
(
2020
), “
Social media and local government in Indonesia: adoption, use and stakeholder engagement
”,
Romanian Journal of Communication and Public Relations
, Vol. 
22
No. 
3
, pp. 
21
-
35
, doi: .
Schlæger
,
J.
and
Jiang
,
M.
(
2014
), “
Official microblogging and social management by local governments in China
”,
China Information
, Vol. 
28
No. 
2
, pp. 
189
-
213
, doi: .
Sharif
,
M.H.M.
,
Troshani
,
I.
and
Davidson
,
R.
(
2015
), “
Public sector adoption of social media
”,
Journal of Computer Information Systems
, Vol. 
55
No. 
4
, pp. 
53
-
61
, doi: .
Silva
,
P.
,
Tavares
,
A.F.
,
Silva
,
T.
and
Lameiras
,
M.
(
2019
), “
The good, the bad and the ugly: three faces of social media usage by local governments
”,
Government Information Quarterly
, Vol. 
36
No. 
3
, pp. 
469
-
479
, doi: .
Song
,
C.
and
Lee
,
J.
(
2016
), “
Citizens use of social media in government, perceived transparency, and trust in government
”,
Public Performance and Management Review
, Vol. 
39
No. 
2
, pp. 
430
-
453
, doi: .
Stone
,
J.A.
and
Can
,
S.H.
(
2019
), “
Investigating factors of twitter use among municipal governments
”,
Journal of Computer Information Systems
, Vol. 
61
No. 
3
, pp. 
267
-
274
, doi: .
Stone
,
J.A.
and
Can
,
S.H.
(
2020
), “
Linguistic analysis of municipal twitter feeds: factors influencing frequency and engagement
”,
Government Information Quarterly
, Vol. 
37
No. 
4
, 101468, doi: .
Sudulich
,
M.L.
,
Wall
,
M.
and
Farrel
,
D.M.
(
2013
), “
Why bother campaigning? Campaign effectiveness in the 2009 European Parliament elections
”,
Electoral Studies
, Vol. 
32
No. 
4
, pp. 
768
-
778
, doi: .
Svidroňová
,
M.M.
,
Kaščáková
,
A.
and
Vrbičanová
,
V.
(
2018
), “
Can social media be a tool for participatory governance in Slovak municipalities?
”,
NISPAcee Journal of Public Administration and Policy
, Vol. 
11
No. 
2
, pp. 
81
-
101
, doi: .
Svobodova
,
L.
,
Bednarska-Olejniczak
,
D.
and
Dittrichova
,
J.
(
2020
), “
Social media and other channels of communication in municipality environment – case study of Hradec Kralove region
”,
Proceedings of the International Scientific Conference Hradec Economic Days
, Vol. 
10
, pp. 
761
-
769
, doi: .
United Nations
(
2020
),
E-government Survey 2020
,
Department of Economic and Social Affairs
,
available at:
 https://publicadministration.un.org/egovkb/en-us/Reports/UN-E-Government-Survey-2020 (
accessed
 28 July 2022).
Warren
,
A.M.
,
Sulaiman
,
A.
and
Jaafar
,
N.I.
(
2014
), “
Social media effects on fostering online civic engagement and building citizen trust and trust in institutions
”,
Government Information Quarterly
, Vol. 
31
No. 
2
, pp. 
291
-
301
, doi: .
Wattal
,
S.
,
Schuff
,
D.
,
Mandviwalla
,
M.
and
Williams
,
C.B.
(
2010
), “
Web 2.0 and politics: the 2008 U.S. presidential election and an E-politics research agenda
”,
MIS Quarterly
, Vol. 
34
No. 
4
, pp. 
669
-
688
, doi: .
Zumofen
,
R.
and
Mabillard
,
V.
(
2024
), “
Debate: improving communication effectiveness or wasting taxpayers' money? The use of social media influencers in public organizations
”,
Public Money and Management
, Vol. 
44
No. 
1
, pp. 
5
-
6
, doi: .

Languages

or Create an Account

Close subscription notice
Close access options