This study aims to examine factors that could explain employees' behavioral intention to use e-learning in the banking workplace in Tanzania. By extending the Technology Acceptance Model (TAM), it incorporates other related factors, like management support, content quality, computer self-efficacy, and subjective norms.
The research model and hypotheses were tested by applying partial least square-structured equation modeling to data collected from 239 employees working in the banking sector in Tanzania.
The results showed that management support and content quality, perceived usefulness, and perceived ease of use positively affect the usage intention of e-learning for employees in the banking workplace. Second, subjective norms and computer self-efficacy indirectly influenced employees' intention to use e-learning through perceived ease of use. Lastly, perceived usefulness was neither impacted by computer self-efficacy nor subjective norms.
By extending the Technology Acceptance Model, this study provides novel empirical data on workplace contexts, contrasting with Tanzania's education-centric research, as well as a comprehensive understanding of the factors influencing intention to use e-learning among employees in the banking industry. Researchers can build upon this to explore other potential factors in different settings.
This study offers a novel contribution by extending TAM to Tanzania's banking workplace, providing robust empirical evidence that external factors like management support and content quality drive perceived usefulness, unlike prior education-focused studies, filling a gap in underexplored workplace e-learning in developing countries. It delivers practical, actionable insights for organizations and policymakers to enhance e-learning utilization.
Introduction
In this age of rapid knowledge and information transfer, organizational learning is key to achieving competitive advantage in the marketplace. Through organizational learning, employees can bridge the gap between academics and the application of knowledge regarding tools and processes in the workplace (Sharma & Bhardwaj, 2016). In addition, this has led to improvement in employee performance, competence, decision-making skills, and fulfilling their training needs (O’Brien, McCarthy, Hamburg, & Delaney, 2019). As such, it is a crucial demand to update their knowledge and skills as per changes in the global markets.
The development of Information and Communication Technology (ICT) has made it simpler for employees to create and share knowledge in the workplace (Teoh and Tan, 2020a, b). A vast array of tools and apps are now available for use in businesses' teaching and learning processes because of the advancement of digital technology (Abanda Maga, Kala Kamdjoug, Fosso Wamba, & Nitcheu Tcheuffa, 2019). As a result, a growing number of businesses, including banks, are beginning to embrace e-learning for staff training in an effort to lower training expenses and give staff members more access to relevant learning materials (Purnomo & Lee, 2013). According to Batalla-Busquets and Pacheco-Bernal (2013) research, e-learning was viewed by European bank personnel as a more modern and adaptable training approach. Furthermore, Sharma and Bhardwaj (2016), emphasized that the use of e-learning successfully meets workers' training demands since it gives them immediate access to training materials while they are on the job, enhances workers' knowledge and abilities, and increases job satisfaction.
In Tanzania, due to the increased demands on workplace training brought about by the COVID-19 pandemic and the dynamic nature of human capital development in the digital age, several private firms, particularly those in the banking industry, have adopted e-learning as one of their training delivery media. The report by the Eastern and Southern Africa Anti-Money Laundering Group (ESAAMLG) of 2021, showed that large banks use e-learning platforms to train their employees on several issues related to money laundering and financing terrorism (ESAAMLG, 2021).
Though it's yet unclear how such e-learning has been employed in the Tanzanian context, banks in Tanzania have started utilizing e-learning technology for staff training in the workplace to benefit from lower-cost training as well as dependable and conveniently accessible information. Furthermore, there is a shortage of empirical data regarding the factors influencing the use and adoption of e-learning in the workplace. Therefore, this study aims to investigate factors that could explain the intention to use e-learning in Tanzanian banking workplaces by extending the Technology Acceptance Model (TAM) and incorporating some additional relevant factors, such as management support, content quality, computer self-efficacy, and subjective norms.
Although, there are several studies in Tanzania (Lashayo & Johar, 2017; Lwoga, 2012; Ngeze, 2017; Mtebe & Raphael, 2018; Mtebe, 2020; Mtani, 2022) that have been conducted using different technology acceptance models and theories in different contexts, such as schools and higher learning institutions with regard to the adoption and use of e-learning, none of the previous studies has focused on the use of e-learning in workplaces especially in banking industry in Tanzania. The existence of this gap triggers more study to understand and explore it in more detail. Thus, the goal of this study is to fill the current research gap and explore the relationships between significant variables that may have an impact on employees' behavioral intention to use e-learning in the workplace.
Theoretical foundation and literature review
Technology acceptance model
Fred D. Davis developed the technological Acceptance Model (TAM) for predicting technological acceptance and utilization (Davis, Bagozzi, & Warshaw, 1989). The Theory of Reasoning Action, which is where TAM originated, makes the assumption that people will use technology intentionally (Yousafzai et al., 2007b). The literature on Information Technology acceptance (IT acceptance) focuses on numerous research streams that examine how and why people use and adopt new IT systems. TAM is a strong and reliable predictive model that is also the most often applied theory in e-learning acceptance research, according to Šumak, Heričko, and Pušnik (2011), systematic evaluation of the available body of literature. Using two distinct variables, perceived usefulness and perceived ease of use, TAM is designed to describe potential users' behavioural intentions of utilizing a technological innovation.
Even though TAM and other user acceptance models have been validated empirically, it is crucial for researchers to still add new external variables to improve the explanatory power of the model (Šumak et al., 2011). External variables are used in the extended TAM to build a conceptual model that describes how individual, social, cultural, and organizational aspects affect people's behavior when it comes to adopting and using technology, particularly e-learning technology (Yousafzai et al., 2007a, b; Cheng, Wang, Moormann, Olaniran, & Chen, 2012; Naika & Yadapadithaya, 2018; Kapo, Mujkic, Turulja, & Kovačević, 2020; Teoh & Tan, 2020a, b; Purnomo & Lee, 2013; Tarhini, Elyas, Ali Akour, & Al-Salti, 2016). It was observed that perceived usefulness and ease of use influence how often employees use e-learning technologies in the workplace environments.
Beyond TAM, this study integrates adult learning theory (andragogy) as articulated by Knowles (1980), which posits that adult learners are self-directed, problem-centred, and motivated by immediate applicability to real-world tasks. In the banking workplace, high computer self-efficacy aligns with andragogical principles by empowering employees to autonomously navigate e-learning platforms, thereby transforming passive training consumption into active, self-regulated skill development. Similarly, organizational learning theory by Argyris (1974) provides a complementary lens for interpreting management support, leadership-driven policies, and resource allocation to cultivate a learning-oriented culture that encourages single and double-loop learning through e-learning systems. This dual theoretical anchoring enriches the extended TAM framework, grounding technology acceptance in the socio-cognitive dynamics of adult professional development and institutional knowledge creation.
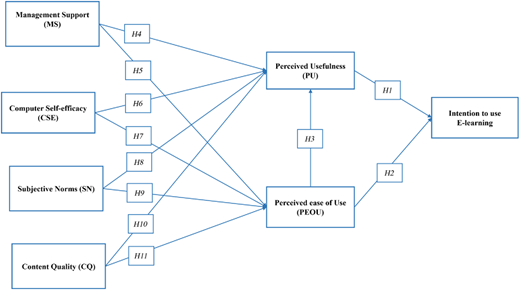
In Figure 1, the study's conceptual model was created based on the identification of important factors by means of a thorough and systematic review of the literature. The model integrates several variables that impact the ongoing usage of e-learning in various settings, including personal, professional, technological, and environmental factors. These external factors include subjective norms, computer self-efficacy, managerial support, and content quality. Therefore, these four external constructs may significantly affect other variables in the TAM.
According to TAM, two belief structures determine an individual's desire to use information technologies: Perceived usefulness, which is defined as the belief that using information technologies will improve one's work performance, and perceived ease of use, the belief that no substantial effort will be spared to use information technologies (Davis, 1989; Davis et al., 1989; Shyu & Huang, 2011). Therefore, it is expected that the effects of external variables on intention to use e-learning are mediated by these two beliefs (Davis et al., 1989).
Through these external variables, management support, which refers to the extent to which organizational leadership provides institutional resources, policy frameworks, and motivational reinforcement for technology adoption (Cheng et al., 2012). It influences perceived usefulness by aligning e-learning with performance goals and improving perceived ease of use through training and technical facilitation. Similarly, content quality pertains to the relevance, accuracy, structure, and accessibility of e-learning materials (Park, Son, & Kim, 2011). High-quality content increases perceived usefulness by delivering job-relevant knowledge efficiently while reducing cognitive load, thereby positively impacting perceived ease of use. Computer self-efficacy reflects an individual's confidence in using digital systems (Esterhuyse & Scholtz, 2016). It primarily influences perceived ease of use, as higher self-efficacy diminishes perceived complexity and encourages proactive engagement with e-learning platforms. Lastly, subjective norms, capture social influence from peers, supervisors, and organizational culture (Venkatesh & Davis, 2000). They shape perceived ease of use by normalizing system use and, in some contexts, perceived usefulness through social validation of its instrumental value.
The external factors influence inner TAM cores (perceived usefulness and perceived ease of use), which mediate to intentions to use e-learning. For instance, management support reinforces computer self-efficacy by providing training, while subjective norms amplify content quality perceptions through peer endorsements. Therefore, this conceptual model provides a comprehensive, multilevel explanation of employees' behavioral intention to use e-learning within the Tanzanian banking workplace.
Hypotheses development for the proposed model
Intention to use E-learning in banking workplace (IU)
Intention to Use (IU) is defined as the behavioural willingness to adopt e-learning (Venkatesh & Davis, 2000). Employees' behavioural intention to include e-learning into routine training, rooted in TAM as a proximal determinant of actual use (Davis et al., 1989). In banking, this translates to planned engagement with platforms for skill development, measurable pre-behaviour. Employees' intention to use the e-learning system in the workplace (IU) is influenced by several factors.
In this study, it was employed as a factor that can be affected by other factors. The willingness of individuals to accept new technologies and incorporate them into their regular job activities is referred to as the intention to use technology (Dumpit & Fernandez, 2017). According to Chatzoglou, Sarigiannidis, Vraimaki, and Diamantidis (2009), intention to use e-learning was found to be positively correlated with perceived usefulness and perceived ease of use. Depending on the organizational structure, a variety of organizational factors may influence an employee's intention to use technology. Lee, Hsieh, and Ma (2010) investigated the relationship between behavioral intention to utilize e-learning in a business setting with several other factors, like task, organizational, and individual characteristics, as well as subjective norms.
Perceived usefulness (PU)
Perceived usefulness, according to Davis et al. (1989), is the degree to which a person believes utilizing a specific technology would improve his or her performance. In a learning context, researchers need to determine whether e-learning tools enhance learners' productivity at work or simplify their learning process. Past research has shown that PU has significant and positive effects on behavioral intention to use e-learning in workplaces (Veloo & Masood, 2014; Chatzoglou et al., 2009; Teoh & Tan, 2020a, b). Therefore, in order to understand technologies acceptance and usage, TAM enables to understand usefulness of the technologies to the users. As a result, the following hypothesis is suggested;
Perceived Usefulness significantly and positively affects the intention to use e-learning.
Perceived ease of use (PEOU)
The degree to which a user thinks using a technology will be simple is known as perceived ease of use (Davis et al., 1989). According to Venkatesh and Davis (2000), PEOU is anticipated to be accepted by users due to their perception that technologies make life easier. The perception of a technology's use is ultimately influenced by its perceived ease of use. Users are more likely to employ a technology because it is simple to use rather than because it is particularly valuable to their work (Chuttur, 2009). Thus, the following hypothesis is suggested;
Perceived Ease of Use significantly and positively affects the intention to use e-learning.
Furthermore, according to TAM, perceived ease of use determines perceived usefulness, meaning that users would find a system more beneficial if it were simpler to use (Chatzoglou et al., 2009; Venkatesh, Morris, Davis, & Davis, 2003). As a result, the following hypothesis is suggested;
Perceived Ease of Use significantly and positively affects Perceived Usefulness.
Management support (MS)
Management support in the context of Information System (IS) use and adoption can be defined as an individual's assessment of the organization's level of understanding the importance of IS and its level of involvement in its implementation (Park et al., 2011). Management support is the key factor in employees' perception of and behavioural intentions towards the use of e-learning in workplaces (Chatzoglou et al., 2009). Plans for integrating technologies into the organization are initiated by upper and middle management, including managers, supervisors, and heads of departments. According to TAM, management support, an external variable to the conceptual model, influences perceived usefulness and perceived ease of use; prior researches also demonstrate a positive association between these variables (Rulevy & Aprilianti, 2021; Cheng et al., 2012). Thus, the following hypotheses are suggested;
Management support significantly and positively affects Perceived Usefulness.
Management support significantly and positively affects Perceived Ease of Use.
Computer self-efficacy (CSE)
Computer self-efficacy is defined as one's belief about his/her ability to accomplish a particular task using a computer. Computer self-efficacy, which may result from its use, would likely hinder the intention to use such a system because computers are the primary tools for completing the learning task in an e-learning environment (Purnomo & Lee, 2013). This indicates that while employees with lower computer self-efficacy may decide not to use e-learning, individuals with higher computer self-efficacy are more inclined to do so. This measure was employed in the study to examine the potential relationship between computer self-efficacy and e-learning utilization. Since it affects the amount of work, perseverance, and learning that occurs, people with high computer self-efficacy will perceive a system as being easy to use and beneficial (Venkatesh & Davis, 2000; Chatzoglou et al., 2009; Lee, Hsiao, & Hadi, 2014). Thus, the following hypotheses are suggested;
Computer Self-efficacy significantly and positively affects Perceived Usefulness
Computer Self-efficacy significantly and positively affects Perceived Ease of Use.
Subjective norms (SN)
Subjective norm is defined as the important people around the user of a certain technology (Yousafzai et al., 2007a, b). People's tendency to act in accordance with the opinions or actions of significant individuals, such as friends and family, there can be social or peer impact on whether or not they use or adopt a specific technology (Abdullah & Ward, 2016). Hence, the intention to use technology is influenced, either positively or negatively, by subjective norm. Thus, the following hypotheses are suggested;
Subjective norms (SN) significantly and positively affect Perceived Usefulness
Subjective norms (SN) significantly and positively affect Perceived Ease of Use.
Content quality (CQ)
Content Quality refers to the relevance, accuracy, and accessibility of e-learning materials (Ramayah et al., 2012). Drawing from IS literature, content quality influences user satisfaction and system usage by ensuring content meets learners' needs (Ramayah et al., 2012). Numerous studies have found that the intention to use a range of technological applications, including e-learning, is influenced by the quality of the content found in the e-learning system (Park et al., 2011). Additionally, studies have reported that content quality is positively related to perceived usefulness (Park et al., 2011). Since content quality and perceived usefulness have a positive relationship, it is reasonable to make hypotheses about content quality in the context of e-learning in the workplace. Thus, the following hypotheses are suggested;
Content Quality significantly and positively affects Perceived usefulness.
Content Quality significantly and positively affects Perceived Ease of Use.
Research methodology
In this study, data were collected using a non-probability purposive sampling technique, targeting employees in Tanzanian banks with e-learning systems. The online survey instrument was distributed to around 350 employees in Tanzania's banking sector. However, only 239 respondents in total completed the survey. A study model from the extended TAM was used as the basis for the creation of a survey instrument. Data regarding respondents' demographic characteristics and the study variables were captured by the instrument. Every item in the instrument was scored using a five-point Likert scale, which goes from strongly disagree to strongly agree. Two experts examined the suggested survey questionnaire to assess its clarity and validity. Full survey items are provided in Appendix, adapted from validated scales (e.g. Davis, 1989 for PU/PEOU; Cheng et al., 2012 for MS) with minor wording for the banking context. All items achieved loadings >0.70 (Table 2), confirming content validity.
The data for the study were analyzed using the Statistical Package for Social Science (SPSS) and Smart PLS 4.1.0.2. Data on frequency and descriptiveness were analyzed using SPSS. The structural models and measurement models were analyzed using Smart PLS. The measurement model looked at the validity and reliability of discriminant validity, convergent validity, composite reliability, construct validity, and reliability analyses.
A one-tailed test with a 95% confidence level and a significance level of 0.05 was used to determine whether each independent variable should be accepted or rejected. T-values and p-values were also obtained. Structural Equation Modeling (SEM) analysis was carried out to test all the hypotheses identified to understand the importance of each independent variable and its contribution to the proposed conceptual model.
Data analysis and results
Demographic profile
Employees of Tanzanian banks in the Dar es Salaam region were used as study participants. The study's unit of analysis was the individual employee of a bank that has an e-learning system in place. The final analysis had 239 responses in total. The research findings in Table 1 show that out of 239 respondents, 59% were female, while 41% were male, and 62.3% were between 31 and 39 years, 23.4% between 40 and 49 years, and the rest of respondents were below 30 years. Moreover, job category results from Table 1 indicate that 77.4% of respondents were from the non-management category and 22.6% of respondents were in the management category.
Validation of the measurement model
Hair, Hult, Ringle, and Sarstedt (2016) proposed a cut-off value of 0.50 for significant loadings. The loadings of each construct's separate components were all highest, whereas the loadings of each cross-loading were lower than the main loading (see Table 2). As a result, the constructs were acceptable.
The average variance extracted (AVE) of a variable must be higher than 0.50 in order for it to show convergent validity (Hair et al., 2016). Since every AVE value was higher than the 0.50 cutoff, the model was shown to have convergent validity.
To show that the study model is reliable, Rho_A, Cronbach's alpha, and composite reliability need to be greater than 0.70 (Hair et al., 2016). While Rho_A is loading oriented, Cronbach's alpha is said to have drawbacks since it assumes that all indicators have equal loadings on the construct and are equally dependable (Hair et al., 2016). As shown in Table 2, Rho_A, composite reliability, and Cronbach's alpha values were all higher than 0.70 in every variable. The model was seen to be reliable as a result.
This study also employed a variance-based approach to test the research model, specifically partial least squares structural equation modeling (PLS-SEM), using Smart PLS 4.1.0.2 software (Hair et al., 2016; Rouf & Akhtaruddin, 2018). The analysis was divided into two phases:
Measurement model; and
Structural model.
The findings meet the criterion put forth by Fornell and Larcker (1981), according to which the AVE square root values ought to exceed the off-diagonal values. Tables 3 and 4 then show the discriminant validity, or the “Fornell and Larcker criterion results, and Heterotrait-Monotrait ratio (HTMT).” The diagonal values in Table 3 are more significant than the correlation between the variables, according to the Fornell and Larcker criterion.
Hair et al. (2016) suggest using the heterotrait-monotrait ratio of correlations (HTMT) to assess discriminant validity and determine whether research items are unrelated to one another to prevent bias or misunderstanding. Lastly, the results of the HTMT are shown in Table 4. Henseler, Ringle, and Sarstedt (2015) state that the HTMT ratio values shouldn't be greater than 0.85. As a result, the model used in this investigation showed discriminant validity.
Standardized root mean square residual (SRMR)
A calculation of the standardized root mean square residual (SRMR) was made to get rid of model misspecification. To have an acceptable model fit, the SRMR value must be less than 0.10. This study's SRMR of 0.083 indicates a satisfactory model fit.
Assessment of structural model
In this article, the t-values and the statistical significance of the path coefficient were calculated using the bootstrapping option. A 95% confidence level was indicated by a one-tailed test with a significance level of 0.05 (refer to Table 5). Table 5 shows all calculated values.
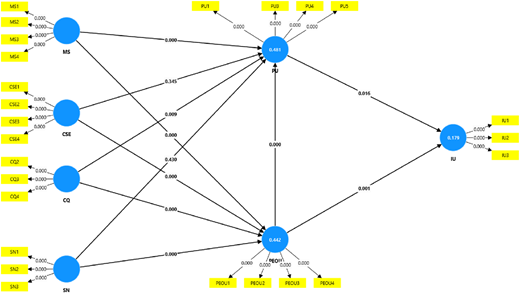
The results of the structural model with p-values between the constructs are shown in Figure 2. Both the H1 (p = 0.016) and H2 (p = 0.001) hypothesized paths showed significant results. Together, those factors affect behavioural intention to use e-learning and account for 17.9% of the variance in behavioural intention to use (coefficient of determination: R2 = 0.179). H3 (p = 0.000), H4 (p = 0.000), and H10 (p = 0.009) all had significant effects as hypothesised. That implies that managerial support, content quality, and perceived ease of use all jointly predicted the perceived usefulness of e-learning in this study. Together, those factors explained 48.1% of the variance in perceived usefulness (coefficient of determination, R2 = 0.481). Consequently, there was evidence for hypotheses 5, 7, 9, and 11. Subjective norms (p < 0.000), computer self-efficacy (p < 0.000), management support (p < 0.000), and content quality (p < 0.000) all predicted perceived ease of use. When combined, these factors accounted for 44.2% of the variance. Perceived usefulness was not significantly impacted by computer self-efficacy. Finally, perceived usefulness was not significantly impacted by subjective norms. As a result, this research did not support hypotheses 6 or 8.
Discussion and conclusion
This research aimed to examine factors that may contribute to Tanzanian bank employees' intentions of using e-learning by expanding upon the TAM model employing a few additional relevant variables, such as content quality, management support, computer self-efficacy, and subjective norms. The addition of four new variables (MS, CSE, CQ, and SN) gives a research model that examines the direct effects of the constructs used in the classic TAM (PEUO, PU, and IU).
Management support
The study's findings show that management support is essential for e-learning to be used in banking contexts. H5 and H4 were both supported. These findings are consistent with earlier research by Rulevy and Aprilianti (2021) and Cheng et al. (2012), which found that management support affects how easily and usefully a technology system is regarded. This means that employees perceive the use of e-learning to be easier due to the support that they get from the management, which leads to the effective usage of e-learning for training purposes. This is so true in Tanzanian contexts, as the use of e-learning in corporate organizations is in its early stages.
The supported hypotheses H4 and H5 demonstrate that MS directly bolsters PU and PEOU, ultimately contributing to higher IU (indirect effect through core TAM). This highlights a key conclusion that without proactive leadership, e-learning adoption in Tanzanian banks stalls, recommending policy mandates for management involvement.
Content quality
The study's findings demonstrated that the quality of the content has a major impact on both perceived usefulness and perceived ease of use. The outcomes align with earlier research findings, as noted by Ramayah et al. (2012). This perception may even affect users' intentions to utilize the system as a whole (Karaali, Gumussoy, & Calisir, 2011). The study's findings confirmed that content quality significantly influences both perceived usefulness (H10: β = 0.178, p = 0.009) and perceived ease of use (H11: β = 0.221, p < 0.001), collectively contributing to employees' intention to use e-learning. This provides a core conclusion that high-quality, job-relevant content is a non-negotiable driver of e-learning adoption in the Tanzanian banking sector. Indirect effect analysis reveals that CQ accounts for approximately 14.3% of the total effect on intention to use e-learning, emphasizing its strategic role. In practice, banks must invest in modular, up-to-date, and interactive training materials aligned with regulatory (e.g. anti-money laundering) and operational needs. Poorly structured or outdated content erodes trust and increases perceived effort, directly undermining usage.
Computer self-efficacy
Hypothesis H6: The study's findings did not support the relationship between computer self-efficacy and perceived usefulness, which is inconsistent with the proposed hypothesis of the study. Prior research by Rulevy and Aprilianti (2021), and Purnomo and Lee (2013) has produced similar findings. The results of the study also demonstrated that staff perceptions of the usefulness of e-learning were unaffected by computer self-efficacy.
Hypothesis H7: The study's findings suggest a significant relationship between computer self-efficacy and perceived ease of use. This is also supported by previous studies showing that this factor significantly affects perceived ease of use (Teoh & Tan, 2020b; Chatzoglou et al., 2009). Since someone who has a high level of computer self-efficacy is more likely to think that using a computer is simple, they will also think that using an information system like an e-learning system is simple. Therefore, computer self-efficacy positively affects perceived ease of use. This is so true because the majority of the employees who responded to this research questionnaire were highly computer literate as well as many of the respondents had gone through an induction program which involves the introduction and demonstration of various important bank systems. This has aided them in developing a sense of self-efficacy in using an e-learning system from an early stage. When someone has computer self-efficacy, they are more comfortable using an e-learning system. (Teoh & Tan, 2020b).
Subjective norms
Hypothesis H8: The study's findings showed that, the relationship between subjective norms and perceived usefulness was not statistically significant as hypothesized in this research. These results are inconsistent with prior research by Rui-Hsin and Lin (2017), and Usman, Septianti, Susita, and Marsofiyati (2020). It is expected that in any organization, employees may perceive a technology to be more useful in helping them to achieve related goals in the job if others in the organization recommend the use of such technology. But, the study's findings showed that subjective norms did not affect employees' perceptions of usefulness similar to the findings by Abanda Maga et al. (2019).
Hypothesis H9: The results of the study showed that perceived ease of use was significantly influenced by subjective norms. This result is consistent with previous studies by Rui-Hsin and Lin (2017), and Usman et al. (2020). Those who are closest to employees such as supervisors, and coworkers are the ones who support and have an impact on the usage of e-learning in workplaces (Rui-Hsin & Lin, 2017).
While subjective norms did not influence perceived usefulness, they strongly predicted perceived ease of use, indirectly shaping intention to use through PEOU. This result leads to a nuanced conclusion that in Tanzanian banking workplaces, social influence operates primarily by normalizing system usability rather than validating instrumental value. Peers, supervisors, and organizational culture reduce perceived complexity by demonstrating routine use, but do not convince employees of performance gains unless supported by tangible outcomes.
Perceived usefulness, perceived ease of use, and intention to use
The study's findings indicate that the employees' behavioral intention to use e-learning is significantly influenced by perceived usefulness. The findings are in line with a number of earlier TAM research (Venkatesh & Davis, 2000; García, López, & Castillo, 2018; Usman et al., 2020) that suggested perceived usefulness was a significant factor in determining the use of new technology. These studies showed that perceived usefulness, which may be mediated by perceived ease of use directly affects intention to use. It was found that behavioral intention to use e-learning was indirectly influenced by perceived ease of use through perceived usefulness. Lastly, Hypothesis H2 indicates that perceived ease of use will have a positive and significant influence on behavioral intention to use e-learning at the workplace. T-values of 3.096 provided evidence in favor of this hypothesis.
Therefore, the results showed that the intention to use an e-learning system in the workplace was affected by perceived usefulness and perceived ease of use. Numerous prior studies have shown this significant relationship, since they are the main constructs used in the widely recognized research model TAM to predict behavioral intention to use e-learning at the workplace (Rulevy & Aprilianti, 2021; Chatzoglou et al., 2009; Hsia, Chang, & Tseng, 2012). It is expected that there will be a higher probability of intention to use an e-learning system when it is seen as easy to use and offers benefits in the workplace.
Conclusions
The study examined factors affecting the use of e-learning among employees in the banking workplace in Tanzania. The conceptual framework was developed based on the identification of factors from various literature and technology acceptance models. Thereafter, a conceptual framework using TAM with additional variables obtained was used to determine factors affecting employees' intention to use e-learning. The overall results from the study indicated that intention to use e-learning was influenced by management support, subjective norms, content quality, computer self-efficacy, perceived usefulness, and perceived ease of use.
Therefore, this study uniquely extends TAM to the Tanzanian banking workplace, revealing that unlike prior higher education-focused studies in Tanzania (e.g. Lashayo & Johar, 2017; Lwoga, 2012; Ngeze, 2017; Mtebe & Raphael, 2018; Mtebe, 2020; Mtani, 2022) management support and content quality are pivotal in professional settings, explaining 48.1% variance in perceived usefulness, offering new evidence for developing countries where workplace e-learning is underexplored. These findings provide novel empirical data on workplace contexts, contrasting with Tanzania's education-centric research.
The banking sector in Tanzania as well as other businesses that aim to deploy e-learning must take into account the factors that influence employees' intentions to use e-learning in the workplace, as suggested by findings from this study. Consequently, this study will provide the technology management team with insights for technology design and utilization.
Also, the findings of this study are very important to policy makers and other stakeholders to understand how they can accelerate the usage of e-learning technologies among employees in workplaces. This is because factors influencing the usage of e-learning were discussed in detail, and these factors are very useful to any organization including those from the public sector and other institutions that want to use and implement e-learning effectively. Additionally, the study's findings add to the body of knowledge, particularly in the fields of workplace learning and educational technology, as they can assist experts like human resource managers in managing employees' learning and development in developing countries.
Appendix
Survey Instrument Table A1 with sample items using 5-point Likert (1 = Strongly Disagree, 2 = Disagree, 3 = Neutral, 4 = Agree, 5 = Strongly Disagree)