

Communication in the virtual environment can be challenging for participants because it lacks physical presence and nonverbal elements. Participants may have difficulties expressing their intentions and emotions in a primarily text-based course. Therefore, the use of visual communication elements such as pictographic and typographic marks can be important in the communication of intent and meaning. Quantitative measures were used to analyze the use of several images and characters in computer-mediated communication in 1 graduate-level course delivered completely online in fall 2004 and 2005. Results show course participants used a number of different visual cues in order to express themselves. A strong relationship between the number of elements and categories used by participants in the threaded discussion posts and chat sessions existed. However, there was a very weak relationship between the use of visual cues between the instructor and learners. In addition, content analysis was used to qualitatively analyze discourse in the threaded discussion fora. The investigation revealed several use patterns in asynchronous and synchronous communication.
Introduction
In fall 2006, nearly 3.5 million learners were enrolled in online courses—an increase of almost 10% over the previous year (Allen & Seaman, 2007). Ninety percent of institutions utilize asynchronous and 43% use synchronous computer-mediated communication to facilitate online interaction between participants (Waits & Lewis, 2003). Online learning has provided opportunities to students who previously were unable to have access to higher education. Other benefits of online learning that have been reported are convenience and flexibility (Bastiaens & Martens, 2000; Belanger & Jordan, 2000; Bender, 2003; Bolliger, 2003; Lau, 2000).
Learning is a social process and “social interaction is a key element in online learning” (Northrup, 2001, p. 32). There is a need to design interaction into an online course (Keefe, 2003; Mabrito, 2004). Henri and Pudelko (2003) describe how participants in learning communities construct knowledge—it is constructed “during the realization of projects that value negotiation of meaning and stems from participation as well as form reification” (p. 481). Hence, communication and interaction in the form of dialog and discussion are vital in the learning process and the learner's knowledge construction.
Communication can be defined as a system with the use of common symbols perceived by all senses in order to exchange meaning (Birdwhistell, 1970) and has two dimensions: verbal and nonverbal. These dimensions are difficult to define, according to Knapp and Hall (1992). Even though most individuals define verbal communication as an exchange with words and nonverbal communication as anything other than words, this definition is not entirely accurate because both dimensions are interdependent “in the flow of conversation” (Birdwhistell, p. xi).
The absence of nonverbal communication is perceived as a drawback of computer-mediated communication (CMC) (Krohn, 2004) because we rely on nonverbal elements to interpret meaning. The transmission of messages and the conveyance of their intent and meaning can be a difficult endeavor, but it is even more difficult in the online environment where messages have a high potential for misinterpretation because nonverbal elements are not present.
Theoretical Framework
Researchers have reported that disadvantages in the online environment include limited communication, interaction, and social presence (Belanger & Jordan, 2000; Rourke, Anderson, Garrison, & Archer, 1999). Other challenges include technical difficulties, time management, misconceptions, and access to technology (Bolliger, 2003; Lau, 2000; Lobry de Bruyn, 2004). Because students and instructors experience the transactional distance defined by Moore (1997) and are separated by space and time, participants may miss face-to-face and social interaction if the course is completely online and the course design includes primarily text-based communication. Online learners may have anxieties and feel isolated from their peers and instructors (Hara & Kling, 2000; Northrup, 2002; Saade & Kira, 2007; Shaw & Polovina, 1999). This can influence their level of comfort (Aragon, 2003), satisfaction (Gunawardena, & Zittle, 1997), and perceived learning (Ouzts, 2006; Polhemus, Shih, & Swan, 2001; Richardson & Swan, 2001). According to Northrup (2001) forming and nurturing relationships in the online environment is important in the collaboration and communication process and can influence learning outcomes.
Social Presence
According to Rovai (2000), experts determined that sense of community is closely related to positive learning outcomes. Verbal and nonverbal communication elements are needed in order to form close personal relationships that can sustain a community of learners. One of the factors that can influence the sense of community in the online environment is social presence.
Social presence has been defined “as the degree of feeling, perception, and reaction to another intellectual entity in the CMC environment” (Tu & McIsaac, 2002, p. 146). Several experts have addressed social presence and attempted to measure it (Perse, Burton, Kovner, Lears, & Sen, 1992; Short, Williams, & Christie, 1976; Tu, 2002). Earlier studies concentrated on measuring social presence of different communication media such as telephones or televisions. According to Rice and Williams (1984), researchers differentiated between media and social presence based on media attributes such as the restriction of nonverbal aspects. Studies conducted by Short et al. focused on the relationship between the social presence of the media and certain tasks.
Wiener and Mehrabian (1968) introduced the immediacy model. Mehrabian (1971) defines immediacy as behavior that enhances closeness and reveals feelings and increases social presence. Cutler (1995) indicates that sharing personal information contributes to a feeling of presence. He writes that social presence in a social space is more complex than simply an awareness of the being of one another. He suggests that “in interactive media such as CMC a new, mutual sense of interaction is essential to the feeling that others are there” (p. 18).
Lack of Physical Presence
Opponents of e-learning argue that the virtual classroom “lacks physical presence … body language and tone of voice associated with it” (Bender, 2003, p. 6). Feenberg (1989) refers to CMC as impersonal, sterile, and artificial. Feenberg indicates that “it is disturbing to do without nods of the head, smiles, glances, tacit signs which in everyday conversation take the place of words” (p. 24). Feenberg argues the most successful and complete communication exchange takes place when a person is physically present.
These arguments could lead us to reason that CMC is inferior to face-to-face communication because of the lack of social context cues that are important in the formation of close social relationships. “As cues are fewer, social presence is lower, and as social presence goes down so does sense of community” (Rovai, 2000, p. 290).
Due to the absence of these elements, the written word is even more important in the online environment because it is one factor that affects the quality of interaction. For example, frequent, positive, and constructive feedback by the instructor and peers is considered instrumental in student learning, yet written words may sound much harsher in text-based form than originally intended by the author. Other common rituals in a physical classroom environment, such as small talk before or after class sessions, occur rarely in the virtual environment, simply because learners are physically separated and may never be logged in at the same time; hence, social exchanges are less spontaneous even if virtual student lounges are provided.
Listening in Cyberspace
In a physical classroom environment we can indicate that we are listening to one another with the use of verbal cues. Daloz (1999) argues that listening is a powerful intervention. Listening to our students can have a profound impact on students’ personal and professional growth. This fact provides us with an interesting challenge in the online learning environment. It is difficult to convey that one is truly listening in cyberspace―because we cannot actually hear voices and inflections (Bender, 2003), see facial expressions, gestures, posture, or detect eye contact.
According to Bender (2003), “listening implies some sort of encouragement on the part of the receiver of information―by a smile, a nod of the head, a leaning forward of the body―to impart to the speaker that the words are having an impact” (p. 89). Because of the visual cues we provide in the brick and mortar classroom, students are typically aware of whether we are listening or not. In the online classroom, it is more challenging to signal that we are ready to listen to one another. And even when we are listening attentively, it is difficult to decode the sender's emotional response.
Overcoming Shortcomings
In order to overcome shortcomings of CMC and to limit miscommunication and misperception, learners and teachers may use textual symbols such as pictographic and typographic marks to express social emotion orientation, meaning, and intent of messages more clearly (Aragon, 2003; Liu & Ginther, 2001; Sixl-Daniell & Williams, 2005). Crystal (2001) indicates that Internet users attempt to express emotions by using more exclamation points and emoticons. According to Liu and Ginther, several researchers propose the use of pictographs or typographic marks in CMC because they convey emotions and clarify intent. Gunawardena and Zittle (1997) report that students who use emoticons experience a higher sense of social presence. Tu and McIsaac (2002), who describe CMC as lean, found students used “emoticons and paralanguage to compensate for the lack of social context cues” (p. 143). Emoticons and their use in CMC such as electronic mail and chats have been well documented in the professional literature (Cochenour & Rezabek, 1998; Krohn, 2004, Murphy & Collins, 1997; Sixl-Daniell & Williams, 2005). However, there is a lack of research on other characters such as abbreviations and punctuation characters added for emphasis or expression of emotions in threaded discussion fora and chat rooms in CMC.
Communication in the online environment can be difficult. In order to limit miscommunication and misconception, participants may use textual symbols such as pictographic and typographic marks. The research questions are: How are learners using visual cues? Is there a relationship between instructor and student use of visual cues? Is there a relationship between visual cues used in asynchronous and synchronous CMC? Are there use patterns that emerge?
Method
Participants
Nineteen individuals participated in an online graduate-level course offered at a Mid-western university in fall 2004 and 2005. In 2004, 11 students were enrolled in the course. The following year, seven students participated in the same course. The same instructor taught the course each year. Fifteen participants were female and 14 of them pursued graduate studies; their ages ranged from 21-54.
Course requirements included the participation in weekly threaded discussions or chat sessions and posting several original thoughts on a weekly basis. In some of the topics, replies to other participants were mandatory. Participants were divided into two groups and team leaders were assigned each week. In addition, every learner presented a research paper in a chat room or in a threaded discussion forum. The instructor held weekly online office hours in a chat room.
Procedures
A content analysis was performed on discourse facilitated with the use of communication tools (threaded discussion fora and chat rooms) during both years. The course was designed to teach students how to facilitate e-learning and was delivered online in its entirety―the course structure remained the same. Participants were introduced to a resource section in their textbook that included an extensive list of visual cues during the 8th week of the semester. The course was delivered with the use of a course management system.
Nonverbal cues include images and characters added for emphasis (Gajadhar & Green, 2005). Visual elements included emoticons, abbreviations, and punctuation characters that participants used in order to draw attention to parts of their messages visually to express emotions and clarify their meaning. Frequencies of the use of visual elements used by students and the instructor during the 15-week semesters were recorded and plotted. Reasons for use of these visual cues, as categorized by Gajadhar and Green, were sorted and frequencies were recorded. Correlation coefficients were calculated to determine whether or not there was a correlation between the use of elements by the instructor and students, and the number of elements by type and category used by all participants on a weekly basis within the asynchronous and synchronous communication tools.
Additionally, all message components in the threaded discussions were coded as either social-oriented or task-oriented to determine their level of use. Henri (1992) developed a framework to guide the analysis of online discourse that includes five dimensions. One of these dimensions is social. Henri defines socially oriented statements as messages that do not directly pertain to content. For example, message elements about personal issues, introductions, or jokes were coded as social. In order to adapt the framework to the needs of the study, the social cue dimension was used and a task dimension was added. Task-oriented posts are messages that either relate to content or assist participants in the accomplishment of a task (e.g., organizing a required activity or assignment).
Two weeks (week 9 and 13) of threaded discussion data in each semester were selected purposefully and analyzed quantitatively and qualitatively. The rationale for selecting these two weeks was that they fell before and after the weeks in which student presentations were scheduled. Messages were categorized as social-oriented, task-oriented, and mixed-mes-sages and recorded sequentially; visual cues that appeared within these categories were also recorded. The data were sorted into actual days messages were posted within the units (e.g., day one, day two, and so forth) in order to determine when certain types of messages and cues appeared frequently.
Results
Frequencies
Fall 2004. Overall, 4,566 threaded discussion postings in 86 discussion topics were generated by 12 participants over the 15-week period. The range for student postings was 115-733 (M = 358.36) and the instructor generated 13.56% of all postings. In addition, 24 chat sessions were archived; the frequency of chat sessions was between 0 to 4 per week. Two of the 11 students chose to facilitate their presentations in a chat room.
All of the participants used visual cues during the 15-week period in the threaded discussion and chat sessions. Participants used a total of 1,989 cues; the threads included 1,526 and the chat sessions included 463 visual cues. By far, participants used multiple periods the most, followed by smiley faces and words with all capital letters (Table 1).
Frequencies of Visual Cue Types
| Threaded Discussion (TD) | Chats | Total | ||||
|---|---|---|---|---|---|---|
| 2004 | 2005 | 2004 | 2005 | TD | Chat | |
| Multiple .. | 633 | 549 | 306 | 221 | 1,182 | 527 |
| :) | 553 | 135 | 57 | 46 | 688 | 103 |
| Multiple - - | 35 | 392 | 21 | 100 | 427 | 121 |
| All capital letters | 141 | 104 | 23 | 14 | 245 | 37 |
| Multiple !! | 64 | 24 | 14 | 7 | 88 | 21 |
| Multiple ?? | 33 | 23 | 7 | 6 | 56 | 13 |
| :( | 28 | 11 | 3 | 1 | 39 | 4 |
| LOL | 16 | 1 | 19 | 0 | 17 | 19 |
| ?! | 14 | 12 | 0 | 4 | 26 | 4 |
| <wave> | 0 | 2 | 8 | 5 | 2 | 13 |
| S | 5 | 0 | 5 | 0 | 5 | 5 |
| BRB | 0 | 6 | 0 | 1 | 6 | 1 |
| IMHO | 3 | 1 | 0 | 0 | 4 | 0 |
| AFK | 0 | 1 | 0 | 2 | 1 | 2 |
| BTW | 1 | 1 | 0 | 0 | 2 | 0 |
| LMK | 0 | 1 | 0 | 0 | 1 | 0 |
| Total | 1,526 | 1,263 | 463 | 407 | 2,789 | 870 |
Participants used visual cues to pause or think; add emphasis; express agreement, disagreement, or confusion; indicate the end of a statement; joke; ask questions and ask for clarification; apologize; and communicate other positive and negative emotions. Students and the instructor used cues overwhelmingly in order to pause while writing their statements, replacing punctuation elements such as the period and semicolon, communicate positive emotions to others, and to exit a conversation (Table 2).
Frequencies of Visual Cue Categories
| Threaded Discussion (TD) | Chats | Total | ||||
|---|---|---|---|---|---|---|
| 2004 | 2005 | 2004 | 2005 | TD | Chat | |
| Pause | 390 | 653 | 226 | 251 | 1,043 | 477 |
| Positive emotion | 343 | 96 | 61 | 38 | 439 | 99 |
| Exit | 169 | 113 | 76 | 49 | 282 | 125 |
| Add emphasis | 201 | 122 | 37 | 21 | 323 | 58 |
| Joke | 201 | 40 | 13 | 8 | 241 | 21 |
| Clarification | 30 | 145 | 21 | 25 | 175 | 46 |
| Think | 71 | 28 | 9 | 1 | 99 | 10 |
| Question | 26 | 18 | 6 | 5 | 44 | 11 |
| Confusion | 26 | 20 | 4 | 5 | 46 | 9 |
| Agreement | 33 | 6 | 7 | 0 | 39 | 7 |
| Negative emotion | 28 | 11 | 3 | 1 | 39 | 4 |
| Abbreviation | 4 | 10 | 0 | 3 | 14 | 3 |
| Disagreement | 4 | 1 | 0 | 0 | 5 | 0 |
| Total | 1,526 | 1,263 | 463 | 407 | 2,789 | 870 |
Fall 2005. Participants interacted in 85 threaded discussion topics and generated 2,219 posts. The range for student postings was 162-369 (M = 267) and the instructor posted 17.89% of threads. The highest number of messages was generated in discussion forums in which student presented their research papers. Several chat sessions were held; however, only 15 of the sessions were active chats (sessions with no activity were weekly nonmandatory office hours). Two of the seven students presented their research papers in the chat room. The highest number of chat sessions occurred during Week 3 and 5.
All participants used visual cues in their communications. A total of 1,670 visual cue occurrences were recorded. Most visual cues (1,263) were used in the threaded discussion forums (Table 1). The three most used cues included multiple periods, multiple hyphens, and smiley faces. The three categories with the highest number of cues were pausing, clarifying messages, and exiting conversations (Table 2).
Correlations of Cues and Users
There was a statistically significant correlation at the .01 alpha-level between the frequencies recorded by element type used in threaded discussion and chat sessions. The relationship between the number of occurrences of expression elements used by all participants in the threaded discussions and chats was strong in 2004 and 2005 at the .01 alpha level, r = .827 and r = .973 respectively.
Furthermore, a two-tailed bi-variate correlation analysis indicated that a statistically significant relationship between the frequency counts of categories of cues used in the threaded discussions and chat sessions exists in 2004 (r = .808; а = .01) and 2005 (r = .988; а = .01).
In order to determine if there was a relationship between the use of nonverbal elements used by the instructor and the students in the threaded discussions and the chat sessions, correlation coefficients were calculated. The analysis reveals relationships were weak for both semesters in the threaded discussion (r = .477 and r = .118) and the chat room (r = .379 and r = .392).
Use Patterns
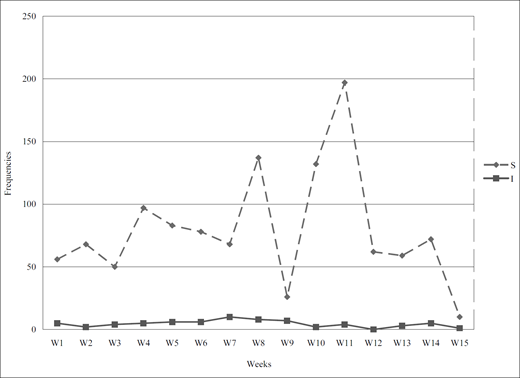
Threaded discussions. The ranges of numbers of visual cues used by students and the instructor in the discussion forum in 2004 were 17 to 260 and 1 to 15, respectively. The level of instructor use of cues remained relatively steady, whereas student use varied tremendously with the highest use recorded in weeks 11, 12, and 13. The majority of student online presentation days fell within those three weeks. Because students needed to actively participate during the presentation sessions, it is no surprise that the highest level of cue usage occurred during those times―the number of posts also was very high (Figure 1). In 2005, the ranges of numbers of visual cues used by students and the instructor in the discussion forum were 10 to 197 and 0 to 10, respectively. Frequencies of cues used by students varied greatly with the highest use recorded in weeks 8 and 10—interestingly, student presentations were scheduled during week 10, but not during week 8. The instruc tor's use remained relatively constant (Figure 2).
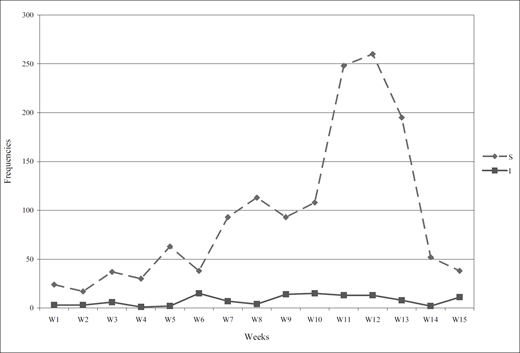
Weekly Number of Cues Used by Students and the Instructor in the Discussion Forum in 2004
Weekly Number of Cues Used by Students and the Instructor in the Discussion Forum in 2004
Weekly Number of Cues Used by Students and the Instructor in the Discussion Forum in 2005
Weekly Number of Cues Used by Students and the Instructor in the Discussion Forum in 2005
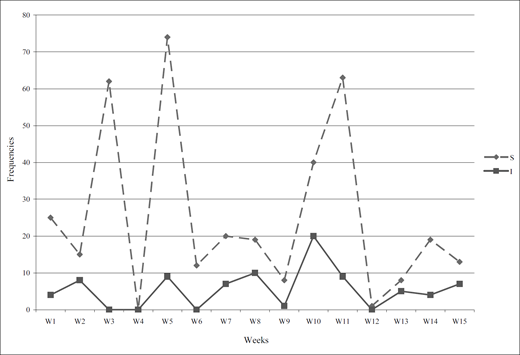
Chat sessions. In 2004, the range of weekly cues used by students and the instructor in the chat rooms were 0 to 74 and 0 to 20, respectively. Here, the highest number of sessions (N = 4) took place during week five. Subsequently, the highest level of use of cues was recorded during that particular week (Figure 3).
Weekly Number of Cues Used by Students and the Instructor in the Chat Room in 2004
Weekly Number of Cues Used by Students and the Instructor in the Chat Room in 2004
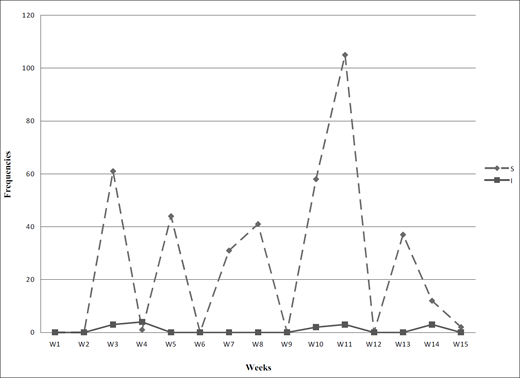
The range of weekly cues in the chat sessions used by students and the instructor in 2005 were 0 to 105 and 0 to 4, respectively. Here, the highest number of sessions (N = 3) took place during the 3rd and 5th week. In contrast to the data from 2004, the highest level of cue use was not recorded during those particular weeks. Instead, the highest number of cues was reported in Week 11 during which students made their presentations (Figure 4).
Weekly Number of Cues Used by Students and the Instructor in the Chat Room in 2005
Weekly Number of Cues Used by Students and the Instructor in the Chat Room in 2005
Individual cue use. During both semesters, there was a difference in individual use of visual cues. Some participants used visual cues frequently and consistently in the threaded discussions. Others used them sparingly from the beginning of the course and continued to do so. In both semesters, the two individuals who used visual cues the most accounted for nearly 40% of all visual cues posted in the threaded discussions.
Social-oriented and task-oriented messages. All message components were coded as either social- or task-oriented messages. In 2004, 51% of components in all messages were coded as social-oriented messages. The majority of visual cues (67%) were included in these messages. In contrast, in 2005, the majority of message components were task-oriented (54%) and the majority of cues (56%) were found in them.
An analysis of the posts revealed that participants during both semesters tended to be more task-oriented at the beginning of a discussion. They focused on answering posed questions without the inclusion of many social-oriented messages. They continued the discussions by mixing social and task-oriented elements in subsequent posts, typically agreeing and adding other content-related thoughts. The majority of visual cues during the first week of the discussion were used in mixedmessage posts. During the next week, the highest use of cues appeared in social-oriented posts.
Discussion
In 2004, 12 individuals used a total of 1,989 and an average of 153 visual cues. In contrast, eight participants in 2005 posted a total of 1,670 visual cues during the semester―an average of 209 cues. The cues that had the highest use (83%) during both years were: multiple periods, smiley faces, and multiple dashes. Multiple periods and hyphens often replaced proper sentence structure by combining several fragmented sentences. According to Crystal (2001), Internet users are rapidly changing the English language.
The majority of cues were posted to visualize pause, positive emotion, and a user's exit; these accounted for 67% of all cues posted during both semesters. These results warrant further investigation as to why individuals in the online environment use them so frequently.
Lobry de Bruyn (2004) suggests instructors should model behavior in the classroom by introducing elements related to social presence into the online classroom. Instructors can encourage participants to use visual cues and model their use. Interestingly, there was a weak relationship between the use of cues between the instructor and the students. However, many college students have used chat rooms or instant messaging tools; the researcher did not expect to find a strong relationship.
There was a strong relationship between the number of cues used in the threaded discussion posts and the number of messages posted to the topics. Highly interactive discussion topics yielded the most posts and subsequently the highest number of cues used by students. A higher number of chat sessions during the week yielded the same results regarding the level of use of cues by both types of participants―the instructor and students.
Some visual cues were used more often in the chat room in comparison to the threaded discussion. Both communication tools have advantages and disadvantages and can be useful in accomplishing different tasks. For example, the cues <wave>, AFK, and LOL were used more frequently in the chat room. Threaded discussion tools are asynchronous and allow users to think, reflect, and formulate a reply. Chat rooms are synchronous and conversations have the tendency to move quickly not allowing users much thought or reflection. Perhaps for this reason, participants liked using abbreviations.
An examination of the data collected in 2004 and 2005 reveals that the correlation coefficients of both the elements and categories used in the threaded discussions and chats is high and very high. However the relationship between the elements used with both tools is stronger in 2005 (r = .0.973, a = .01 and r = .988, a = .01) than in 2004 (r = .827, a = .01 and r = .808; а = .01). These results indicate that the sample in 2005 used the visual cues both more consistently and with the same intent in the threaded discussion forum and chat room.
Analysis of the data revealed that certain individuals used visual cues much more frequently than others. The individuals who used these cues continued their use throughout the semester consistently. Others who did not use them in the beginning of the semester used them sparingly as the semester continued. Cochenour and Rezabek (1998) suggest that “the use of emoticons may be a persistent characteristic of given individuals” (p. 214). The data collected in this study certainly support their conclusion.
When examining the sequence of messages in threaded discussions in relationship to social-oriented and task-oriented messages, it was interesting to find that participants concentrated on the task first without using many social elements. The social chatter that often takes place in a physical classroom setting before a class session or at the beginning of a collaborative activity did not occur. Once the task was almost or fully accomplished, however, participants allowed themselves to engage in a more social-oriented conversation.
During both semesters, participants posted a high level of social-oriented messages. While these messages can be distracting or even disruptive, they can support student learning (Henri, 1992) because they may reflect learners’ feelings of belonging to the group and influence learners’ perceptions pertaining to a high level of emotional support. These messages may be the foundation for creating one's virtual identity and increasing the feeling of social presence in the online environment.
In 2004, the majority of visual cues were included in social-oriented messages. In the following year, the majority of cues were recorded in task-oriented messages. These results were surprising. The composition of students in both semesters was similar in age. In both semesters, approximately 72% of students had no prior online course experience and the majority attended on-campus courses. The only major differences between the two groups were the number of students enrolled and that the group in 2005 included only females.
Several limitations need to be noted. First, the population was geographically limited because the study was conducted at one institution. Second, the discourse in only one course that was taught in two semesters was analyzed. Third, given the nature of the course, students who enrolled may have been more willing to use visual cues. Last, the samples were selected because of convenience and were small. Future research studies should be conducted in other geographical regions, with a larger number of participants or courses.
Conclusion
Sixl-Daniell and Williams (2005) suggest that classroom-based or traditional education could be perceived as superior when compared to e-learning because of the barriers CMC poses. The authors challenge this viewpoint and contend that nonverbal communication is present in the online environment. Results of this study suggest that some of the earlier criticisms of CMC are not warranted; however, further investigation of these issues is necessary.
Teaching and learning in cyberspace is different than in a brick and mortar classroom. Rovai (2000) argues that instructors should “improve feelings of social presence” (p. 290). Online instructors as well as students have to make adjustments in the way they interact, communicate messages and their meaning, form relationships, and collaborate in teams. Liu and Ginther (2001) propose several verbal and nonverbal strategies to facilitate “the interaction and relationship between the instructor and the students in both asynchronous and synchronous CMC” (¶17).
Oblinger and Oblinger (2005) found that college students are more digitally visually literate than ever before. The new generation of digital learners is already familiar with visual cues because they use them in their daily personal technology-mediated communication for virtual social gatherings with smart phones, instant messengers, etc. The use of textual symbols and expressions in the academic environment could enhance the quality of interaction and communication and reduce the potential for misinterpretation and conflict (Sixl-Daniell & Williams, 2005).
Tu and McIsaac (2002) reported that many participants in their study were greatly concerned about “misunderstanding” and that students responded positively to the use of visual cues. The authors conclude that instructors can increase the level of interaction in the online environment through the promotion of informal relationships among participants.
The use of visual clues can contribute to the clear expression of meaning and emotion and, therefore, support the formation of relationships, hence increase the level of social presence and feeling of community. With the use of different information communication technologies and use of visual cues, we may be able to redefine CMC, and e-learning may have the potential to finally emerge as an equivalent delivery system in education and training. However, further investigations of how to increase the level of physical and social presence and how to speak and to listen in CMC supported communication environments are clearly needed.
