Skip to article sections
Purpose

This study aims to examine the relationship between digital transformation search volume and stock returns in the Vietnamese stock market.

Design/methodology/approach

The authors collected weekly data from Google Trends and vn.investing.com, spanning from week 33 of 2019 to week 32 of 2023. Using this data set, the authors used various quantitative approaches, including VAR-Granger, Ordinary Least Squares (OLS) and Copula, to test the relationships between variables.

Findings

The results obtained from VAR-Granger analysis reveal a unidirectional causality from digital transformation search volume to the stock returns of VN-Index, VN-30 and VN-100. Findings from the OLS indicate a negative lagged impact of search volume on digital transformation for stock returns. Moreover, using the Copula approach, the authors determine that the structural dependency between the search volume for digital transformation and the VN-Index follows a normal distribution. This suggests that simultaneous positive and negative changes between the variables are equally likely to occur.

Research limitations/implications

The study is meaningful further research.

Practical implications

The study is meaningful for stakeholders: investors and policymakers.

Originality/value

By offering these insights, this paper contributes to a deeper understanding of the relationship between digital transformation and firm performance within the stock exchange market.

Digital transformation (DT) has emerged as a critical driver of change in contemporary organizational environments, fundamentally altering the way firms operate, compete and deliver value. Across both public and private sectors, digital strategies are being rapidly adopted to enhance operational efficiency, strategic agility and customer responsiveness in a data-driven economy. In the academic domain, DT has garnered increasing attention for its potential to influence key firm-level outcomes, including productivity gains, cost reduction and strategic alignment (Do, Pham, Thalassinos, & Le, 2022; Guo & Xu, 2021; Masoud & Basahel, 2023; Ren, Lee, & Hu, 2023). Despite this growing body of literature, empirical evidence on the relationship between DT and firm performance remains inconclusive and highly fragmented.

A core reason for this fragmentation lies in the methodological diversity and lack of standardization in measuring DT. Numerous studies rely on survey-based instruments to gather subjective assessments from firm managers (Masoud & Basahel, 2023; Ribeiro-Navarrete, Botella-Carrubi, Palacios-Marqués, & Orero-Blat, 2021), which are often limited by biases, low generalizability and delayed data availability. Other approaches, such as the use of binary indicators based on public announcements (Peng & Tao, 2022), risk oversimplifying the complex and evolving nature of DT. More advanced methods, including text mining of corporate communications (Ren et al., 2023), provide greater objectivity but remain constrained by firms’ self-reported narratives.

Moreover, contextual heterogeneity, including national digital readiness, firm size and sectoral characteristics, further complicates empirical generalization. For instance, studies conducted in China (Guo & Xu, 2021; Ren et al., 2023), Saudi Arabia (Masoud & Basahel, 2023) and Sweden (Jardak & Ben Hamad, 2022) have yielded disparate findings, ranging from significantly positive to negligible or even negative effects of DT. These inconsistencies underscore the urgent need for more standardized, externally valid and real-time indicators that can meaningfully capture the dynamics of DT and its perceived value in capital markets.

In response to this gap, the present study proposes a novel approach that uses digital trace data, specifically the Google Search Volume Index (GSVI), as a behavioral proxy for public or investor attention to DT. Online search behavior increasingly reflects collective awareness and interest in socioeconomic and technological developments, making GSVI a dynamic and observable indicator that overcomes many of the limitations associated with firm-reported or survey-based data. Despite its potential, GSVI remains underused in the context of DT research.

This study examines the relationship between DT attention, as measured by GSVI and firm performance, as proxied by stock returns on the Ho Chi Minh Stock Exchange (HOSE) in Vietnam. Vietnam presents an ideal empirical setting due to its strong national commitment to digitalization and the availability of high-quality financial and behavioral data. Using three complementary econometric techniques, including Vector Autoregression with Granger Causality (VAR-Granger), Ordinary Least Squares (OLS) and the Copula approach, the study provides a multidimensional analysis of how DT awareness affects firm-level financial outcomes. This contribution not only introduces a novel measurement framework but also advances the empirical understanding of DT in emerging market contexts.

Using a search index as a proxy for market sentiment, although inherently indirect, has gained substantial recognition in the digital era (Desagre & D’Hondt, 2021; Mellon, 2014). This recognition stems from the ability of search data to offer timely and precise reflections of public interest and investor behavior (Fan, Chen, & Liao, 2021). Search trends serve as a collective indicator of market sentiment, capturing shifts in attention and providing valuable signals for forecasting investment behavior (Huang, Rojas, & Convery, 2020). In rapidly evolving markets, understanding investor sentiment in real time is challenging; however, internet search data addresses this limitation by delivering near-instantaneous insights into emerging concerns and interests.

The strategic use of Google search trends has proven effective in identifying changes in investment dynamics and anticipating stock market movements (Y. Li, Goodell, & Shen, 2021; Smales, 2021). Unlike traditional sentiment indicators, search data is less prone to individual bias, offering a more aggregated and representative measure of public interest (McGinn, Taylor, McColgan, & McQuilkan, 2016; Scharkow & Vogelgesang, 2011). Its resistance to manipulation further enhances its reliability. While still indirect, search indices provide a significant methodological advancement by delivering both real-time and high-frequency sentiment measures. This makes them an increasingly valuable tool for understanding market behavior in data-driven financial research.

Google serves as a prominent example of how internet tools are integrated into both personal and professional decision-making. Investors often rely on Google searches to explore market trends, consumer behavior and political developments, thereby aiding in strategic resource allocation (Da, Engelberg, & Gao, 2011; Mellon, 2014). Internet-based search behavior has become a valuable input in financial modeling, as demonstrated in studies that forecast stock returns (Bank, Larch, & Peter, 2011; Bijl, Kringhaug, Molnár, & Sandvik, 2016; Kim, Lučivjanská, Molnár, & Villa, 2019) and examine socioeconomic phenomena (Pereira et al., 2018). As DT becomes increasingly influential across sectors, search interest in this theme reflects investor attention and market sentiment. The growing search volume for “digital transformation” offers a timely and observable indicator of public interest. Accordingly, this study posits that Google Trends data provides a viable and meaningful proxy for DT trends, with potential predictive value for stock return performance.

The relationship between DT announcements and stock market reactions is shaped by signaling theory and investor attention frameworks. When firms disclose initiatives such as technology adoption, automation or platform development, they signal strategic intent and long-term competitiveness (Plekhanov, Franke, & Netland, 2023). These announcements, when amplified through digital media and online channels, attract significant investor attention (Vial, 2019). This is often observable through spikes in Google search activity related to specific firms or keywords, such as “digital transformation” (Ding, Guan, Chan, & Liu, 2020). As per the investor attention hypothesis, such digitally driven attention can influence trading volume, risk assessment and ultimately, stock price movements (Vozlyublennaia, 2014).

According to the Efficient Market Hypothesis (EMH) proposed by Fama (1970), asset prices in an efficient market fully reflect all available information, rendering it impossible to achieve abnormal returns through public or historical data consistently. However, empirical evidence from Vietnam suggests that its stock market exhibits only weak-form efficiency (D. L. Truong, Lanjouw, & Lensink, 2010; Truong & Friday, 2021; Vo & Truong, 2018). While past price movements may be incorporated into current valuations, public information such as corporate disclosures and macroeconomic signals is not fully reflected.

We propose that this informational inefficiency may partly stem from the country’s ongoing DT. As Google remains the dominant search engine in Vietnam, spikes in search volume, particularly for terms like “digital transformation,” can serve as a proxy for investor attention. This study hypothesizes a significant relationship between GSVI and stock returns, reflecting how market participants process information related to technology.

The studies by Jedynak, Czakon, Kuźniarska, & Mania (2021) and Teng, Wu, & Yang (2022) have shown that DT can enhance operational efficiency and firm performance, and also introduce risks such as cybersecurity threats, resistance to change and high initial costs. This duality reflects the productivity paradox (Solow, 1987), wherein significant technology investments do not always translate into proportional gains (Li & Guo, 2022; Lin & Shao, 2006).

In emerging markets like Vietnam, limited digital infrastructure and workforce readiness may constrain transformation outcomes (Grant & Yeo, 2022). Moreover, behavioral biases, such as overreaction and herding, common among Vietnamese individual investors (Nguyen & Nguyen, 2021; Phan, Zhou, & Abrahamson, 2010), may further distort market reactions. Consequently, heightened search interest may reflect skepticism rather than optimism, potentially exerting negative pressure on stock prices.

Following the approach of Bijl et al. (2016) and Ekinci & Bulut (2021), this study uses weekly data to analyze the relationship between investor attention to DT and stock returns. Weekly data offers multiple advantages: it is consistently available over long periods, unaffected by holidays and aligns with the frequency of Google Trends data. Stock price information was sourced from vn.investing.com, while DT-related search volumes were obtained from Google Trends.

The use of Google Trends is justified in the Vietnamese context, particularly for the HOSE, the largest and most liquid stock market in Vietnam. HOSE is widely accessible via online platforms, allowing nationwide investor participation and minimizing regional disparities. Given Vietnam’s strong push for digitalization, it is reasonable to assume that investors are attuned to DT trends and likely search using Vietnamese terms such as “chuyển đổi số.” Thus, Vietnamese-language search volume serves as a valid proxy for investor attention.

Moreover, weekly data balances the need for granularity and noise reduction. It captures short-term investor sentiment more effectively than monthly data, while avoiding the volatility of daily series, making it ideal for the empirical framework of this study.

Google Trends provides keyword search volume data over defined time frames, offering weekly data for long-term analyses. The GSVI ranges from 0 to 100, representing relative search intensity. Keyword selection is critical; for this study, we extracted data using the Vietnamese term “chuyển đổi số”, which holds strong contextual relevance in Vietnam’s current economic landscape.

Following the methodologies of Bijl et al. (2016) and Kim et al. (2019), we computed the standardized GSVI using the previous 52-week mean and standard deviation of GSV:

(1)

This variable, denoted as digitalGSVI, represents investor attention to DT.

For stock market data, we use the VN-Index as a proxy for HOSE performance, alongside the VN30-Index and VN100-Index, which represent the 30 and 100 largest-cap firms, respectively. These indices cover approximately 90% of HOSE’s total capitalization and 80% of trading volume.

Aligned with Bijl et al. (2016) and Swamy & Dharani (2019), we use the average closing price over a trading week as the basis for stock return calculations:

(2)

Missing values caused by prolonged market closures (e.g. Tet holiday, National holiday) were filled using a ten-period moving average. Specifically, this was applied to weeks 2019w6 and 2022w6.

Stock returns are then computed using log differences:

(3)

Returns based on VN-Index, VN30-Index and VN100-Index are denoted as returnVNIndex, returnVN30 and returnVN100, respectively.

Following the obtained data set, three models are formulated to illustrate the relationship between the search volume of DT and stock return as follows:

(4)
(5)
(6)

To rigorously investigate this relationship, we use a triangulated econometric framework comprising VAR-Granger, OLS and Copula methods. This comprehensive approach captures both linear and nonlinear dynamics, accounting for the complex structure of financial markets and the behavior of investors.

The VAR-Granger method, based on the study by Granger (1969), examines whether shifts in DT attention (proxied by search volume) lead to changes in stock returns. It is well suited to detect dynamic interactions and lagged effects, as demonstrated by Vozlyublennaia (2014).

OLS regression provides a linear estimation of the relationship, allowing for straightforward interpretation and control of additional variables. Masoud & Basahel (2023) have effectively used OLS to assess the impact of digitalization on financial performance.

However, both VAR-Granger and OLS assume linearity and symmetry. To account for asymmetric dependencies and tail behaviors often observed in financial data, we use the Copula approach (Patton, 2012). This model accommodates complex, nonlinear co-movements, especially relevant in emerging markets like Vietnam.

Before estimation, we conducted descriptive statistics, unit root tests, optimal lag selection and co-integration analysis. The empirical results and interpretations are discussed in Section 4.

Table 1 presents the descriptive statistics of the key variables, based on 209 weekly observations from week 33 of 2019 to week 32 of 2023. The returns of VN-30 and VN-100 are marginally higher and closely aligned with the VN-Index, suggesting that investors could have gained slightly better returns by focusing on these sub-indices. The maximum and minimum values reflect considerable volatility, further evidenced by high standard deviations.

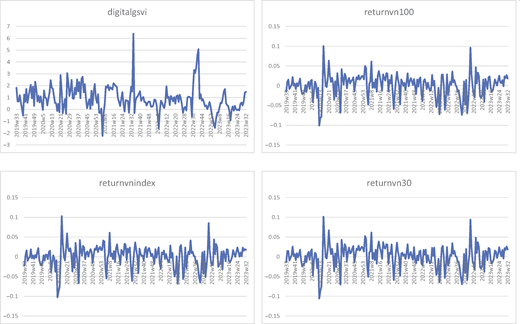
Figure 1 shows that all variables exhibit stochastic behavior without structural breaks, implying no need for threshold-based modeling.

To ensure the suitability of time series analysis, stationarity tests were conducted using the Augmented Dickey–Fuller and Phillips–Perron methods. The results confirm that all variables are stationary at the 1% significance level, validating their integration at level I(0).

In addition to stationarity testing, optimal lag selection and co-integration analysis were conducted following the approach proposed by Lütkepohl (2005). The corresponding estimation results are summarized in Table 1.

The estimation criteria used include Akaike’s Information Criterion (AIC), Hannan and Quinn’s Information Criterion (HQIC), Schwarz’s Bayesian Criterion (SBIC) and the Final Prediction Error (FPE). These measures help determine the optimal lag length. Following Ivanov & Killian (2001), when discrepancies occur among the criteria, AIC is preferred for weekly data. Based on this, a lag length of two was selected for all three models. Using the chosen lags, we performed co-integration tests via the vector error correction model (Johansen, 1988; Lütkepohl, 2005). As shown in Table 1, no long-run co-integration was found, justifying the use of VAR-Granger estimation for further analysis.

Following Nasir, Huynh, Nguyen, & Duong (2019), we used the VAR-Granger approach to explore the causal relationship between DT search volume and stock returns. This test enables the identification of dynamic interactions by incorporating both the lagged values of each variable and those of others. Suitable for both bivariate and multivariate time series, the VAR-Granger approach is especially relevant here, as digital search volume is treated as an exogenous factor influencing stock returns.

As shown in Table 2, the results indicate strong unidirectional causality running from digitalGSVI to returnVNIndex, returnVN30 and returnVN100, with no evidence of reverse causality. These findings suggest that increased investor attention toward DT, reflected in online search behavior, can predict movements in stock returns on the HOSE. This highlights the growing importance of digital media signals and emphasizes that DT plays a vital role in shaping firm performance and broader market dynamics in Vietnam.

Building on the established unidirectional causality, we applied the OLS method to assess the impact of DT on stock returns. Despite certain limitations with time series data, OLS remains a core technique to determine the direction and magnitude of influence. The estimation results are shown in Table 2.

Table 2 shows that the F-values of all three models exceed the critical threshold at the 1% significance level, indicating that the independent variables significantly explain variations in stock returns. Notably, two coefficients returnt− 1 and digitalt−2GSVI are statistically significant at conventional levels (from 5% to 1%). Of primary interest in this study is the coefficient of digitalt−2GSVI⁠, which is consistently negative and significant at the 5%, 5% and 1% levels across the three models, respectively. This indicates that increased search volume for DT two weeks prior is associated with a decline in stock returns on the HOSE. It suggests that investors may adopt a pessimistic stance toward ongoing digitalization efforts by listed firms.

From a sentiment perspective, Google search volume for “digital transformation” serves as a proxy for investor attention and market sentiment. Prior studies have shown that abnormal search intensity often signals heightened uncertainty and attentional shocks (Da et al., 2011). Given the complex and intangible nature of DT, rising search activity may reflect not only curiosity but also concerns over feasibility and delayed payoffs. In Vietnam, where DT initiatives are frequently presented as long-term visions aligned with state policy rather than immediate profit strategies, attention spikes may heighten investor skepticism toward short-term returns.

The observed negative coefficient at a two-week lag is consistent with sentiment-driven corrections documented in prior literature. Initial attention can fuel optimism and temporary price increases, followed by reversals once expectations are reassessed against limited evidence of performance gains (Barberis, Shleifer, & Vishny, 1998; Tetlock, 2007). Empirical evidence from emerging markets further suggests that limited transparency and higher speculation amplify such delayed corrections (Andrei & Hasler, 2015; Zhang, Song, Shen, & Zhang, 2016).

Nonetheless, alternative explanations are plausible. Delayed adverse effects may result from the gradual diffusion of information in thinly traded markets or portfolio rebalancing, where the recognition of execution risks and capital constraints tempers initial enthusiasm. Moreover, domestic media narratives in Vietnam often emphasize barriers to digital adoption, reinforcing skepticism. As recent studies highlight, uneven digital readiness, skill shortages and infrastructure gaps remain critical challenges in emerging markets (Gaglio, Kraemer-Mbula, & Lorenz, 2022; Ghi, Thu, Huan, & Trung, 2022; Walsh, Nguyen, & Hoang, 2023). Thus, the lagged adverse effect of DT-related search activity likely reflects a combination of investor sentiment, market frictions and structural constraints.

Given the high volatility of stock returns, traditional methods like VAR-Granger and OLS may overlook nonlinear dependencies. Therefore, we use the Copula approach to better capture the dependency structure between DT search volume and stock returns, offering more flexible and robust empirical insights.

The Copula approach, as emphasized by Patton (2012), is widely recognized for assessing the dependency structure between random variables. It addresses the limitations of scalar and linear dependency measures by modeling relationships through joint and marginal distributions, including left-tail, right-tail and symmetric (normal) forms. As Copula modeling requires data within the [0, 1] interval, all variables were standardized accordingly.

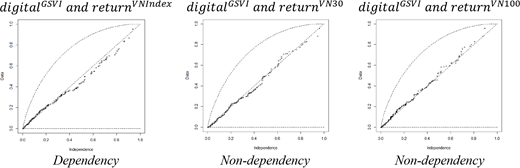
Kendall’s tau, a nonparametric measure, is used to assess monotonic relationships and is particularly effective for nonlinear or asymmetric financial data. Its graphical representation via the Kendall-plot helps detect structural dependencies: alignment with the 45-degree line indicates independence, while deviations suggest dependence. In Figure 2, the plot between digitalGSVI and returnVNIndex reveals such deviation, indicating structural dependence. Other pairings show no significant pattern.

To model these dependencies, we use three Copula families: Clayton (lower-tail dependence), Gumbel (upper-tail dependence) and Gaussian (symmetric dependence), estimated through the maximum pseudo-likelihood method. We use student’s t-distribution for the marginal distributions of the Clayton and Gumbel due to its suitability for fat-tailed financial data, while the normal marginals distributions are used for the Gaussian.

Table 2 indicates that the Gaussian provides the best fit, revealing a symmetric co-movement between DT search volumes and stock returns. This symmetry suggests that investors react with comparable intensity to both positive and negative DT-related signals. Within the framework of EMH, this finding carries important implications for the Vietnamese stock exchange, which is often described as having weak-form efficiency (D. L. Truong et al., 2010; Vo & Truong, 2018). The balanced dependence captured by the Gaussian implies that market participants incorporate DT-related information into stock prices in a timely and relatively unbiased manner, thereby reflecting a degree of informational efficiency.

The symmetric response also suggests an important economic interpretation: the presence of symmetric market risk. Positive and negative shifts in DT search volumes appear equally likely to affect stock returns, suggesting that investors perceive DT discourse as a double-edged source of information, capable of signaling both potential opportunities (e.g. innovation and competitiveness) and risks (e.g. disruption or cost burdens). Rather than privileging optimism or pessimism, the market processes both types of signals as equally informative. This balanced sensitivity is consistent with models of informationally symmetric shocks, where uncertainty is priced without a dominant bias toward either exuberance or fear (Barberis et al., 1998).

At the same time, the structural dependence between search activity and returns highlights the behavioral dimension of investor reactions. Even though the relationship is symmetric, the fact that online search intensity significantly predicts return dynamics suggests that attention-driven trading plays a central role. This aligns with the view of Da et al. (2011), who demonstrate that search-based measures capture investor attention and affect asset pricing. Hence, while earlier studies reported limited reflection of public information in Vietnamese stock prices (D. L. Truong et al., 2010; Vo & Truong, 2018). Our results indicate that specific forms of investor-driven information, particularly those rooted in digital search behavior, are at least partially incorporated into the market.

Finally, the application of the copula framework deepens the understanding of investor behavior under conditions of digital transformation. Despite Vietnam’s emerging market status, where behavioral biases such as herding and overreaction are common, the evidence of symmetric reactions suggests that DT signals are treated as relatively neutral and objective information. This may reflect rising digital literacy, improved access to online information and a gradually maturing investor base, all of which enhance the market’s ability to interpret digital transformation not as unidirectionally positive or negative, but as a balanced risk factor integrated into pricing.

In summary, our study demonstrates that the search volume for DT is a novel factor influencing stock returns on the HOSE. While it may enhance market efficiency in line with EMH, excessive attention, consistent with the productivity paradox, may have unintended negative consequences, especially given Vietnam’s ongoing infrastructure and human capital limitations.

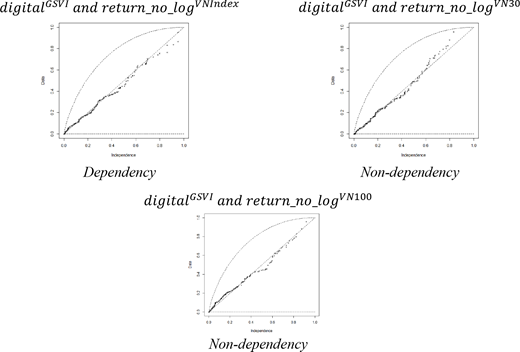
While log returns are preferred for their statistical advantages, arithmetic returns offer a more intuitive interpretation as a simple percentage change. Therefore, arithmetic returns, calculated as return_no_logt=Pt−Pt−1Pt−1⁠, are considered an alternative measure of stock returns and are used for robustness testing. We reestimate our models using arithmetic returns, and the results, presented in the  Appendix (Table A1, Table A2 and Figure A1), closely align with those obtained using log returns, confirming the consistency and reliability of our findings.

The existing literature identifies a gap in understanding how investor attention toward DT, measured through GSVI, relates to stock returns in exchange markets. This study aims to investigate the existence and nature of this relationship using a range of econometric techniques, including VAR-Granger, OLS and Copula approaches.

Empirical results consistently reveal a significant association between GSVI for DT and stock returns on the HOSE, Vietnam’s leading stock exchange. The VAR-Granger analysis confirms a unidirectional causality, suggesting that fluctuations in online search volume precede and influence stock return movements. Complementarily, OLS results indicate that a one-week lag in digital transformation-related search activity has a negative impact on stock returns. These findings are further validated through robustness checks using arithmetic returns instead of log returns, which yield consistent results and reinforce the reliability of the initial estimations. The application of Copula provides additional insights into investor behavior. The Gaussian reveals a symmetric dependency between DT search activity and stock returns, suggesting balanced investor responses to both positive and negative digital signals. This finding, although partially consistent with weak-form market efficiency, also suggests emerging signs of informational responsiveness, potentially driven by increasing digital literacy and broader public access to online financial data.

This study provides several practical implications for investors, firms and regulators in Vietnam and comparable emerging markets. First, GSVI can serve as a timely indicator of market sentiment and potential mispricing. Regulatory bodies, such as the State Securities Commission of Vietnam, could integrate GSVI into their surveillance systems to detect shifts in investor attention and anticipate volatility. Prior work shows that search-based indicators capture real-time investor sentiment and can complement traditional market monitoring tools (Da et al., 2011; Preis, Moat, & Stanley, 2013). For instance, a sudden surge in DT-related searches during periods of uncertainty may reveal rising anxiety and the risk of corrective sell-offs, prompting regulators to issue stabilizing guidance or enhance disclosure requirements. Second, firms should recognize that investor reactions to DT narratives are shaped not only by policy alignment but also by tangible performance outcomes. The observed adverse lagged effect suggests that abstract digital visions may exacerbate skepticism if not backed by concrete evidence. To mitigate this, companies should adopt communication strategies that emphasize measurable milestones, implementation progress and the financial implications of DT projects. This approach can moderate overreaction, enhance transparency and strengthen investor trust in long-term initiatives. Third, the findings highlight structural challenges in Vietnam’s digitalization, including infrastructure constraints and human capital gaps, which heighten investor concerns. Addressing these barriers requires coordinated action at both firm and policy levels, including targeted incentives for SMEs, workforce upskilling programs and regional cooperation on digital readiness (Gaglio et al., 2022; Lyu, Wang, Wu, & Zhang, 2023). By combining search-based sentiment monitoring with improved disclosure and supportive digital policies, both regulators and firms can better align investor expectations with the realities of digital transformation.

This study is subject to several limitations that suggest directions for future research. First, while the GSVI captures the intensity of investor attention, it does not differentiate between positive and negative sentiment. Because sentiment polarity is critical in shaping investor reactions, future studies could classify search-based information into favorable versus unfavorable signals to examine asymmetrical effects on stock returns (Vozlyublennaia, 2014). Second, we did not conduct backtesting of portfolios or trading strategies using GSVI signals. Such analysis would require additional high-frequency trading data, portfolio modeling and risk-adjusted performance evaluation, which extend beyond the scope of this study. Moreover, the absence of backtesting limits our ability to directly quantify the economic value of GSVI for investment strategies. Finally, cross-market comparative studies could enhance generalizability by assessing whether the dynamics observed in Vietnam are also present in other economies.

In conclusion, this study underscores the growing relevance of digital attention metrics in financial forecasting and policy planning, advocating for a more data-informed and investor-sensitive approach to DT.

The tables/figures below present the estimation results using stock returns measured as arithmetic returns, calculated as: return_no_logt=Pt-Pt-1Pt-1
Andrei
,
D.
, &
Hasler
,
M.
(
2015
).
Investor attention and stock market volatility
.
Review of Financial Studies
,
28
(
1
),
33
–
72
, .
Bank
,
M.
,
Larch
,
M.
, &
Peter
,
G.
(
2011
).
Google search volume and its influence on liquidity and returns of German stocks
.
Financial Markets and Portfolio Management
,
25
(
3
),
239
–
264
, .
Barberis
,
N.
,
Shleifer
,
A.
, &
Vishny
,
R.
(
1998
).
A model of investor sentiment
.
Journal of Financial Economics
,
49
(
3
),
307
–
343
, .
Bijl
,
L.
,
Kringhaug
,
G.
,
Molnár
,
P.
, &
Sandvik
,
E.
(
2016
).
Google searches and stock returns
.
International Review of Financial Analysis
,
45
,
150
–
156
, .
Da
,
Z.
,
Engelberg
,
J.
, &
Gao
,
P.
(
2011
).
In search of attention
.
The Journal of Finance
,
66
(
5
),
1461
–
1499
, .
Desagre
,
C.
, &
D’Hondt
,
C.
(
2021
).
Googlization and retail trading activity
.
Journal of Behavioral and Experimental Finance
,
29
,
1
–
14
, .
Ding
,
D.
,
Guan
,
C.
,
Chan
,
C. M. L.
, &
Liu
,
W.
(
2020
).
Building stock market resilience through digital transformation: using Google trends to analyze the impact of COVID-19 pandemic
.
Frontiers of Business Research in China
,
14
(
1
),
1
–
21
, .
Do
,
T. D.
,
Pham
,
H. A. T.
,
Thalassinos
,
E. I.
, &
Le
,
H. A.
(
2022
).
The impact of digital transformation on performance: evidence from Vietnamese commercial banks
.
Journal of Risk and Financial Management
,
15
(
1
),
15
, .
Ekinci
,
C.
, &
Bulut
,
A. E.
(
2021
).
Google search and stock returns: a study on BIST 100 stocks
.
Global Finance Journal
,
47
,
1
–
13
, .
Fama
,
E. F.
(
1970
).
Efficient capital markets: a review of theory and empirical work
.
The Journal of Finance
,
25
(
2
),
383
–
417
, .
Fan
,
M.-H.
,
Chen
,
M.-Y.
, &
Liao
,
E.-C.
(
2021
).
A deep learning approach for financial market prediction: utilization of Google trends and keywords
.
Granular Computing
,
6
(
1
),
207
–
216
, .
Gaglio
,
C.
,
Kraemer-Mbula
,
E.
, &
Lorenz
,
E.
(
2022
).
The effects of digital transformation on innovation and productivity: firm-level evidence of South African manufacturing micro and small enterprises
.
Technological Forecasting and Social Change
,
182
,
121785
, .
Ghi
,
T.
,
Thu
,
N.
,
Huan
,
N.
, &
Trung
,
N.
(
2022
).
Human capital, digital transformation, and firm performance of startups in Vietnam
.
Management
,
26
(
1
),
1
–
18
, .
Granger
,
C. W. J.
(
1969
).
Investigating causal relations by econometric models and cross-spectral methods
.
Econometrica
,
37
(
3
),
424
–
438
. doi: .
Grant
,
D.
, &
Yeo
,
B.
(
2022
).
Resource-based view of the productivity paradox
.
Technology Analysis & Strategic Management
,
1
–
16
, .
Guo
,
L.
, &
Xu
,
L.
(
2021
).
The effects of digital transformation on firm performance: evidence from China’s manufacturing sector
.
Sustainability
,
13
(
22
),
12844
, .
Huang
,
M. Y.
,
Rojas
,
R. R.
, &
Convery
,
P. D.
(
2020
).
Forecasting stock market movements using Google Trend searches
.
Empirical Economics
,
59
(
6
),
2821
–
2839
, .
Ivanov
,
V.
, &
Killian
,
L.
(
2001
).
A practitioner’s guide to lag-order selection for vector autoregressions
.
Centre for Economic Policy Research
. Retrieved from Link to A practitioner’s guide to lag-order selection for vector autoregressionsLink to the cited article
Jardak
,
M. K.
, &
Ben Hamad
,
S.
(
2022
).
The effect of digital transformation on firm performance: evidence from Swedish listed companies
.
The Journal of Risk Finance
,
23
(
4
),
329
–
348
, .
Jedynak
,
M.
,
Czakon
,
W.
,
Kuźniarska
,
A.
, &
Mania
,
K.
(
2021
).
Digital transformation of organizations: What do we know and where to go next?
Journal of Organizational Change Management
,
34
(
3
),
629
–
652
, .
Johansen
,
S.
(
1988
).
Statistical analysis of co-integration vectors
.
Journal of Economic Dynamics and Control
,
12
(
2-3
),
231
–
254
, .
Kim
,
N.
,
Lučivjanská
,
K.
,
Molnár
,
P.
, &
Villa
,
R.
(
2019
).
Google searches and stock market activity: evidence from Norway
.
Finance Research Letters
,
28
,
208
–
220
, .
Li
,
M.
, &
Guo
,
X.
(
2022
).
Research on the productivity paradox of information technology
.
Proceedings of Business and Economic Studies
,
5
(
2
),
19
–
27
, .
Li
,
Y.
,
Goodell
,
J. W.
, &
Shen
,
D.
(
2021
).
Comparing search-engine and social-media attentions in finance research: Evidence from cryptocurrencies
.
International Review of Economics & Finance
,
75
,
723
–
746
, .
Lin
,
W. T.
, &
Shao
,
B. B. M.
(
2006
).
The business value of information technology and inputs substitution: the productivity paradox revisited
.
Decision Support Systems
,
42
(
2
),
493
–
507
, .
Lütkepohl
,
H.
(
2005
). New introduction to multiple time series analysis.
Springer science & business media
,
Springer
,
Berlin Heidelberg
, .
Lyu
,
Y.
,
Wang
,
W.
,
Wu
,
Y.
, &
Zhang
,
J.
(
2023
).
How does digital economy affect green total factor productivity? Evidence from China
.
Science of The Total Environment
,
857
,
159428
, .
Masoud
,
R.
, &
Basahel
,
S.
(
2023
).
The effects of digital transformation on firm performance: the role of customer experience and IT innovation
.
Digital
,
3
(
2
),
109
–
126
, .
McGinn
,
T.
,
Taylor
,
B.
,
McColgan
,
M.
, &
McQuilkan
,
J.
(
2016
).
Social work literature searching
.
Research on Social Work Practice
,
26
(
3
),
266
–
277
, .
Mellon
,
J.
(
2014
).
Internet search data and issue salience: the properties of Google Trends as a measure of issue salience
.
Journal of Elections, Public Opinion and Parties
,
24
(
1
),
45
–
72
, .
Nasir
,
M. A.
,
Huynh
,
T. L. D.
,
Nguyen
,
S. P.
, &
Duong
,
D.
(
2019
).
Forecasting cryptocurrency returns and volume using search engines
.
Financial Innovation
,
5
(
1
),
1
–
13
, .
Nguyen
,
T. X. H.
, &
Nguyen
,
T. T.
(
2021
).
A model for assessing the digital transformation readiness for Vietnamese SMEs
.
Journal of Eastern European and Central Asian Research
,
8
(
4
),
541
–
555
, .
Patton
,
A. J.
(
2012
).
A review of copula models for economic time series
.
Journal of Multivariate Analysis
,
110
,
4
–
18
, .
Peng
,
Y.
, &
Tao
,
C.
(
2022
).
Can digital transformation promote enterprise performance? —from the perspective of public policy and innovation
.
Journal of Innovation & Knowledge
,
7
(
3
),
100198
, .
Pereira
,
E. J.
,
de
,
A. L.
,
Silva
,
M. F.
,
Lima
,
I. C.
&
Pereira
,
H. B. B.
(
2018
).
Trump’s effect on stock markets: a multiscale approach
.
Physica A: Statistical Mechanics and Its Applications
,
512
,
241
–
247
, .
Phan
,
P.
,
Zhou
,
J.
, &
Abrahamson
,
E.
(
2010
).
Creativity, innovation, and entrepreneurship in China
.
Management and Organization Review
,
6
(
2
),
175
–
194
, .
Plekhanov
,
D.
,
Franke
,
H.
, &
Netland
,
T. H.
(
2023
).
Digital transformation: a review and research agenda
.
European Management Journal
,
41
(
6
),
821
–
844
, .
Preis
,
T.
,
Moat
,
H. S.
, &
Stanley
,
H. E.
(
2013
).
Quantifying trading behavior in financial markets using Google Trends
.
Scientific Reports
,
3
(
1
),
1684
, .
Ren
,
C.
,
Lee
,
S. J.
, &
Hu
,
C.
(
2023
).
Digitalization improves enterprise performance: new evidence by text analysis
.
Sage Open
,
13
(
2
),
1
–
10
, .
Ribeiro-Navarrete
,
S.
,
Botella-Carrubi
,
D.
,
Palacios-Marqués
,
D.
, &
Orero-Blat
,
M.
(
2021
).
The effect of digitalization on business performance: an applied study of KIBS
.
Journal of Business Research
,
126
(
July 2020
),
319
–
326
, .
Scharkow
,
M.
, &
Vogelgesang
,
J.
(
2011
).
Measuring the public agenda using search engine queries
.
International Journal of Public Opinion Research
,
23
(
1
),
104
–
113
, .
Smales
,
L. A.
(
2021
).
Investor attention and global market returns during the COVID-19 crisis
.
International Review of Financial Analysis
,
73
,
1
–
14
, .
Solow
,
R. M.
(
1987
).
We’d better watch out
.
New York Times Book Review. Sociology
.Retrieved from Link to We’d better watch outLink to the cited article
Swamy
,
V.
, &
Dharani
,
M.
(
2019
).
Investor attention using the Google search volume index – impact on stock returns
.
Review of Behavioral Finance
,
11
(
1
),
55
–
69
, .
Teng
,
X.
,
Wu
,
Z.
, &
Yang
,
F.
(
2022
).
Research on the relationship between digital transformation and performance of SMEs
.
Sustainability (Switzerland)
,
14
(
10
),
1
–
17
, .
Tetlock
,
P. C.
(
2007
).
Giving content to investor sentiment: the role of media in the stock market
.
The Journal of Finance
,
62
(
3
),
1139
–
1168
, .
Truong
,
L. D.
, &
Friday
,
H. S.
(
2021
).
The impact of the introduction of index futures on the daily returns anomaly in the Ho Chi Minh Stock Exchange
.
International Journal of Financial Studies
,
9
(
3
),
43
, .
Truong
,
D. L.
,
Lanjouw
,
G.
, &
Lensink
,
R.
(
2010
).
Stock-market efficiency in thin-trading markets: the case of the Vietnamese stock market
.
Applied Economics
,
42
(
27
),
3519
–
3532
, .
Vial
,
G.
(
2019
).
Understanding digital transformation: a review and a research agenda
.
The Journal of Strategic Information Systems
,
28
(
2
),
118
–
144
, .
Vo
,
X. V.
, &
Truong
,
Q. B.
(
2018
).
Does momentum work? Evidence from Vietnam stock market
.
Journal of Behavioral and Experimental Finance
,
17
,
10
–
15
, .
Vozlyublennaia
,
N.
(
2014
).
Investor attention, index performance, and return predictability
.
Journal of Banking & Finance
,
41
,
17
–
35
, .
Walsh
,
J.
,
Nguyen
,
T. Q.
, &
Hoang
,
T.
(
2023
).
Digital transformation in Vietnamese SMEs: managerial implications
.
Journal of Internet and Digital Economics
,
3
(
1-2
), .
Zhang
,
Y.
,
Song
,
W.
,
Shen
,
D.
, &
Zhang
,
W.
(
2016
).
Market reaction to internet news: Information diffusion and price pressure
.
Economic Modelling
,
56
,
43
–
49
, .
Published by Emerald Publishing Limited. This article is published under the Creative Commons Attribution (CC BY 4.0) licence. Anyone may reproduce, distribute, translate and create derivative works of this article (for both commercial and non-commercial purposes), subject to full attribution to the original publication and authors. The full terms of this licence maybe seen at Link to the terms of the CC BY 4.0 licenceLink to the terms of the CC BY 4.0 licence.

Data & Figures

Figure 1.
Four line graphs display time series data with variables labelled digital G S V I, return V N 30, return V N Index, and return V N 100, across weeks from 2019 to 2023.The image displays four line graphs arranged in a two by two grid, each representing different time series data over various weeks from 2019 to 2023. The top left graph is labelled digital G S V I and shows fluctuations around a baseline, with values ranging approximately from negative 0.15 to positive 0.15. The top right graph is labelled return V N Index and fluctuates within a wider range, extending from negative 2 to approximately positive 7. The bottom left graph is labelled return V N 30 and shows value fluctuations within a range similar to digital G S V I. The bottom right graph is labelled return V N 100 and remains largely within a range of negative 3 to positive 3. The horizontal axis represents time segmented into weeks from 2019 W 41 to 2023 W 42, and each vertical axis shows the corresponding variable values.

Movement of variables

Source: the authors

Figure 1.
Four line graphs display time series data with variables labelled digital G S V I, return V N 30, return V N Index, and return V N 100, across weeks from 2019 to 2023.The image displays four line graphs arranged in a two by two grid, each representing different time series data over various weeks from 2019 to 2023. The top left graph is labelled digital G S V I and shows fluctuations around a baseline, with values ranging approximately from negative 0.15 to positive 0.15. The top right graph is labelled return V N Index and fluctuates within a wider range, extending from negative 2 to approximately positive 7. The bottom left graph is labelled return V N 30 and shows value fluctuations within a range similar to digital G S V I. The bottom right graph is labelled return V N 100 and remains largely within a range of negative 3 to positive 3. The horizontal axis represents time segmented into weeks from 2019 W 41 to 2023 W 42, and each vertical axis shows the corresponding variable values.

Movement of variables

Source: the authors

Close Figure 1.
Figure 2.
Three scatter plots illustrate the relationship between digital G S V I and return for different data sets, labelled as dependency and non-dependency, with data points plotted against independence.The image contains three scatter plots showing the relationship between digital G S V I and return across different data sets, distinguished as dependency and non-dependency. Each plot has the horizontal axis labelled independence, ranging from 0 to 1, and the vertical axis labelled data, also ranging from 0 to 1. Data points are shown as black crosses, illustrating the distribution of values within each category. Dashed lines indicate fitted trends. The left plot is labelled dependency, the middle plot is labelled non-dependency, and the right plot is also labelled non-dependency, indicating separate analyses within the non-dependency category. The plots are arranged horizontally in a single row to allow comparison.

Kendall-plot graphics for diagnosing dependency structure among pair variables

Source: the authors

Figure 2.
Three scatter plots illustrate the relationship between digital G S V I and return for different data sets, labelled as dependency and non-dependency, with data points plotted against independence.The image contains three scatter plots showing the relationship between digital G S V I and return across different data sets, distinguished as dependency and non-dependency. Each plot has the horizontal axis labelled independence, ranging from 0 to 1, and the vertical axis labelled data, also ranging from 0 to 1. Data points are shown as black crosses, illustrating the distribution of values within each category. Dashed lines indicate fitted trends. The left plot is labelled dependency, the middle plot is labelled non-dependency, and the right plot is also labelled non-dependency, indicating separate analyses within the non-dependency category. The plots are arranged horizontally in a single row to allow comparison.

Kendall-plot graphics for diagnosing dependency structure among pair variables

Source: the authors

Close Figure 2.
Figure A1.
Three scatter plots compare digital G S V I and return no log for V N Index, V N 30, and V N 100 under dependency and non-dependency conditions.Three scatter plots show the relationship between digital G S V I and return no log for three market measures. In the first plot, digital G S V I and return no log V N Index are shown under dependency, with data points rising gradually from independence 0 toward 1 and lying below the curved reference boundary, indicating deviation from independence. In the second plot, digital G S V I and return no log V N 30 are shown under non-dependency, where data points follow a near-linear upward pattern closely aligned with the diagonal independence line. In the third plot, digital G S V I and return no log V N 100 also show non-dependency, with points distributed along the diagonal from low to high independence values. All plots use independence on the horizontal axis from 0 to 1 and data on the vertical axis from 0 to 1, with dashed curves marking theoretical reference limits.

Kendall-plot graphics for diagnosing dependency structure among pair variables

Source: the authors

Figure A1.
Three scatter plots compare digital G S V I and return no log for V N Index, V N 30, and V N 100 under dependency and non-dependency conditions.Three scatter plots show the relationship between digital G S V I and return no log for three market measures. In the first plot, digital G S V I and return no log V N Index are shown under dependency, with data points rising gradually from independence 0 toward 1 and lying below the curved reference boundary, indicating deviation from independence. In the second plot, digital G S V I and return no log V N 30 are shown under non-dependency, where data points follow a near-linear upward pattern closely aligned with the diagonal independence line. In the third plot, digital G S V I and return no log V N 100 also show non-dependency, with points distributed along the diagonal from low to high independence values. All plots use independence on the horizontal axis from 0 to 1 and data on the vertical axis from 0 to 1, with dashed curves marking theoretical reference limits.

Kendall-plot graphics for diagnosing dependency structure among pair variables

Source: the authors

Close Figure A1.
Table 1.

Pre-Estimation Analysis

VariableObs.MeanSDMinMaxDickey-FullerPhillips-Perron
Panel 1 - 1. Descriptive statistics and stationary test
digitalGSVI2090.89344561.048732−2.2369456.389808−8.356***−8.562***
returnVNIndex2090.00098420.0267742−0.10258580.1027658−10.203***−10.013***
returnVN302090.00155180.0277948−0.10574830.1014413−10.333***−10.170***
returnVN1002090.00153750.0280615−0.10069650.1004145−10.199***−10.026***
Lag/RankFPEAICHQICSBICLLEigenvalueTrace statistic5% critical value
Panel 1–2. Optimal lag selection test and co-integration test
Model 1: returnVNIndex = f(digitalGSVI)
00.000804−1.45052−1.43741−1.4181153.41551 101.314315.41
10.000544−1.83993−1.80059*−1.74267*188.036130.2843032.07313.76
20.000534*−1.85918*−1.79361−1.69708204.072660.14354  
30.000545−1.83917−1.74738−1.61223    
Model 2: returnVN30 = f(digitalGSVI)
00.000869−1.37205−1.35894−1.33963143.51846 101.338915.41
10.000595−1.75071−1.71137*−1.65345*178.005720.2833832.36433.76
20.000588*−1.76279*−1.69723−1.6007194.187880.14474  
30.0006−1.74222−1.65043−1.51529    
Model 3: returnVN100 = f(digitalGSVI)
00.000886−1.35264−1.33952−1.32022143.51512 101.600215.41
10.000598−1.74545−1.70611*−1.64819*178.23430.2849832.16183.76
20.000587*−1.76393*−1.69836−1.60183194.315210.14390  
30.000603−1.73714−1.64535−1.5102    
Note(s):

* is the suggestion of lag-order selection; *** indicates that the variable is stationary at significance levels of 1%

Source(s): the authors
Table 2.

Estimation analysis

VariableReturnvnindexDigitalgsviAll
Panel 2 - 1. VAR-Granger estimation
returnVNIndex–10.182***10.182***
digitalGSVI1.9011–1.9011
VariablereturnVN30digitalGSVIAll
returnVN30–9.3026***9.3026***
digitalGSVI1.4789–1.4789
VariablereturnVN100digitalGSVIAll
returnVN100–11.051***11.051***
digitalGSVI1.8535–1.8535
VariableReturnvnindexReturnvn30Returnvn100
Coeficientt-statisticCoeficientt-statisticCoeficientt-statistic
Panel 2 - 2. OLS estimation
returnt-10.3526431***5.020.3309948***4.710.3509134***5.00
returnt-2−0.0760245−1.11−0.0627852−0.91−0.0758118−1.10
digitalGSVI−0.0018637−0.96−0.0015548−0.76−0.0015325−0.75
digitalt−1GSVI−0.0052159**−2.53−0.0052877**−2.45−0.005878***−2.72
digitalt−2GSVI0.00288541.460.00238291.150.0029051.40
Cons.0.0045067*1.770.0050915*1.900.0051313*1.92
N207207207
F-value7.76***6.93***7.83***
R-Square0.16180.14710.1630
 ClaytonGumbelGaussian
Panel 2–3. Estimated parameters of the pair variables of digitalGSVI and returnVNIndex
Parameter−0.064991−0.086†
Loglikeihood0.4553−2.277e-070.7092
Note(s):

*, **, and *** are significant at the 10, 5 and 1% levels, respectively; The null hypothesis is that the variable in the row is not a Granger cause variable in the column.; † is the fittest estimation

Source(s): the authors
Table A1.

Pre-Estimation Analysis (with arithmetic return)

VariableObs.MeanSDMinMaxDickey-FullerPhillips-Perron
Panel 3–1. Descriptive statistics and stationary test
digitalGSVI2090.00134020.0266363−0.09749930.1082318−10.293***−10.098***
return_no_logVNIndex2090.00193660.0276952−0.1003490.1067649−10.420***−10.252***
return_no_logVN302090.00192940.027929−0.09579260.1056291−10.278***−10.099***
return_no_logVN1002090.00134020.0266363−0.09749930.1082318−10.293***−10.098***
Lag/RankFPEAICHQICSBICLLEigenvalueTrace statistic5% critical value
Panel 3–2. Optimal lag selection test and co-integration test
Model 1: return_no_logVNIndex = f(digitalGSVI)
00.000796−1.4603−1.44719−1.42788153.14709 102.584015.41
10.000543−1.84355−1.80421*−1.74629*188.390810.2886032.09653.76
20.000532*−1.86276*−1.79719−1.70066204.439070.14363  
30.000543−1.84325−1.75146−1.61631    
Model 2: return_no_logVN30= f(digitalGSVI)
00.000864−1.37856−1.36544−1.34614142.94759 102.587815.41
10.000595−1.7513−1.71196*−1.65404*178.050280.2876332.38243.76
20.000588*−1.76334*−1.69777−1.60124194.241480.14481  
30.0006−1.74311−1.65132−1.51617    
Model 3: return_no_logVN100 = f(digitalGSVI)
00.000878−1.36155−1.34843−1.32913143.21048 102.869715.41
10.000597−1.74862−1.70928*−1.65136*178.553240.2892832.18413.76
20.000586*−1.76715*−1.70159−1.60505194.64530.14399  
30.000601−1.74088−1.64909−1.51395    
Note(s):

***Indicates that the variable is stationary at significance levels of 1% *is the suggestion of lag-order selection

Source(s): the authors
Table A2.

Estimation analysis (with arithmetic return)

Variablereturn_no_logVNIndexdigitalGSVIdigitalGSVI
Panel 4–1. VAR-Granger estimation
return_no_logVNIndex–9.901***9.901***
digitalGSVI1.8498–1.8498
Variablereturn_no_logVN30digitalGSVIdigitalGSVI
return_no_logVN30–8.9725**8.9725**
digitalGSVI1.4135–1.4135
Variablereturn_no_logVN100digitalGSVIAll
return_no_logVN100–10.704***10.704***
digitalGSVI1.7764–1.7764
VariableReturn_no_logVNIndexReturn_no_logVN30Return_no_logVN100
Coeficientt-statisticCoeficientt-statisticCoeficientt-statistic
Panel 4–2. OLS estimation
return_no_logt-10.3453624***4.920.3243869***4.620.3449814***4.92
return_no_logt-2−0.0808398−1.18−0.0680587−0.99−0.0815003−1.19
digitalGSVI−0.0017943−0.93−0.0014848−0.73−0.0014667−0.72
digitalt−1GSVI−0.0051437**−2.50−0.0051968**−2.41−0.0057832***−2.68
digitalt−2GSVI0.00277921.410.00227421.100.00279321.35
Cons.0.0047502*1.860.0053509*2.000.0053957*2.01
N207207207
F-value7.44***6.63***7.55***
R-Square0.15620.14160.1580
VariableClaytonGumbelGaussian
Panel 4–3. Estimated parameters of the pair variables of digitalGSVI and return_no_logVNIndex
Parameter−0.064991−0.086*
Loglikeihood0.4553−2.277e-070.7092
Note(s):

*, **, and *** are significant at the 10, 5, and 1% levels, respectively; The null hypothesis is that the variable in the row is not a Granger cause variable in the column *, **, and *** are significant at the 10, 5, and 1% levels, respectively *is the fittest estimation

Source(s): the authors

Supplements

References

Andrei
,
D.
, &
Hasler
,
M.
(
2015
).
Investor attention and stock market volatility
.
Review of Financial Studies
,
28
(
1
),
33
–
72
, .
Bank
,
M.
,
Larch
,
M.
, &
Peter
,
G.
(
2011
).
Google search volume and its influence on liquidity and returns of German stocks
.
Financial Markets and Portfolio Management
,
25
(
3
),
239
–
264
, .
Barberis
,
N.
,
Shleifer
,
A.
, &
Vishny
,
R.
(
1998
).
A model of investor sentiment
.
Journal of Financial Economics
,
49
(
3
),
307
–
343
, .
Bijl
,
L.
,
Kringhaug
,
G.
,
Molnár
,
P.
, &
Sandvik
,
E.
(
2016
).
Google searches and stock returns
.
International Review of Financial Analysis
,
45
,
150
–
156
, .
Da
,
Z.
,
Engelberg
,
J.
, &
Gao
,
P.
(
2011
).
In search of attention
.
The Journal of Finance
,
66
(
5
),
1461
–
1499
, .
Desagre
,
C.
, &
D’Hondt
,
C.
(
2021
).
Googlization and retail trading activity
.
Journal of Behavioral and Experimental Finance
,
29
,
1
–
14
, .
Ding
,
D.
,
Guan
,
C.
,
Chan
,
C. M. L.
, &
Liu
,
W.
(
2020
).
Building stock market resilience through digital transformation: using Google trends to analyze the impact of COVID-19 pandemic
.
Frontiers of Business Research in China
,
14
(
1
),
1
–
21
, .
Do
,
T. D.
,
Pham
,
H. A. T.
,
Thalassinos
,
E. I.
, &
Le
,
H. A.
(
2022
).
The impact of digital transformation on performance: evidence from Vietnamese commercial banks
.
Journal of Risk and Financial Management
,
15
(
1
),
15
, .
Ekinci
,
C.
, &
Bulut
,
A. E.
(
2021
).
Google search and stock returns: a study on BIST 100 stocks
.
Global Finance Journal
,
47
,
1
–
13
, .
Fama
,
E. F.
(
1970
).
Efficient capital markets: a review of theory and empirical work
.
The Journal of Finance
,
25
(
2
),
383
–
417
, .
Fan
,
M.-H.
,
Chen
,
M.-Y.
, &
Liao
,
E.-C.
(
2021
).
A deep learning approach for financial market prediction: utilization of Google trends and keywords
.
Granular Computing
,
6
(
1
),
207
–
216
, .
Gaglio
,
C.
,
Kraemer-Mbula
,
E.
, &
Lorenz
,
E.
(
2022
).
The effects of digital transformation on innovation and productivity: firm-level evidence of South African manufacturing micro and small enterprises
.
Technological Forecasting and Social Change
,
182
,
121785
, .
Ghi
,
T.
,
Thu
,
N.
,
Huan
,
N.
, &
Trung
,
N.
(
2022
).
Human capital, digital transformation, and firm performance of startups in Vietnam
.
Management
,
26
(
1
),
1
–
18
, .
Granger
,
C. W. J.
(
1969
).
Investigating causal relations by econometric models and cross-spectral methods
.
Econometrica
,
37
(
3
),
424
–
438
. doi: .
Grant
,
D.
, &
Yeo
,
B.
(
2022
).
Resource-based view of the productivity paradox
.
Technology Analysis & Strategic Management
,
1
–
16
, .
Guo
,
L.
, &
Xu
,
L.
(
2021
).
The effects of digital transformation on firm performance: evidence from China’s manufacturing sector
.
Sustainability
,
13
(
22
),
12844
, .
Huang
,
M. Y.
,
Rojas
,
R. R.
, &
Convery
,
P. D.
(
2020
).
Forecasting stock market movements using Google Trend searches
.
Empirical Economics
,
59
(
6
),
2821
–
2839
, .
Ivanov
,
V.
, &
Killian
,
L.
(
2001
).
A practitioner’s guide to lag-order selection for vector autoregressions
.
Centre for Economic Policy Research
. Retrieved from Link to A practitioner’s guide to lag-order selection for vector autoregressionsLink to the cited article
Jardak
,
M. K.
, &
Ben Hamad
,
S.
(
2022
).
The effect of digital transformation on firm performance: evidence from Swedish listed companies
.
The Journal of Risk Finance
,
23
(
4
),
329
–
348
, .
Jedynak
,
M.
,
Czakon
,
W.
,
Kuźniarska
,
A.
, &
Mania
,
K.
(
2021
).
Digital transformation of organizations: What do we know and where to go next?
Journal of Organizational Change Management
,
34
(
3
),
629
–
652
, .
Johansen
,
S.
(
1988
).
Statistical analysis of co-integration vectors
.
Journal of Economic Dynamics and Control
,
12
(
2-3
),
231
–
254
, .
Kim
,
N.
,
Lučivjanská
,
K.
,
Molnár
,
P.
, &
Villa
,
R.
(
2019
).
Google searches and stock market activity: evidence from Norway
.
Finance Research Letters
,
28
,
208
–
220
, .
Li
,
M.
, &
Guo
,
X.
(
2022
).
Research on the productivity paradox of information technology
.
Proceedings of Business and Economic Studies
,
5
(
2
),
19
–
27
, .
Li
,
Y.
,
Goodell
,
J. W.
, &
Shen
,
D.
(
2021
).
Comparing search-engine and social-media attentions in finance research: Evidence from cryptocurrencies
.
International Review of Economics & Finance
,
75
,
723
–
746
, .
Lin
,
W. T.
, &
Shao
,
B. B. M.
(
2006
).
The business value of information technology and inputs substitution: the productivity paradox revisited
.
Decision Support Systems
,
42
(
2
),
493
–
507
, .
Lütkepohl
,
H.
(
2005
). New introduction to multiple time series analysis.
Springer science & business media
,
Springer
,
Berlin Heidelberg
, .
Lyu
,
Y.
,
Wang
,
W.
,
Wu
,
Y.
, &
Zhang
,
J.
(
2023
).
How does digital economy affect green total factor productivity? Evidence from China
.
Science of The Total Environment
,
857
,
159428
, .
Masoud
,
R.
, &
Basahel
,
S.
(
2023
).
The effects of digital transformation on firm performance: the role of customer experience and IT innovation
.
Digital
,
3
(
2
),
109
–
126
, .
McGinn
,
T.
,
Taylor
,
B.
,
McColgan
,
M.
, &
McQuilkan
,
J.
(
2016
).
Social work literature searching
.
Research on Social Work Practice
,
26
(
3
),
266
–
277
, .
Mellon
,
J.
(
2014
).
Internet search data and issue salience: the properties of Google Trends as a measure of issue salience
.
Journal of Elections, Public Opinion and Parties
,
24
(
1
),
45
–
72
, .
Nasir
,
M. A.
,
Huynh
,
T. L. D.
,
Nguyen
,
S. P.
, &
Duong
,
D.
(
2019
).
Forecasting cryptocurrency returns and volume using search engines
.
Financial Innovation
,
5
(
1
),
1
–
13
, .
Nguyen
,
T. X. H.
, &
Nguyen
,
T. T.
(
2021
).
A model for assessing the digital transformation readiness for Vietnamese SMEs
.
Journal of Eastern European and Central Asian Research
,
8
(
4
),
541
–
555
, .
Patton
,
A. J.
(
2012
).
A review of copula models for economic time series
.
Journal of Multivariate Analysis
,
110
,
4
–
18
, .
Peng
,
Y.
, &
Tao
,
C.
(
2022
).
Can digital transformation promote enterprise performance? —from the perspective of public policy and innovation
.
Journal of Innovation & Knowledge
,
7
(
3
),
100198
, .
Pereira
,
E. J.
,
de
,
A. L.
,
Silva
,
M. F.
,
Lima
,
I. C.
&
Pereira
,
H. B. B.
(
2018
).
Trump’s effect on stock markets: a multiscale approach
.
Physica A: Statistical Mechanics and Its Applications
,
512
,
241
–
247
, .
Phan
,
P.
,
Zhou
,
J.
, &
Abrahamson
,
E.
(
2010
).
Creativity, innovation, and entrepreneurship in China
.
Management and Organization Review
,
6
(
2
),
175
–
194
, .
Plekhanov
,
D.
,
Franke
,
H.
, &
Netland
,
T. H.
(
2023
).
Digital transformation: a review and research agenda
.
European Management Journal
,
41
(
6
),
821
–
844
, .
Preis
,
T.
,
Moat
,
H. S.
, &
Stanley
,
H. E.
(
2013
).
Quantifying trading behavior in financial markets using Google Trends
.
Scientific Reports
,
3
(
1
),
1684
, .
Ren
,
C.
,
Lee
,
S. J.
, &
Hu
,
C.
(
2023
).
Digitalization improves enterprise performance: new evidence by text analysis
.
Sage Open
,
13
(
2
),
1
–
10
, .
Ribeiro-Navarrete
,
S.
,
Botella-Carrubi
,
D.
,
Palacios-Marqués
,
D.
, &
Orero-Blat
,
M.
(
2021
).
The effect of digitalization on business performance: an applied study of KIBS
.
Journal of Business Research
,
126
(
July 2020
),
319
–
326
, .
Scharkow
,
M.
, &
Vogelgesang
,
J.
(
2011
).
Measuring the public agenda using search engine queries
.
International Journal of Public Opinion Research
,
23
(
1
),
104
–
113
, .
Smales
,
L. A.
(
2021
).
Investor attention and global market returns during the COVID-19 crisis
.
International Review of Financial Analysis
,
73
,
1
–
14
, .
Solow
,
R. M.
(
1987
).
We’d better watch out
.
New York Times Book Review. Sociology
.Retrieved from Link to We’d better watch outLink to the cited article
Swamy
,
V.
, &
Dharani
,
M.
(
2019
).
Investor attention using the Google search volume index – impact on stock returns
.
Review of Behavioral Finance
,
11
(
1
),
55
–
69
, .
Teng
,
X.
,
Wu
,
Z.
, &
Yang
,
F.
(
2022
).
Research on the relationship between digital transformation and performance of SMEs
.
Sustainability (Switzerland)
,
14
(
10
),
1
–
17
, .
Tetlock
,
P. C.
(
2007
).
Giving content to investor sentiment: the role of media in the stock market
.
The Journal of Finance
,
62
(
3
),
1139
–
1168
, .
Truong
,
L. D.
, &
Friday
,
H. S.
(
2021
).
The impact of the introduction of index futures on the daily returns anomaly in the Ho Chi Minh Stock Exchange
.
International Journal of Financial Studies
,
9
(
3
),
43
, .
Truong
,
D. L.
,
Lanjouw
,
G.
, &
Lensink
,
R.
(
2010
).
Stock-market efficiency in thin-trading markets: the case of the Vietnamese stock market
.
Applied Economics
,
42
(
27
),
3519
–
3532
, .
Vial
,
G.
(
2019
).
Understanding digital transformation: a review and a research agenda
.
The Journal of Strategic Information Systems
,
28
(
2
),
118
–
144
, .
Vo
,
X. V.
, &
Truong
,
Q. B.
(
2018
).
Does momentum work? Evidence from Vietnam stock market
.
Journal of Behavioral and Experimental Finance
,
17
,
10
–
15
, .
Vozlyublennaia
,
N.
(
2014
).
Investor attention, index performance, and return predictability
.
Journal of Banking & Finance
,
41
,
17
–
35
, .
Walsh
,
J.
,
Nguyen
,
T. Q.
, &
Hoang
,
T.
(
2023
).
Digital transformation in Vietnamese SMEs: managerial implications
.
Journal of Internet and Digital Economics
,
3
(
1-2
), .
Zhang
,
Y.
,
Song
,
W.
,
Shen
,
D.
, &
Zhang
,
W.
(
2016
).
Market reaction to internet news: Information diffusion and price pressure
.
Economic Modelling
,
56
,
43
–
49
, .

Languages

or Create an Account

Close subscription notice
Close access options